PCR Diagram Generator
Turn a sentence into a labeled PCR figure
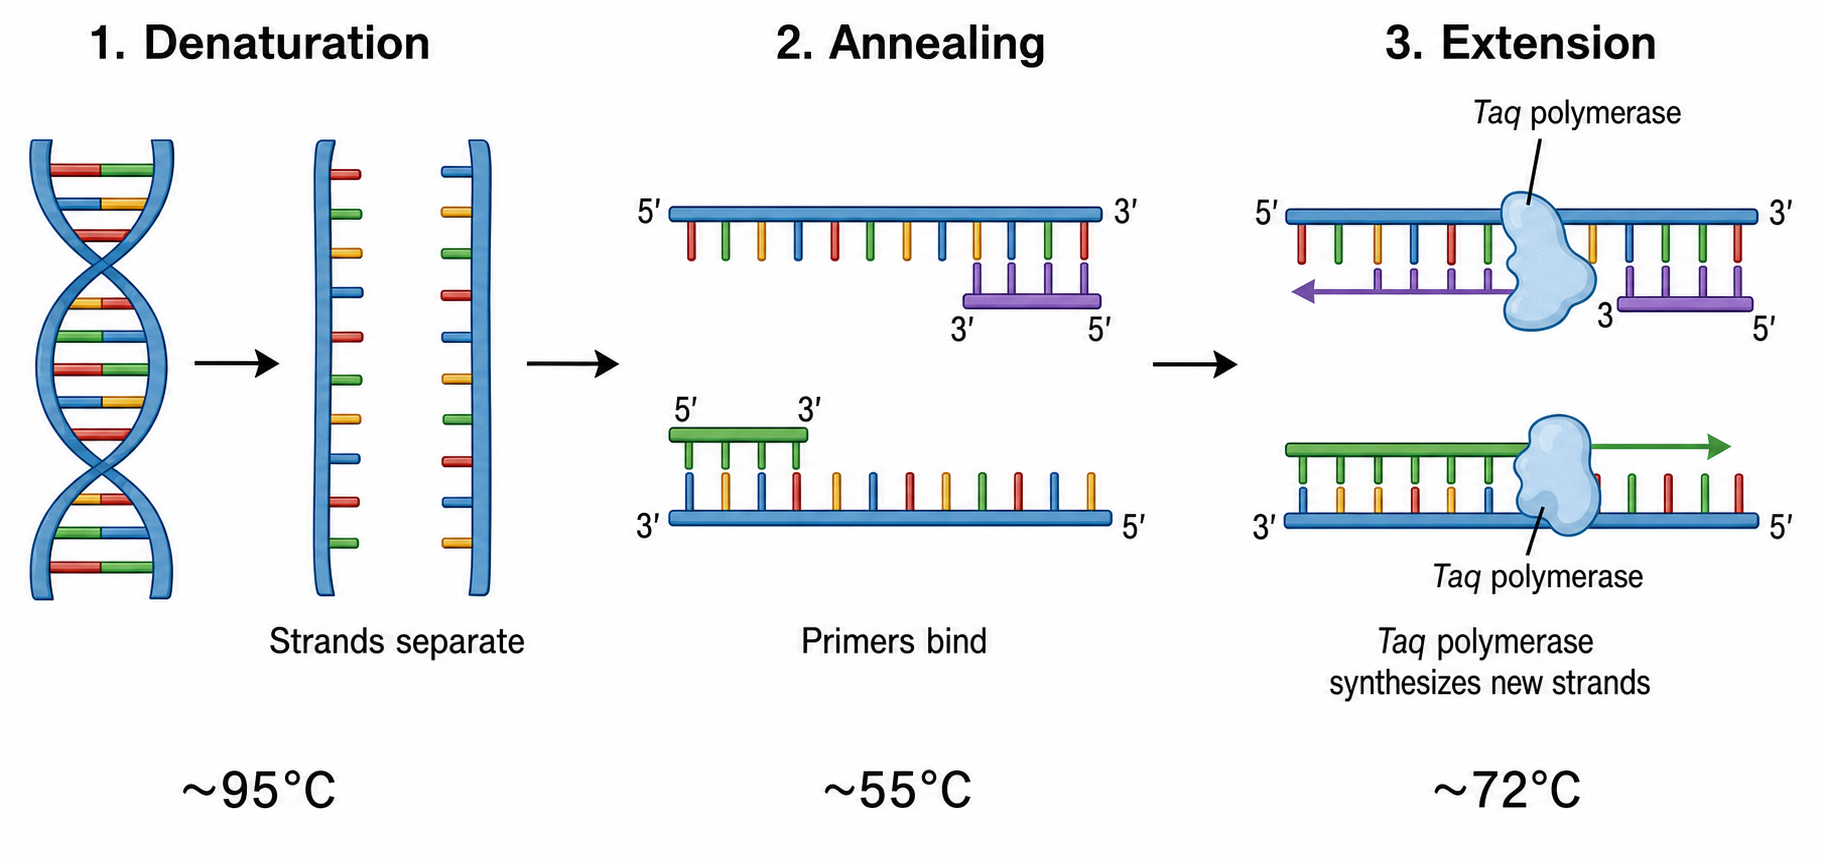
Describe any PCR concept — the three-step cycle, a qPCR amplification curve, RT-PCR, primer binding, or a full workflow — and SciDraw AI draws a clean, labeled diagram with DNA strands, primers, and temperatures you can edit and export.
PCR diagram examples
Start from a proven prompt, then adapt it to your topic.
What this tool does
The PCR Diagram Generator turns a plain-language description into a clean, labeled PCR figure. You describe the step or workflow you want — the thermal cycle, a qPCR curve, RT-PCR, primer binding, or the whole protocol — and SciDraw AI lays it out with DNA strands, primers, polymerase, and temperatures. It is built for researchers, students, and educators who need accurate, publication-ready molecular-biology figures fast.
Why use an AI PCR diagram generator?
- Drawing strands, primers, and temperature steps by hand is fiddly and time-consuming.
- Temperatures, primer directions, and labels stay crisp and correct.
- A clear step-by-step layout makes the thermal cycle easy to teach and follow.
- Every diagram is editable and exportable to SVG or PowerPoint for papers and slides.
- One prompt covers many topics — the cycle, qPCR, RT-PCR, primers, and full workflows.
How to make a PCR diagram
1) Describe what you need — the step, curve, or workflow, plus any temperatures or labels. 2) Click Generate to get a labeled draft. 3) Refine by asking to add a step, adjust temperatures, recolor, or relabel. 4) Export to SVG or PPTX, or download a high-resolution image for your manuscript, lecture, or poster.
What you can illustrate
- The three-step thermal cycle with temperatures
- DNA strands, primers, dNTPs, and Taq polymerase
- qPCR amplification curves with threshold and Ct
- RT-PCR (mRNA → cDNA → amplification)
- Primer binding, directions, and amplicon span
- Full workflows from setup to gel verification
PCR Diagram Generator — FAQ
What PCR diagrams can I create?
The PCR cycle (denaturation, annealing, extension), qPCR amplification curves, RT-PCR workflows, primer binding schematics, full protocols, and PCR-vs-qPCR comparisons. Just describe what you need.
Can I include the temperatures and labels?
Yes. You can specify temperatures (e.g. 95°C, 55°C, 72°C) and the labels you want, and they render as crisp, readable text.
Can I edit the diagram after generating it?
Absolutely. Refine any diagram by asking to add a step, adjust temperatures, recolor, simplify, or rename labels — without redrawing the whole figure.
Can I export to PowerPoint or SVG?
Yes. Diagrams export to editable SVG or PowerPoint (PPTX), or download as high-resolution images — ready for manuscripts, slides, and posters.
Is it suitable for publication?
It is designed for publication-ready output: a clean vector style, correct step order, and accurate labeling that fits journal and textbook standards.
Do I need design skills?
No. If you can describe the PCR concept in a sentence, you can generate a professional figure. The AI handles layout, styling, and labeling.
Explore More Tools
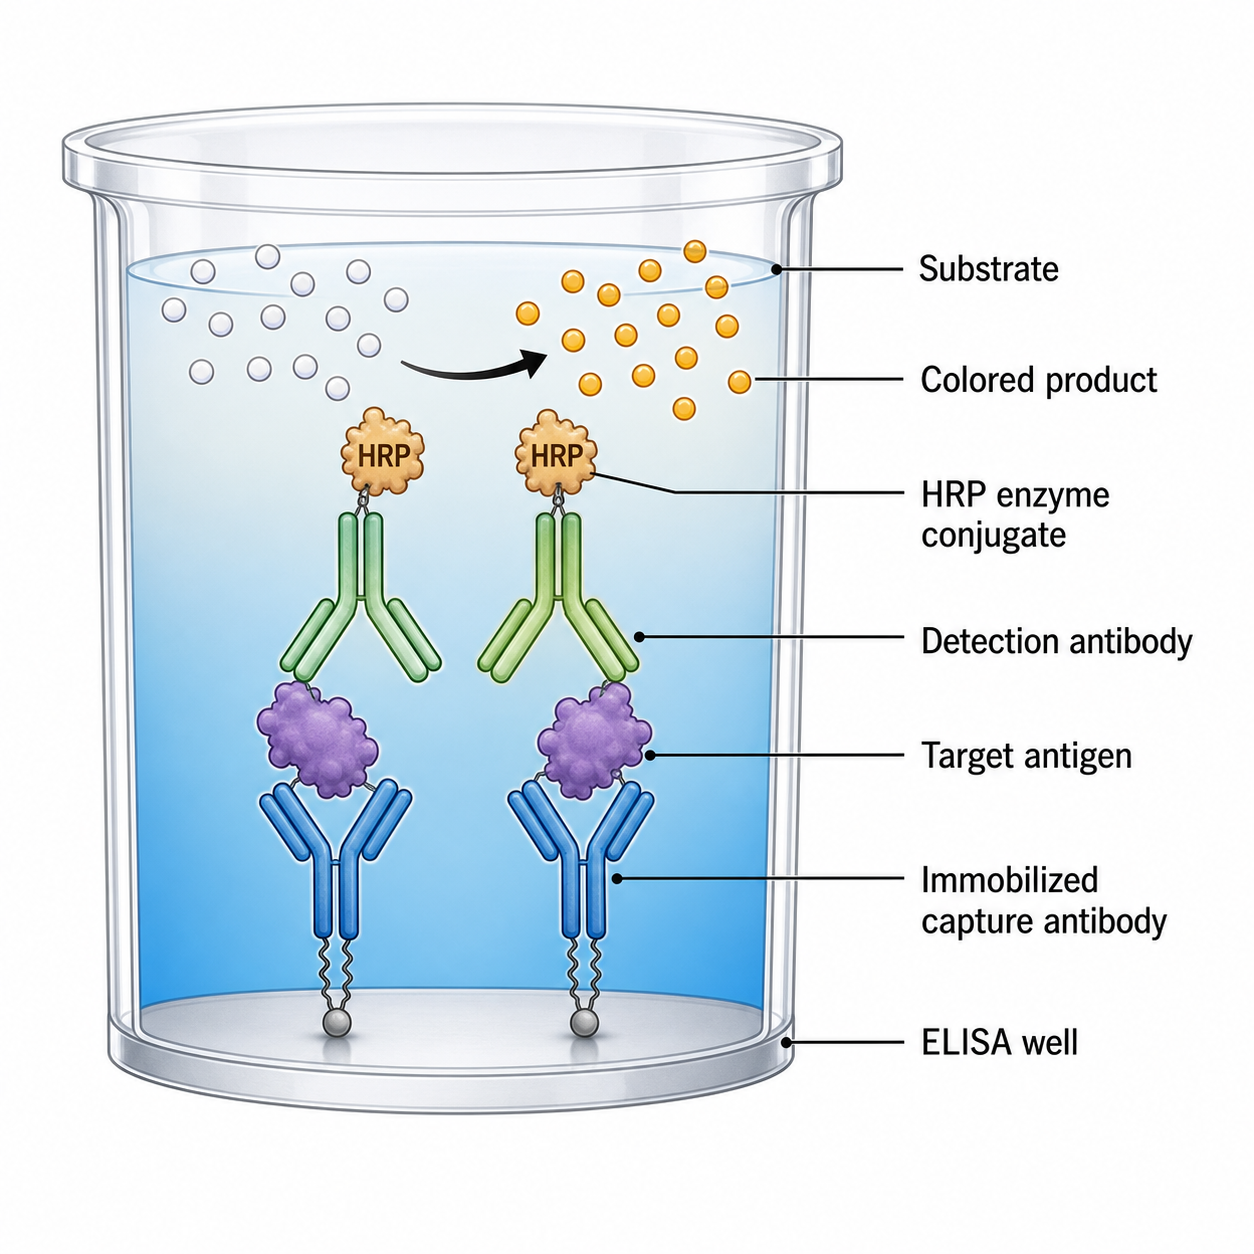
ELISA Diagram Generator
Draw labeled ELISA diagrams — sandwich, indirect and competitive assays, workflow, plate layouts, and standard curves.
Try it free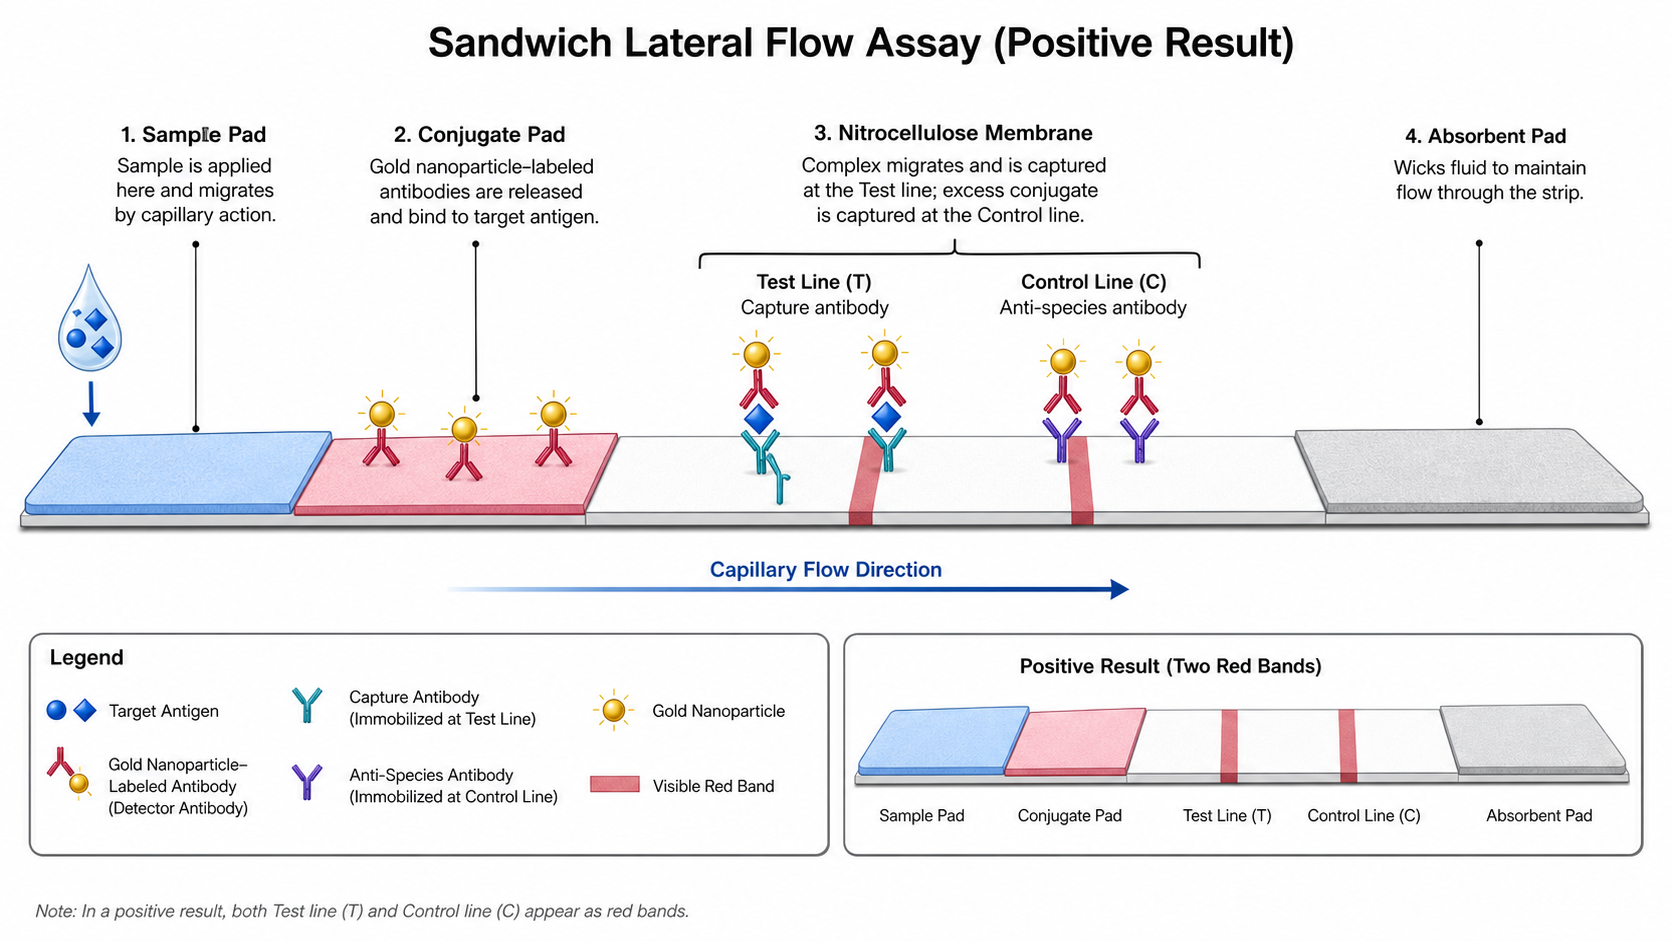
Lateral Flow Assay Diagram Generator
Create lateral flow assay diagram visuals for sample pads, conjugate pads, nitrocellulose membranes, test lines, control lines, and capillary flow.
Try it free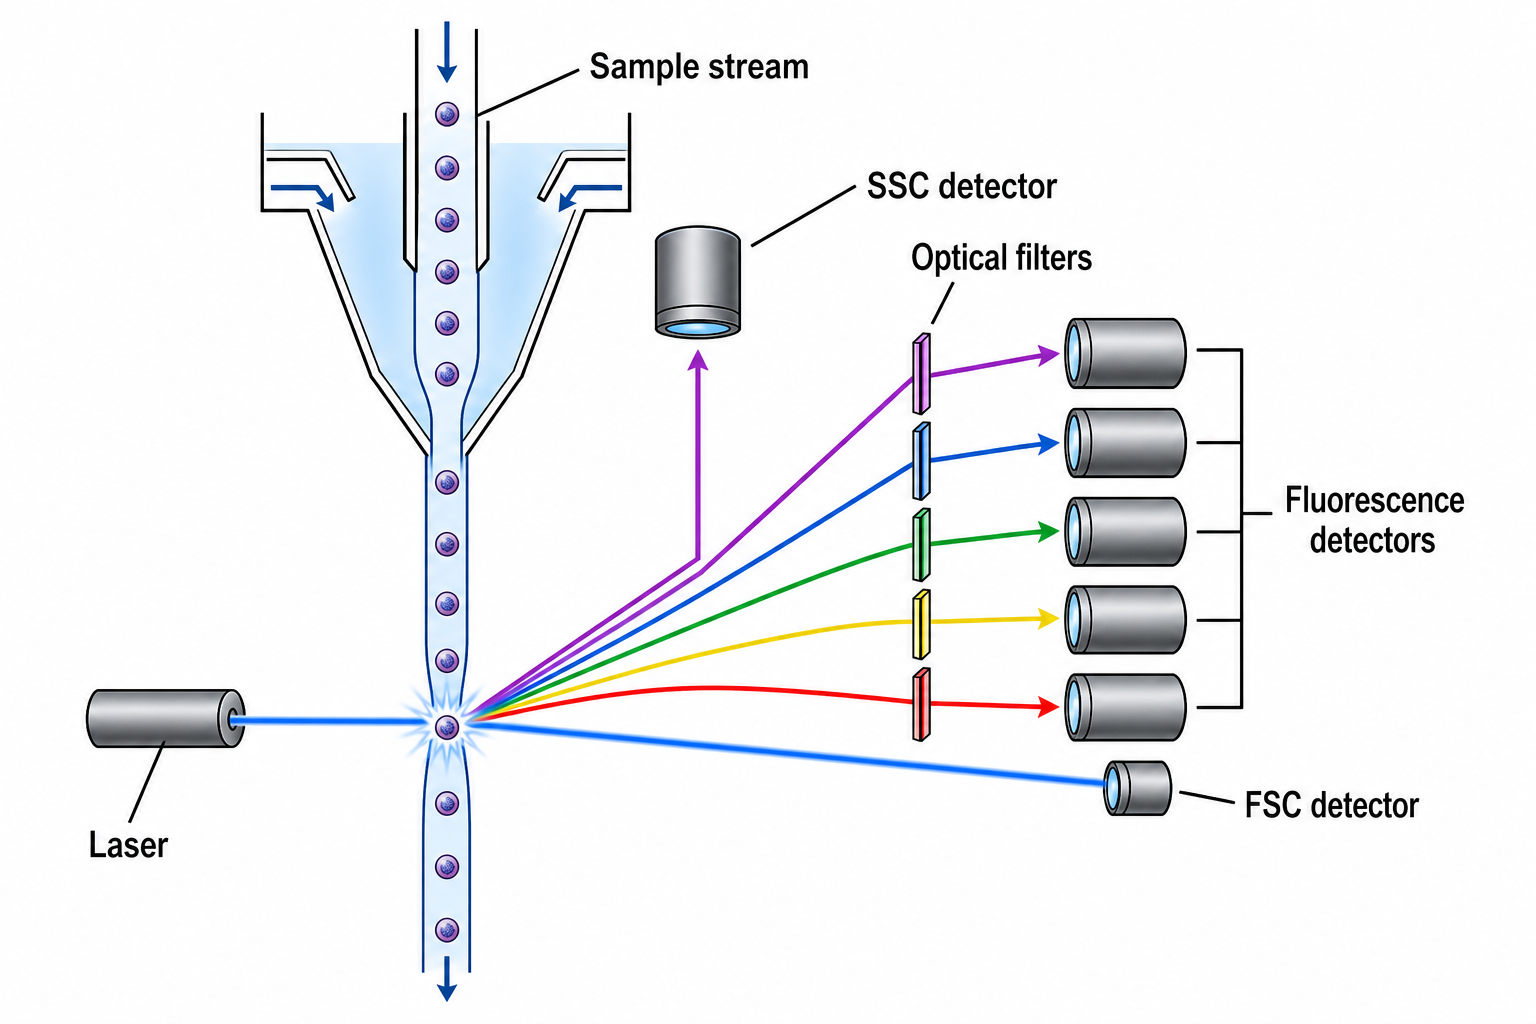
Flow Cytometry Diagram Generator
Draw labeled flow cytometry figures — cytometer schematics, gating strategies, dot plots, immunophenotyping, and FACS sorting.
Try it freeDraw your PCR diagram now
Describe any PCR step or workflow and get a clean, labeled, publication-ready figure in minutes.