AI Causal Loop Diagram Generator
From signed causal links to a publication-ready CLD
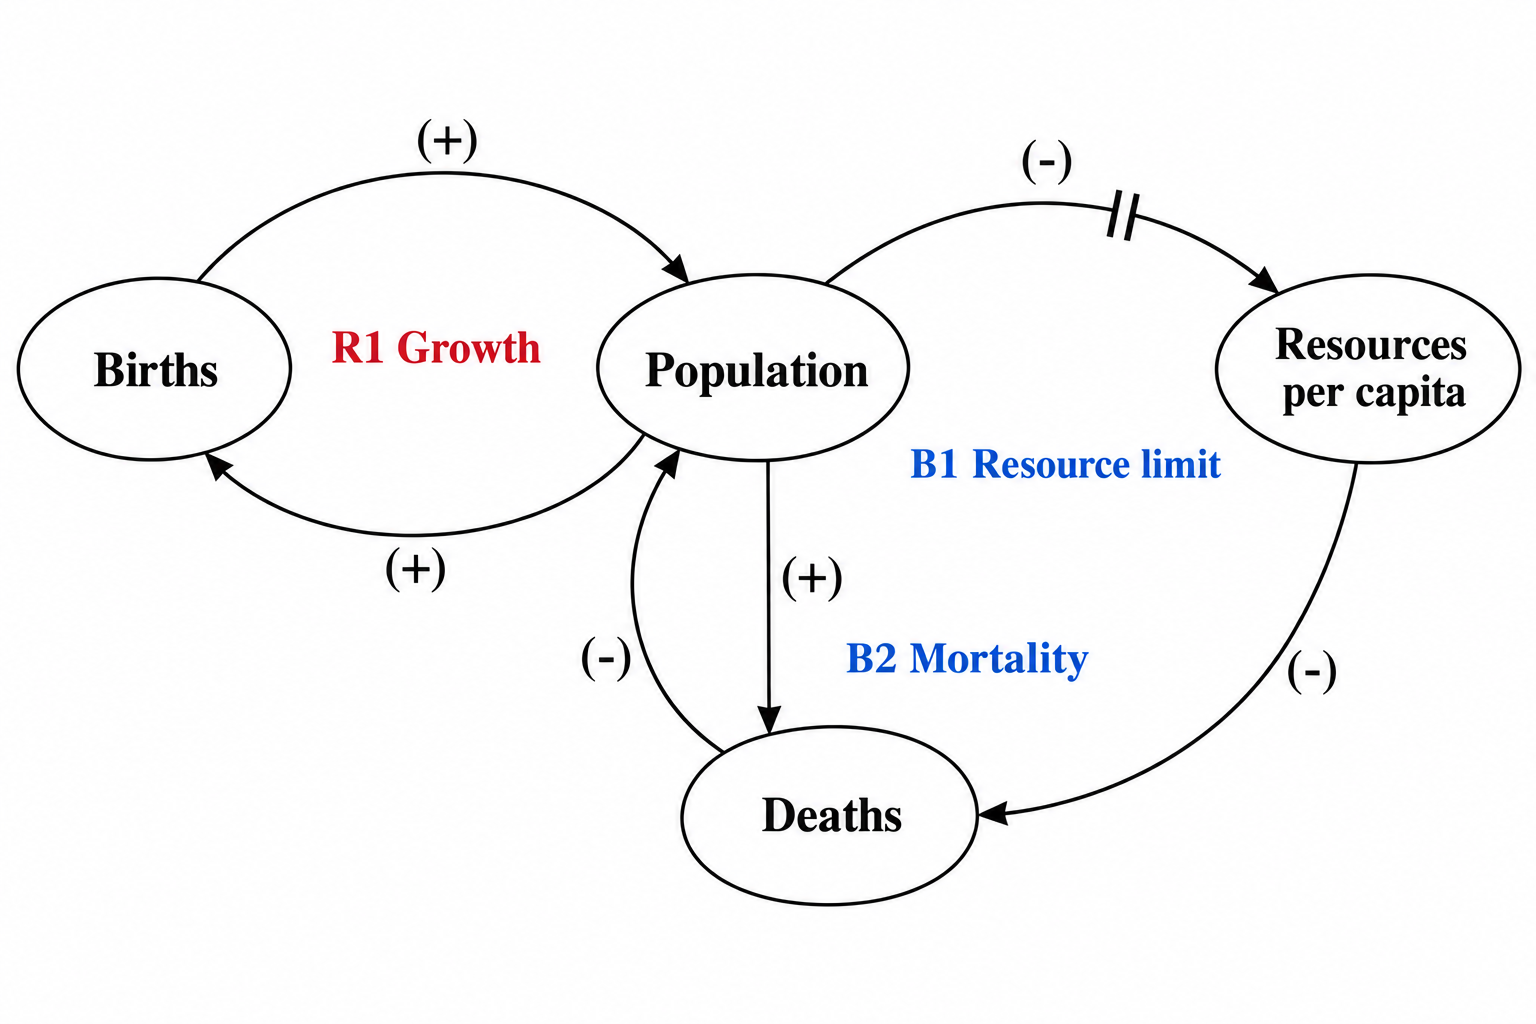
List your variables, mark each link + or −, and name the reinforcing and balancing loops. SciDraw AI draws the system dynamics diagram with curved arrows, polarity labels, R/B loop identifiers and delay marks, exactly as you specified.
Causal Loop Diagram Examples
Browse CLDs from ecology, policy, management and health systems, or generate your own above.
What does this causal loop diagram generator do?
This AI causal loop diagram generator turns a written list of variables and signed causal links into a clean CLD image for system dynamics and systems thinking work. You name the variables, give each link a polarity (+ when the two variables move in the same direction, − when they move in opposite directions), label each feedback loop as reinforcing (R) or balancing (B), and say where a delay sits. SciDraw AI then arranges the variables so that every loop closes, draws each link as a curved arrow with its polarity label, places the R or B identifier and loop name inside each loop, and marks delays with a double bar across the arrow. The result is a feedback loop diagram that fits a thesis chapter, a policy report, a consulting deck or a lecture slide. The generator draws only what you describe: it does not simulate the system, estimate parameters, infer causality from data, or add links of its own.
Why researchers draw causal loop diagrams
- Make the feedback structure of a system explicit before building a stock-and-flow model
- Show reviewers and committees why a policy produced side effects or resistance
- Give a management team a shared picture of a vicious or virtuous circle
- Communicate a dynamic hypothesis in a thesis, report or grant without equations
- Replace a paragraph of 'A affects B, which affects C' with one readable figure
How to write a causal loop diagram description
Start by defining each variable as a noun that can go up or down, such as 'Population' or 'Schedule pressure', not an action or a judgement. Write each causal link as A → B and assign a polarity: + if B moves in the same direction as A, − if it moves the opposite way. Then trace each closed path back to its starting variable and count the negative links: an even number, including zero, makes a reinforcing loop R, and an odd number makes a balancing loop B. Name each loop after the story it tells, such as 'Induced demand' or 'Burnout spiral'. Mark a delay on any link where the effect takes noticeably longer than the rest of the system. Finally, check that every loop closes and that no arrow is a correlation rather than a cause. Paste the list into the generator and SciDraw AI draws it.
Common elements of a causal loop diagram
- Variables written as short text, without boxes
- Curved causal arrows running from cause to effect
- Polarity labels: + for same direction, − for opposite direction
- Loop identifiers R (reinforcing) and B (balancing) with a loop name
- Delay marks, drawn as a double bar across a slow link
- External drivers or policy levers shown as arrows entering the system
Frequently Asked Questions
What is the difference between a causal loop diagram and a stock-and-flow diagram?
A causal loop diagram shows the feedback structure of a system qualitatively: variables, signed causal links, and the reinforcing and balancing loops they form. A stock-and-flow diagram adds the accumulation structure, separating stocks (levels) from flows (rates) so the model can be simulated. Most system dynamics projects start with a CLD to agree on the dynamic hypothesis, then translate it into stock-and-flow form. This tool draws the CLD.
How do I decide whether a loop is reinforcing or balancing?
Trace the loop once and count its negative links. An even number of negative links, including zero, means a change travels around the loop and returns in the same direction, so the loop is reinforcing (R). An odd number means it returns reversed, so the loop is balancing (B). You decide the label: SciDraw AI draws the R or B you specify and does not recalculate it.
Can I use the diagram in a thesis, dissertation or policy report?
Yes. The generator produces a clean, publication-style image with short variable text, curved arrows, polarity labels, loop identifiers and delay marks, which is the convention used in system dynamics textbooks and journals. Check the diagram against your own causal argument before submitting, cite the evidence for each link in your text, and describe the figure in your own words as you would any other.
What does the tool not do?
It draws the structure you describe and nothing more. It does not run a simulation, estimate parameters or loop dominance, infer causal links from a dataset, or add variables and links that you did not list. If a link is missing from the picture, add it to your description and regenerate. The causal argument, and responsibility for it, stays with you.
How do I edit or regenerate the diagram?
Edit the text description, for example by renaming a variable, changing a polarity, adding a loop name or moving a delay, and generate again. Each run produces a fresh image from the full description, so keep the complete list of variables and links in the box. For layout or label changes on an existing result, open it in the editor and adjust from there.
How do I export the causal loop diagram?
Download the finished diagram as a PNG image, or open it in the editor to keep adjusting labels, colors and layout before downloading. The image can be placed in Word, LaTeX, PowerPoint or a policy report like any figure. The tool does not export Vensim, Stella or other model files; it produces the diagram image only.
Explore More Tools
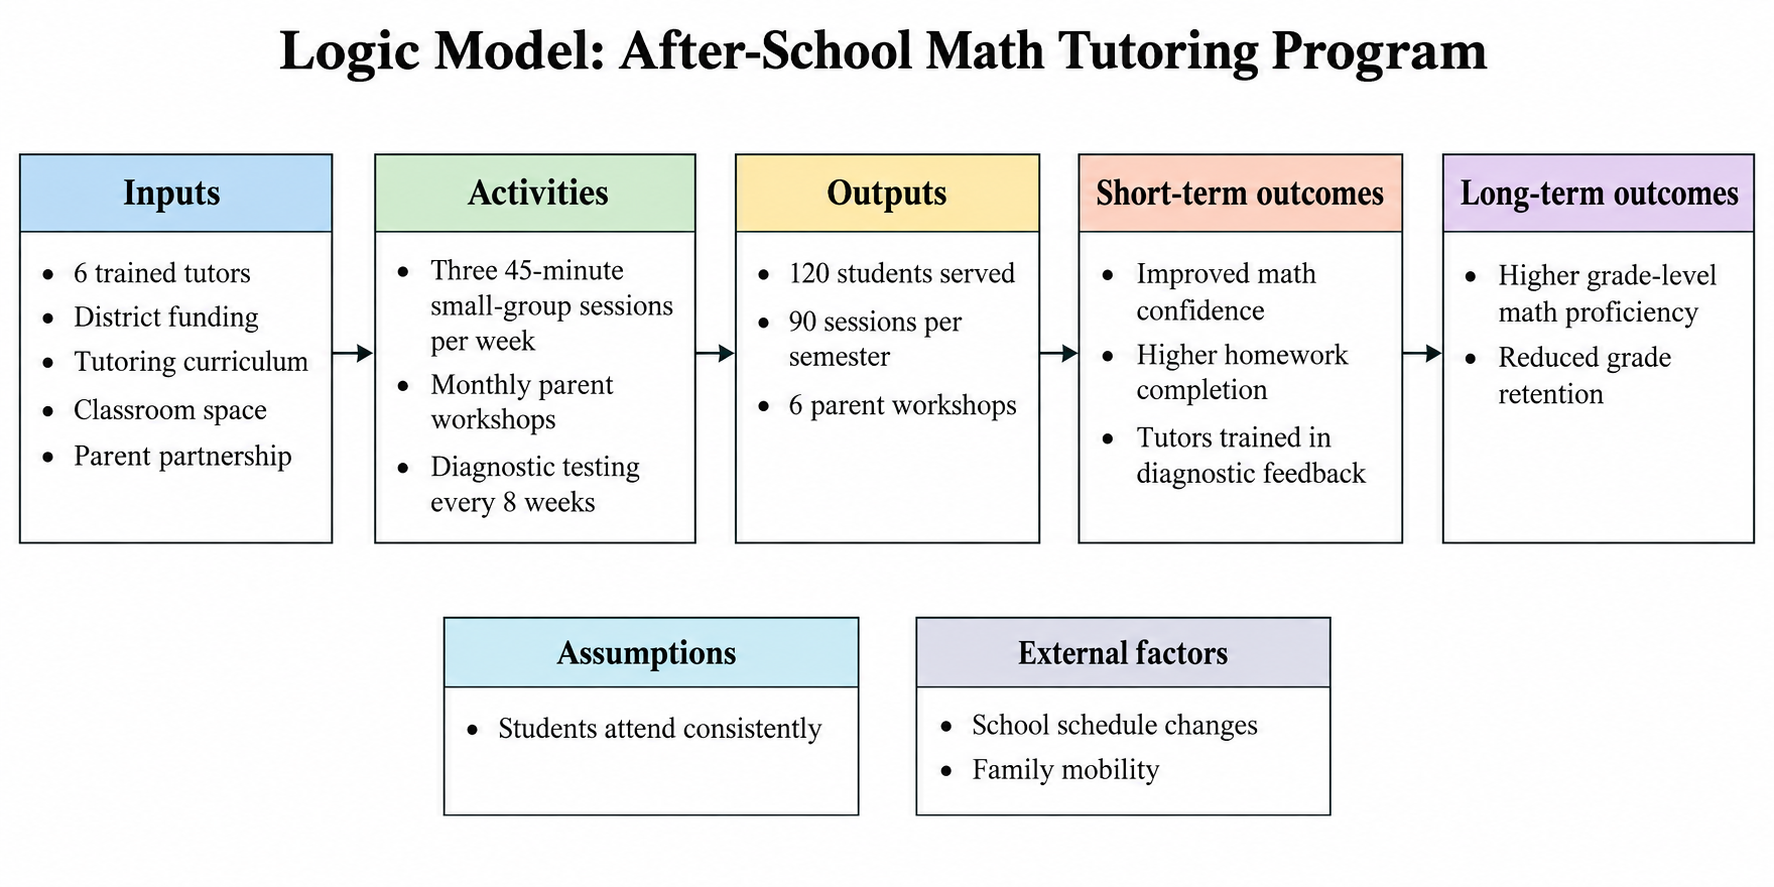
Logic Model Generator
Draw a program logic model from inputs, activities, outputs and outcomes
Try it free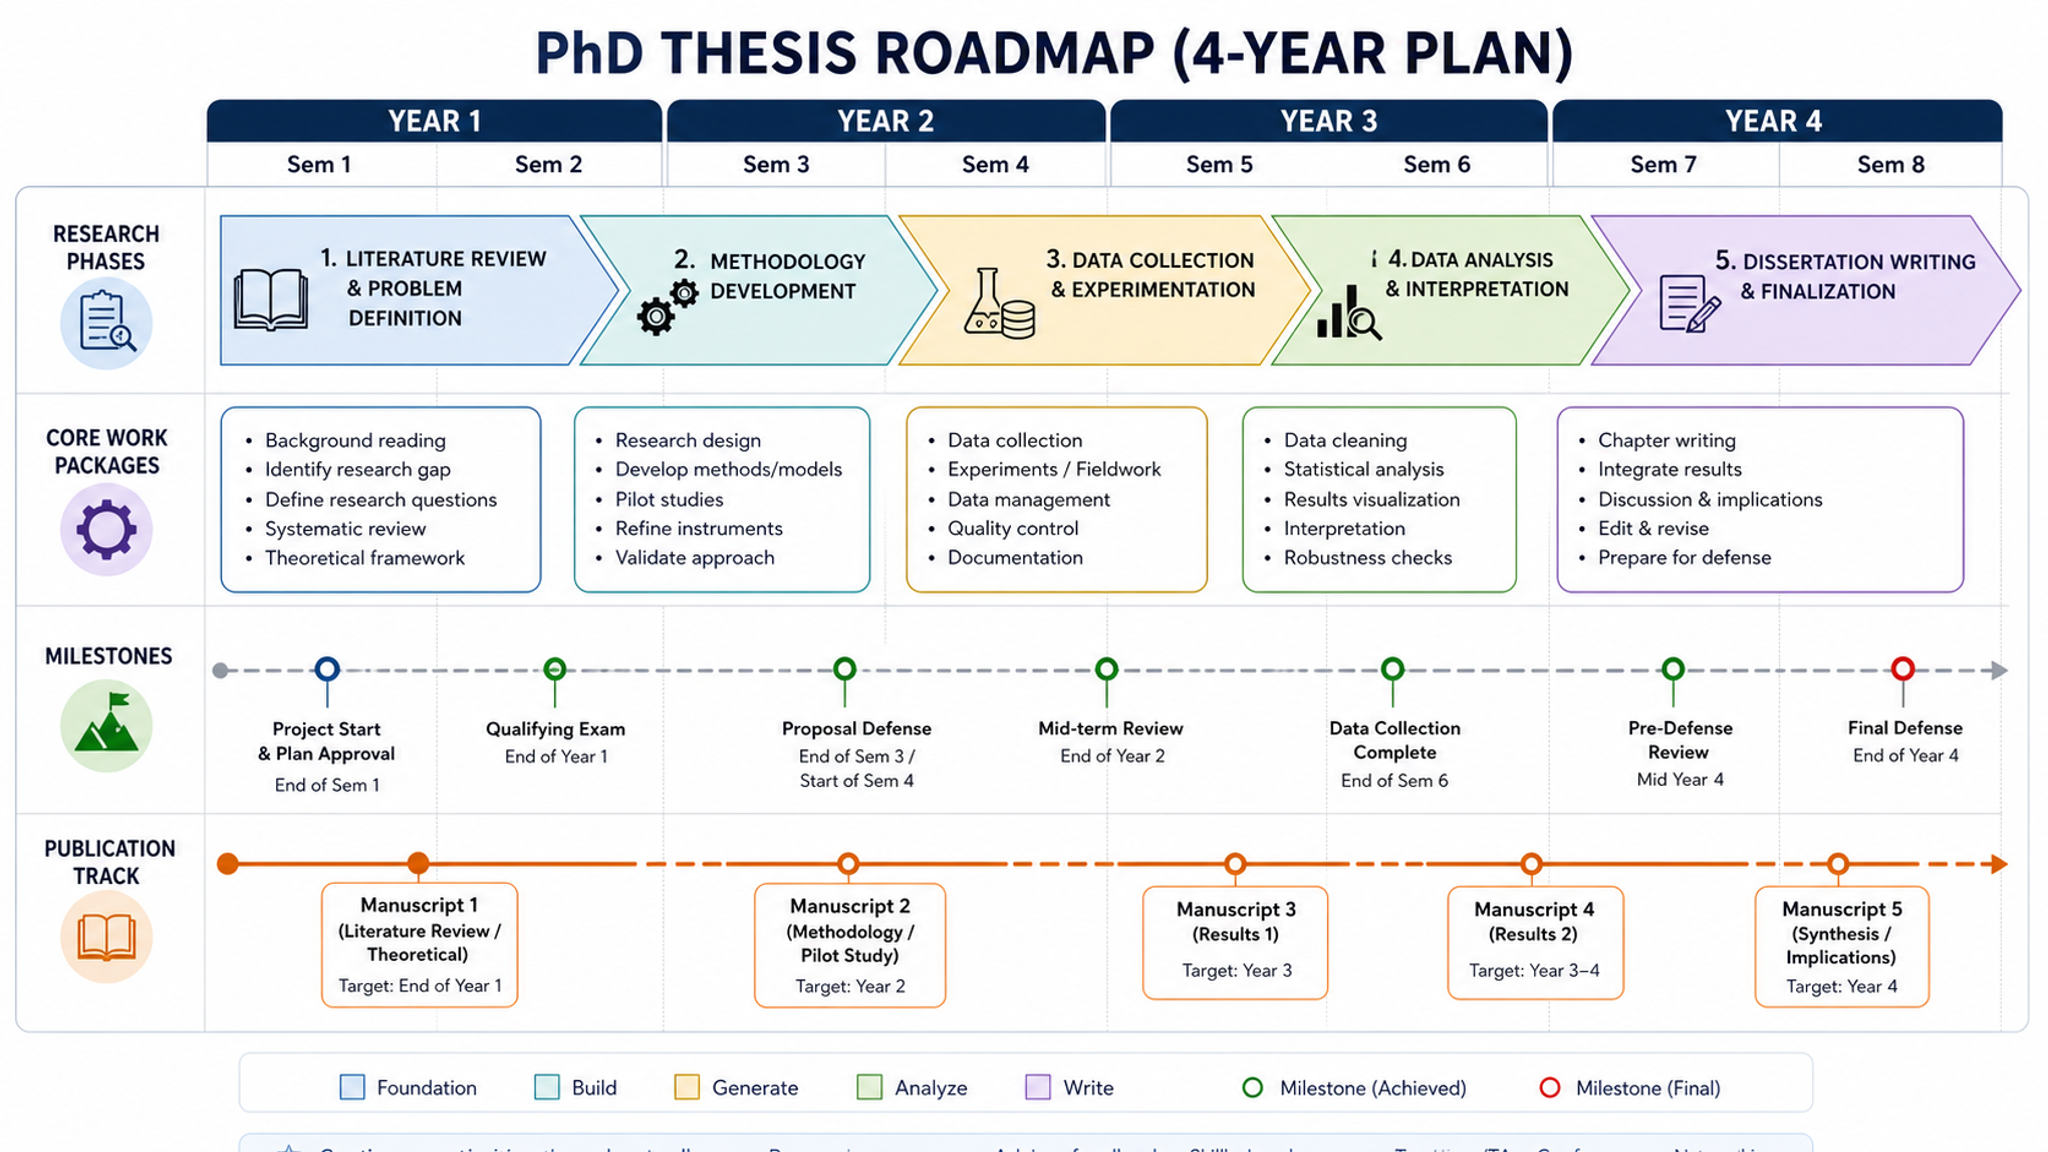
Research Roadmap Maker
Create technical route diagrams for grant proposals
Try it free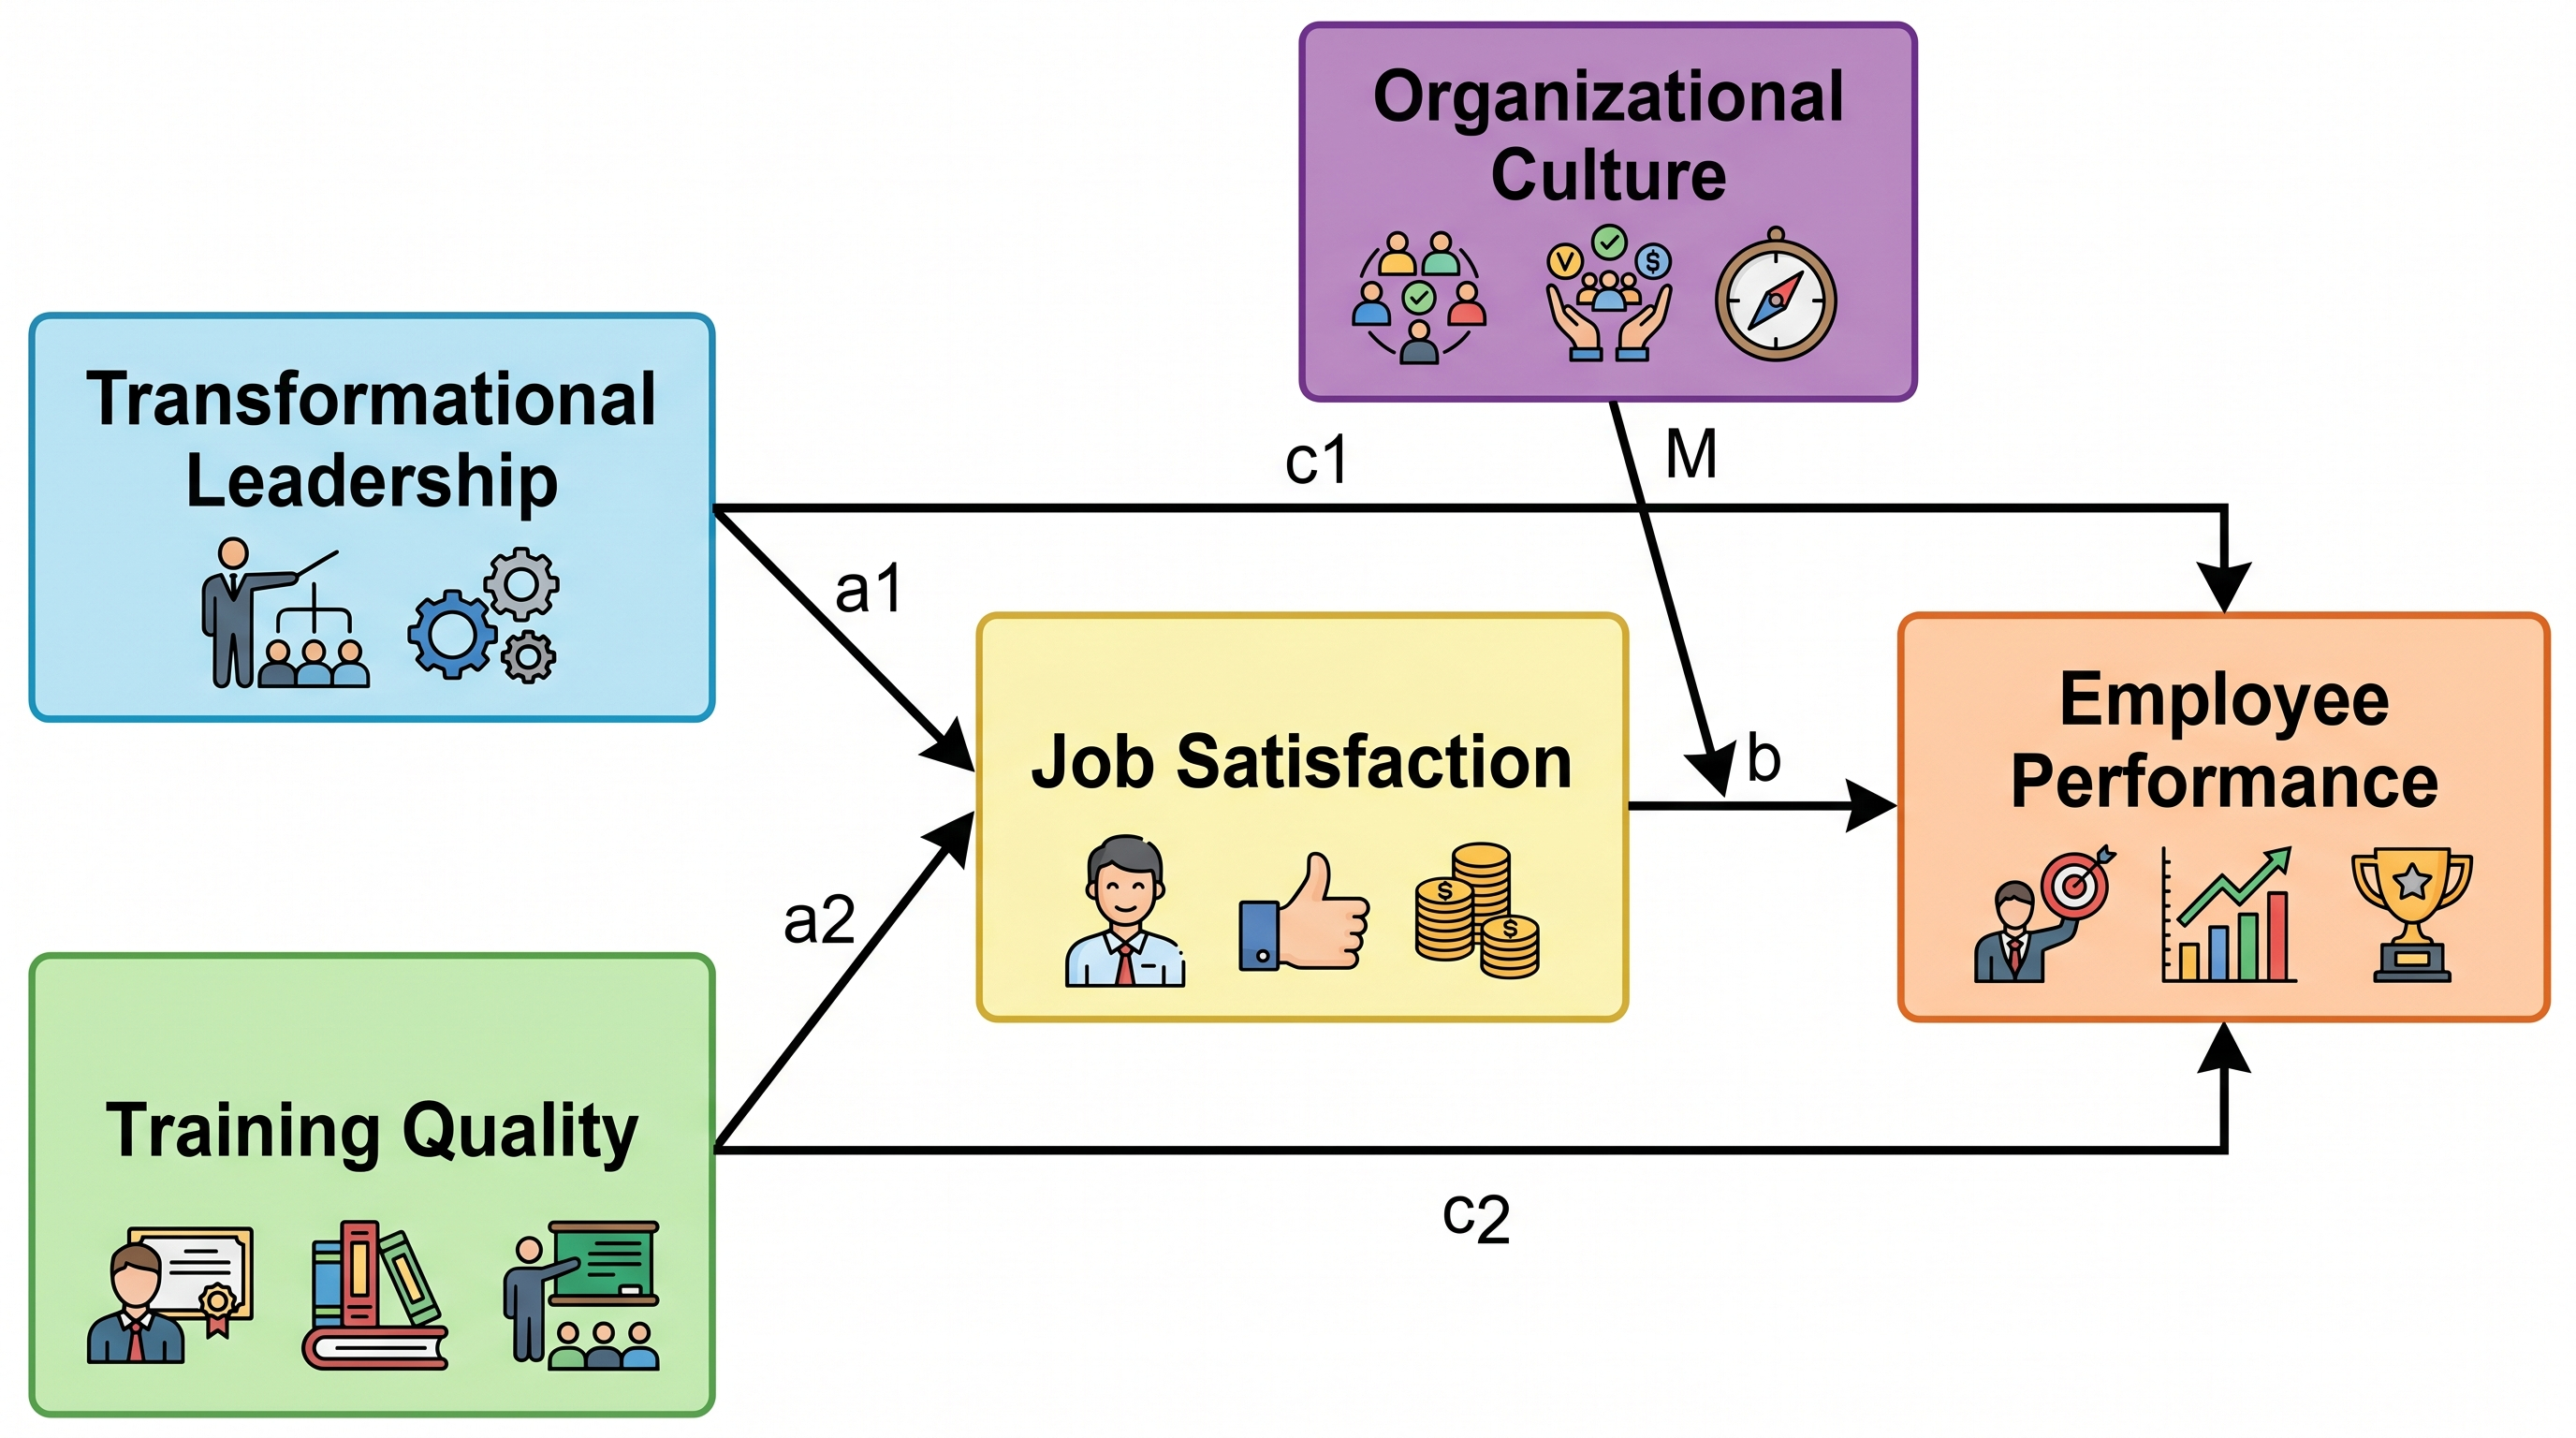
Conceptual Framework Maker
Generate labeled research framework diagrams with variables and relationships
Try it freeDraw your causal loop diagram now
Describe the variables, links and loops of your system and let SciDraw AI turn them into a clean CLD for your thesis, report or presentation. Free to try.