Biogeochemical Cycle Diagram Generator
Draw any nutrient cycle as a clean, labeled figure
Describe the cycle, its reservoirs, and the processes that move the element between them, and AI draws a clear biogeochemical cycle diagram — carbon, nitrogen, water, phosphorus, oxygen, or sulfur — with directional arrows and readable labels. Built for biology and environmental science classrooms, with labeled or blank worksheet versions ready for papers, slides, and handouts.
Biogeochemical cycle examples
Click any example to load its prompt, or use it as a starting point for your own cycle diagram.
What is a biogeochemical cycle?
A biogeochemical cycle is the pathway by which a chemical element — such as carbon, nitrogen, oxygen, phosphorus, or sulfur — moves through the living (biotic) and non-living (abiotic) parts of an ecosystem, cycling between the atmosphere, biosphere, hydrosphere, and lithosphere. The major cycles are the carbon cycle, the nitrogen cycle, the water (hydrologic) cycle, the phosphorus cycle, the oxygen cycle, and the sulfur cycle. This generator turns a description of any of these into a clean, labeled diagram with the correct reservoirs, fluxes, and directional arrows. You describe the cycle and the processes that connect its stores, and the AI draws the figure — no drawing tools or manual alignment needed — so the flow of matter is easy to follow at a glance.
Why use a cycle diagram generator
- Biogeochemical cycle diagrams are the standard way to show how an element moves through an ecosystem.
- Drawing reservoirs, fluxes, and curved directional arrows by hand is slow and easy to get wrong.
- Clear labels on every store and process make the carbon, nitrogen, or water cycle obvious to any student.
- Teachers need both labeled diagrams and blank worksheet versions for biology and ESS lessons quickly.
- Regenerating from a description is faster than redrawing when you switch cycles or add a process.
How to draw a carbon or nitrogen cycle
Pick the cycle you need — carbon, nitrogen, water, phosphorus, oxygen, or sulfur — and name its main reservoirs, such as the atmosphere, oceans, soil, rock, plants, and animals. List the processes that move the element between them, like photosynthesis, respiration, fixation, or evaporation, and note the direction of each arrow. Say whether you want a fully labeled diagram or a blank worksheet version. Generate the figure, then check that every reservoir and flux is named correctly and refine the prompt until it matches your syllabus.
Parts of a cycle diagram
- Reservoirs (stores) — where the element is held, such as the atmosphere, oceans, soil, rock, or living organisms.
- Fluxes (processes) — the transfers that move the element, like photosynthesis, respiration, fixation, or weathering.
- Directional arrows — show which way matter flows between each reservoir.
- Atmosphere–biosphere exchange — gas-phase steps such as CO2 uptake or nitrogen fixation.
- Decomposition & return — decomposers releasing nutrients back into soil and water.
- Labels & legend — clear names on every store and process so the cycle reads at a glance.
Biogeochemical Cycle Diagram FAQ
What is a biogeochemical cycle?
A biogeochemical cycle is the movement of a chemical element through the living and non-living parts of an ecosystem — between the atmosphere, biosphere, hydrosphere, and lithosphere. The main ones are the carbon cycle, nitrogen cycle, water (hydrologic) cycle, phosphorus cycle, oxygen cycle, and sulfur cycle. Each is built from reservoirs that store the element and fluxes that move it between them.
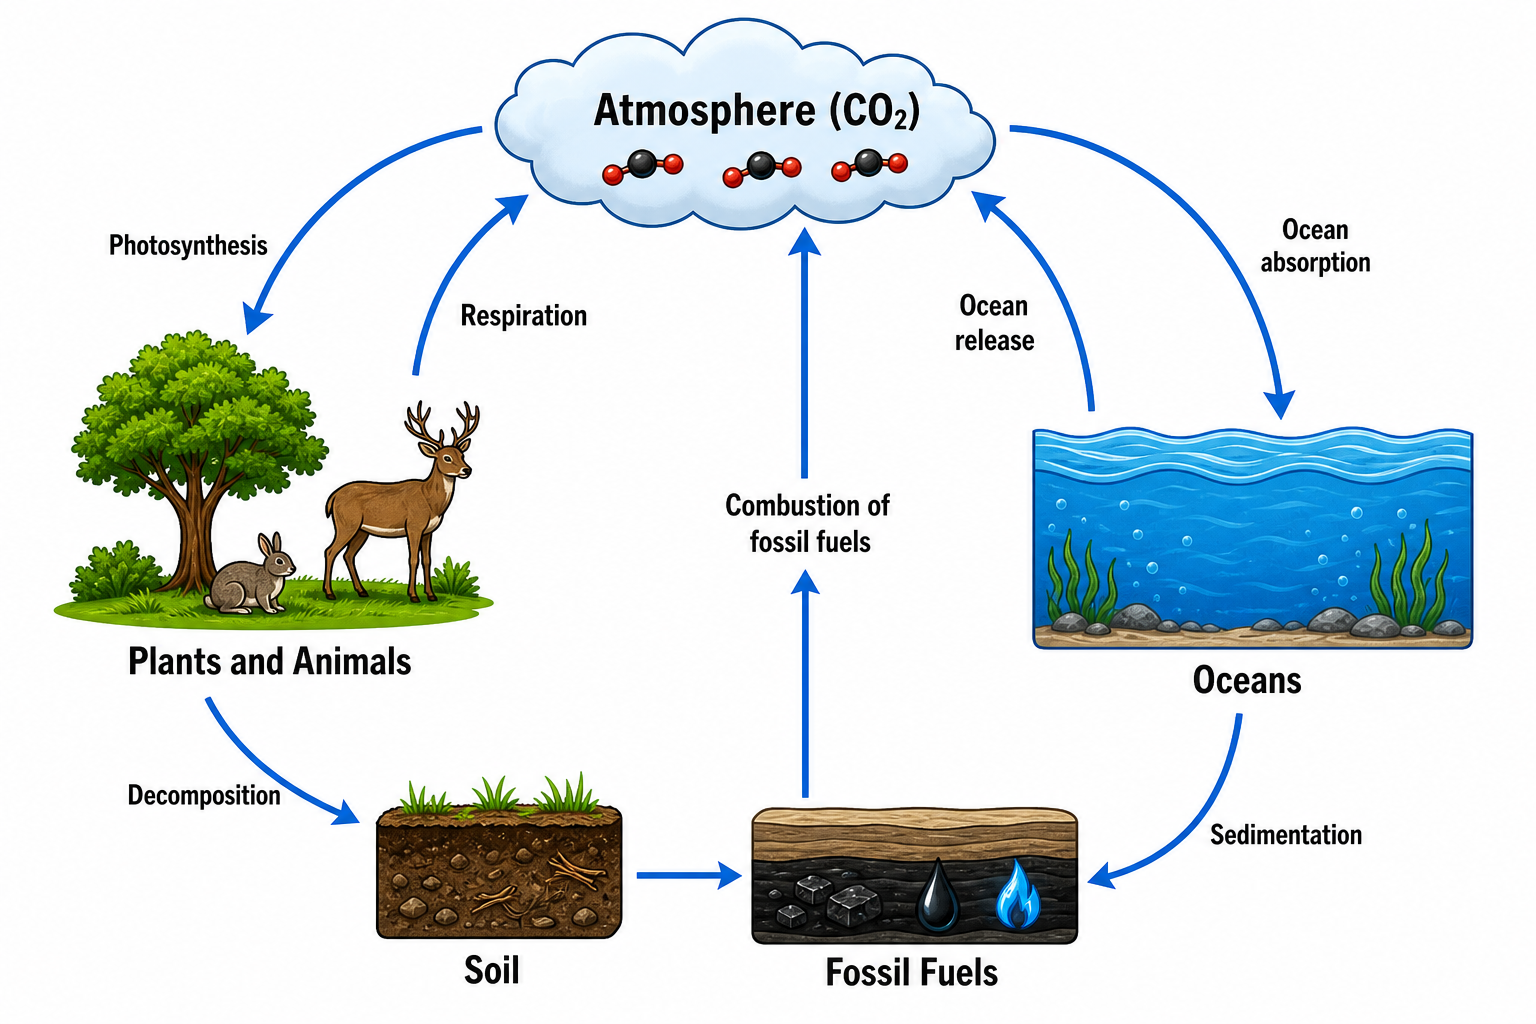
Can I make a carbon cycle diagram?
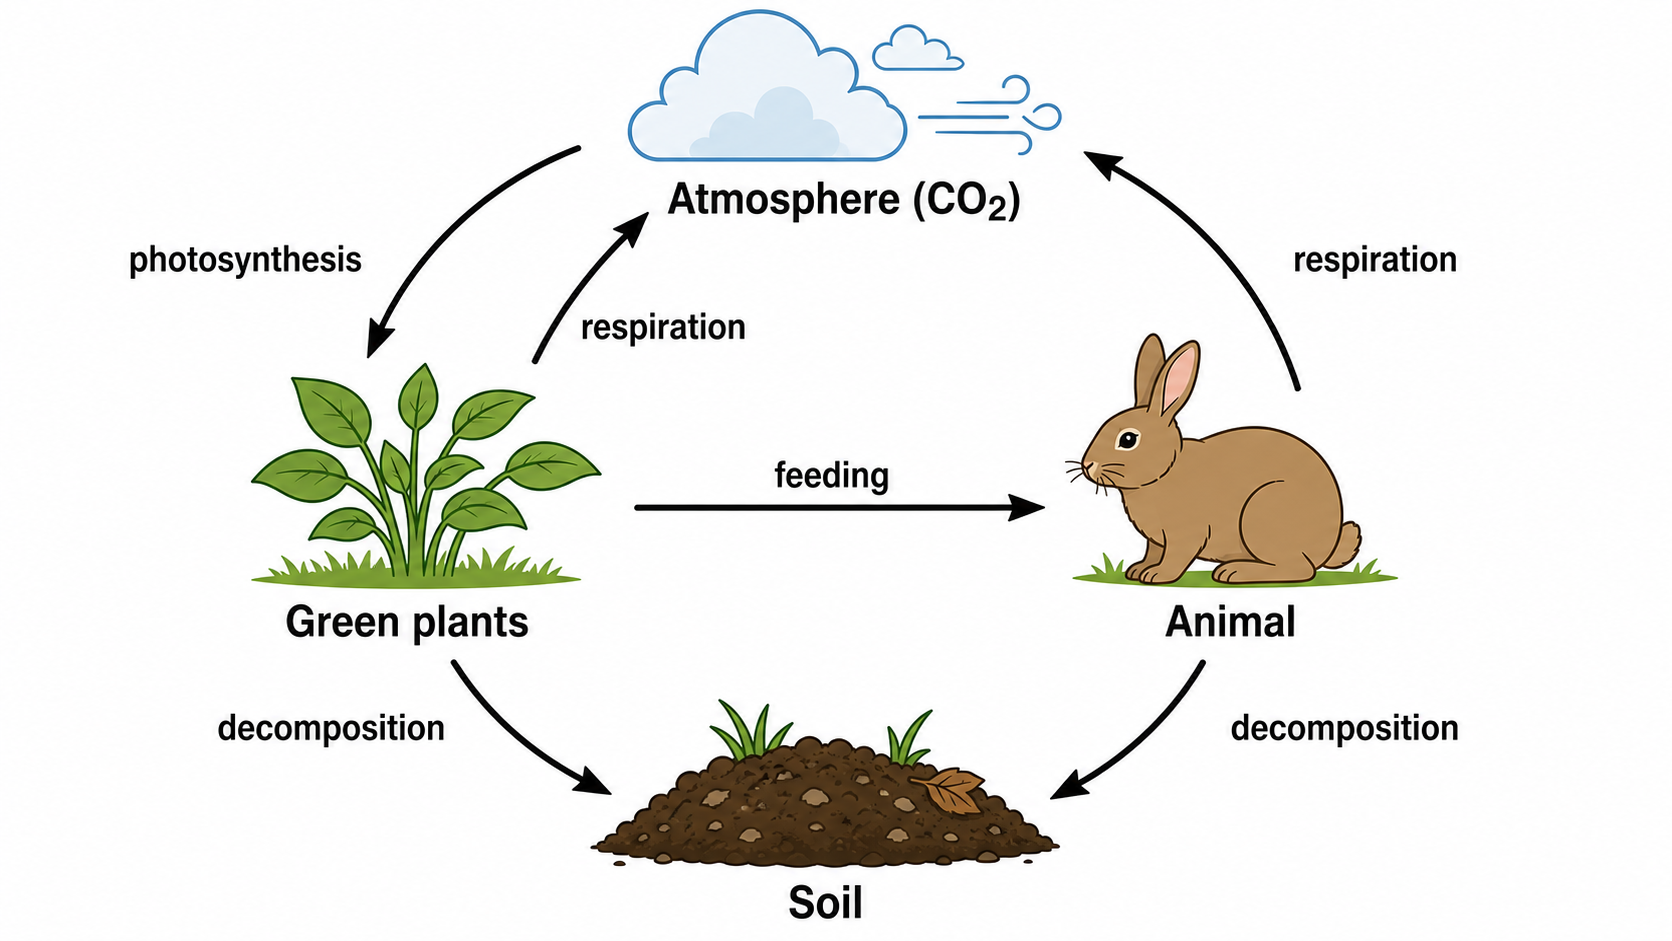
Yes. Describe the carbon reservoirs — atmosphere, oceans, plants, soil, and fossil fuels — and the fluxes between them, such as photosynthesis, respiration, decomposition, and combustion, and the generator draws a labeled carbon cycle diagram with directional arrows. The same applies to the oxygen cycle, which is tightly coupled with it.
How do I show the nitrogen cycle steps and labels?
List the nitrogen cycle steps in order — nitrogen fixation, nitrification, assimilation, ammonification, and denitrification — and name the bacteria and reservoirs involved. The generator places each step on its own labeled arrow between atmospheric N2, the soil, and living organisms, so the full nitrogen cycle is labeled clearly.
What is the difference between the water cycle and the carbon cycle?
The water cycle (hydrologic cycle) tracks water moving through evaporation, condensation, precipitation, runoff, and infiltration, driven by the sun. The carbon cycle tracks carbon moving through photosynthesis, respiration, decomposition, and combustion. Both are biogeochemical cycles and you can generate either as a separate labeled diagram, or place them side by side.
Is the biogeochemical cycle diagram generator free?
Yes, you can generate cycle diagrams for free. SciDraw AI gives new users starter credits, and each diagram uses a small number of credits, so you can draw a carbon cycle, nitrogen cycle, or water cycle diagram without any subscription to start.
Can I use it for a class worksheet?
Yes. Ask for a fully labeled cycle and a matching blank version with numbered label lines, and the generator produces a printable worksheet pair — ideal for biology and environmental science (ESS) classes that need labeled-versus-unlabeled handouts. Always check the diagram against your curriculum before handing it out.
Explore More Tools
Carbon Cycle Diagram
Draw a labeled carbon cycle with photosynthesis, respiration, decomposition, and combustion.
Try it free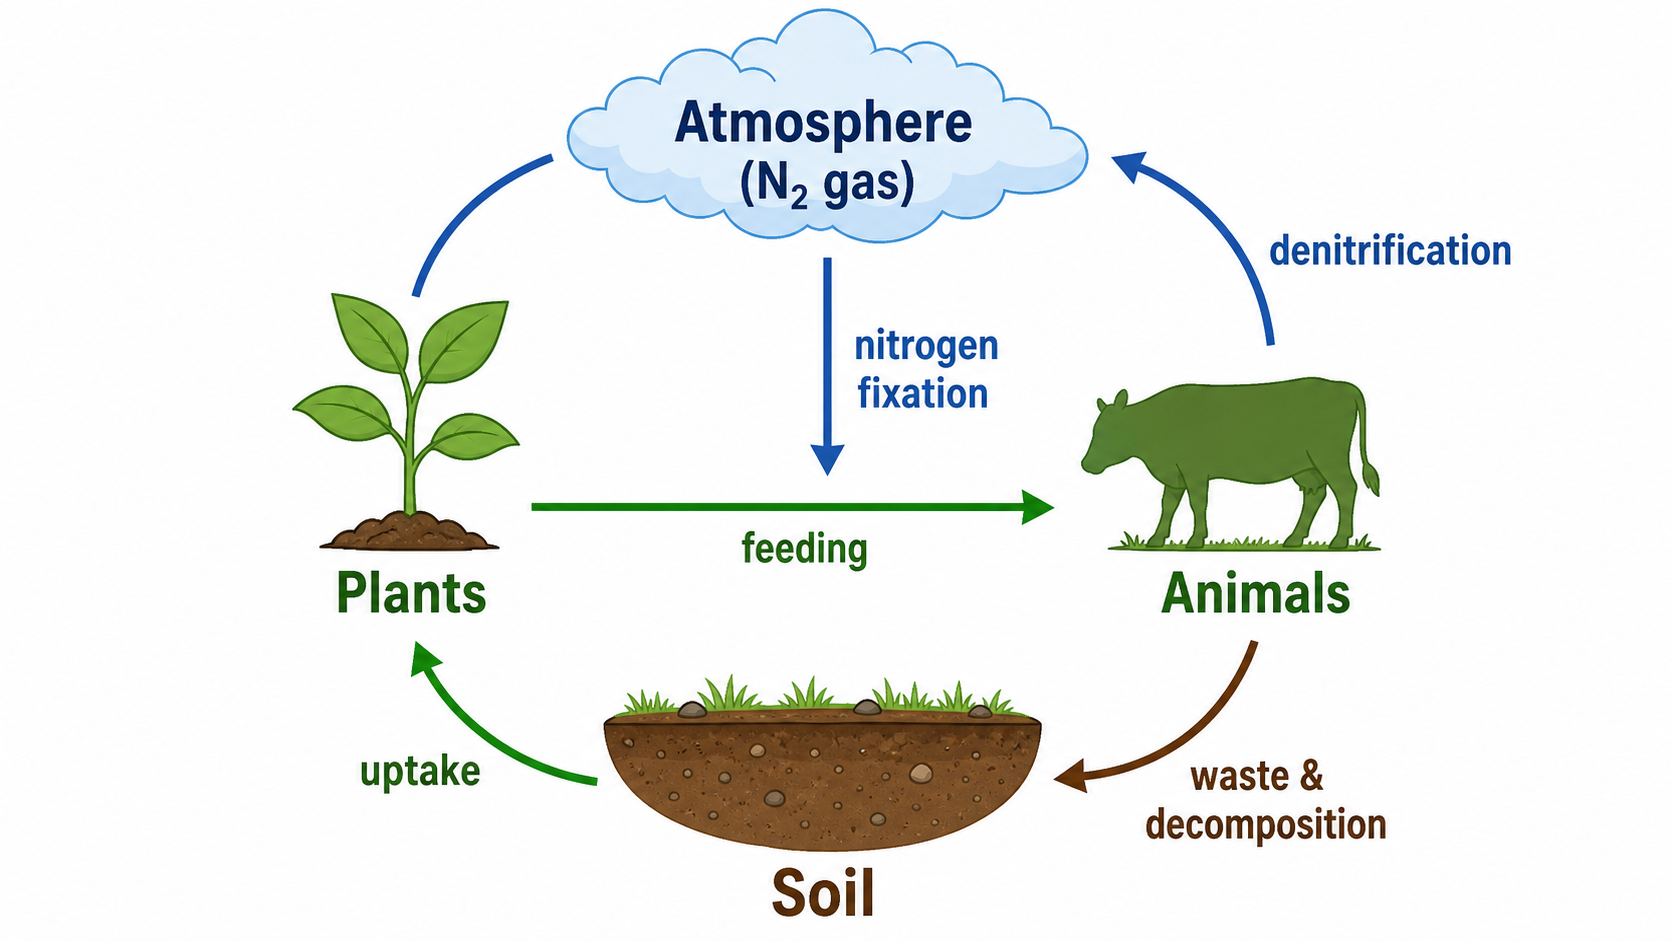
Nitrogen Cycle Diagram
Draw a labeled nitrogen cycle with fixation, nitrification, and denitrification.
Try it free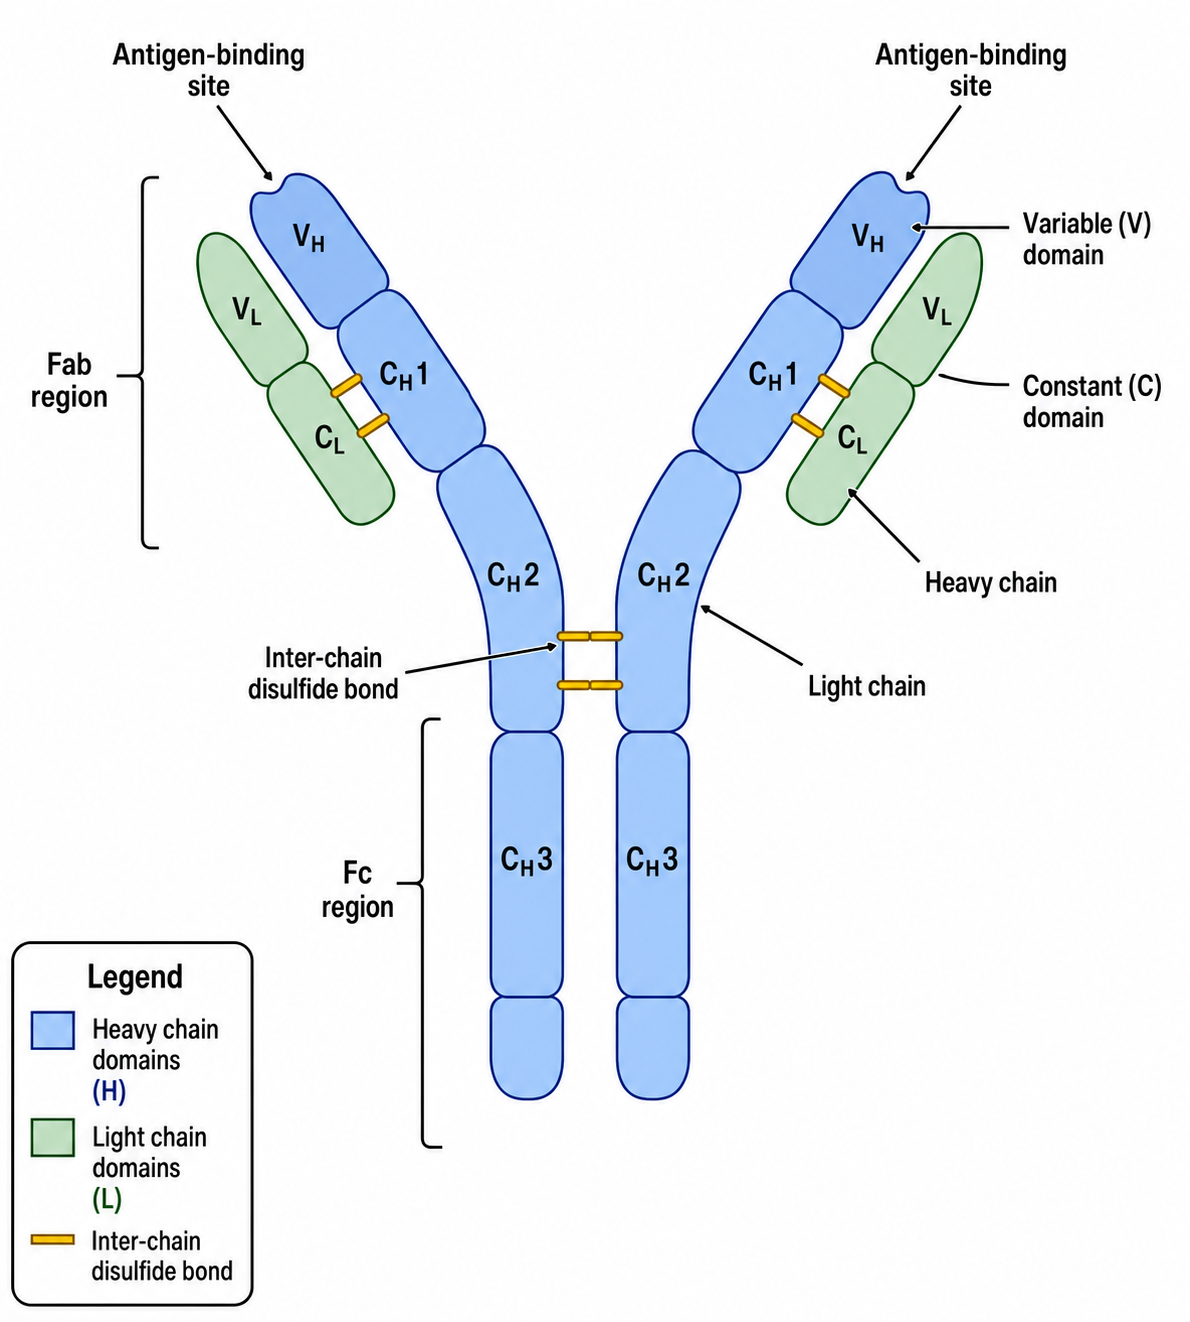
Immunology Diagram Generator
Draw labeled immunology diagrams — antibodies, antigen presentation, T-cell activation, and immune checkpoints.
Try it freeNeed other biology figures?
Generate food webs, cell diagrams, pathway diagrams, and other science figures with SciDraw AI.