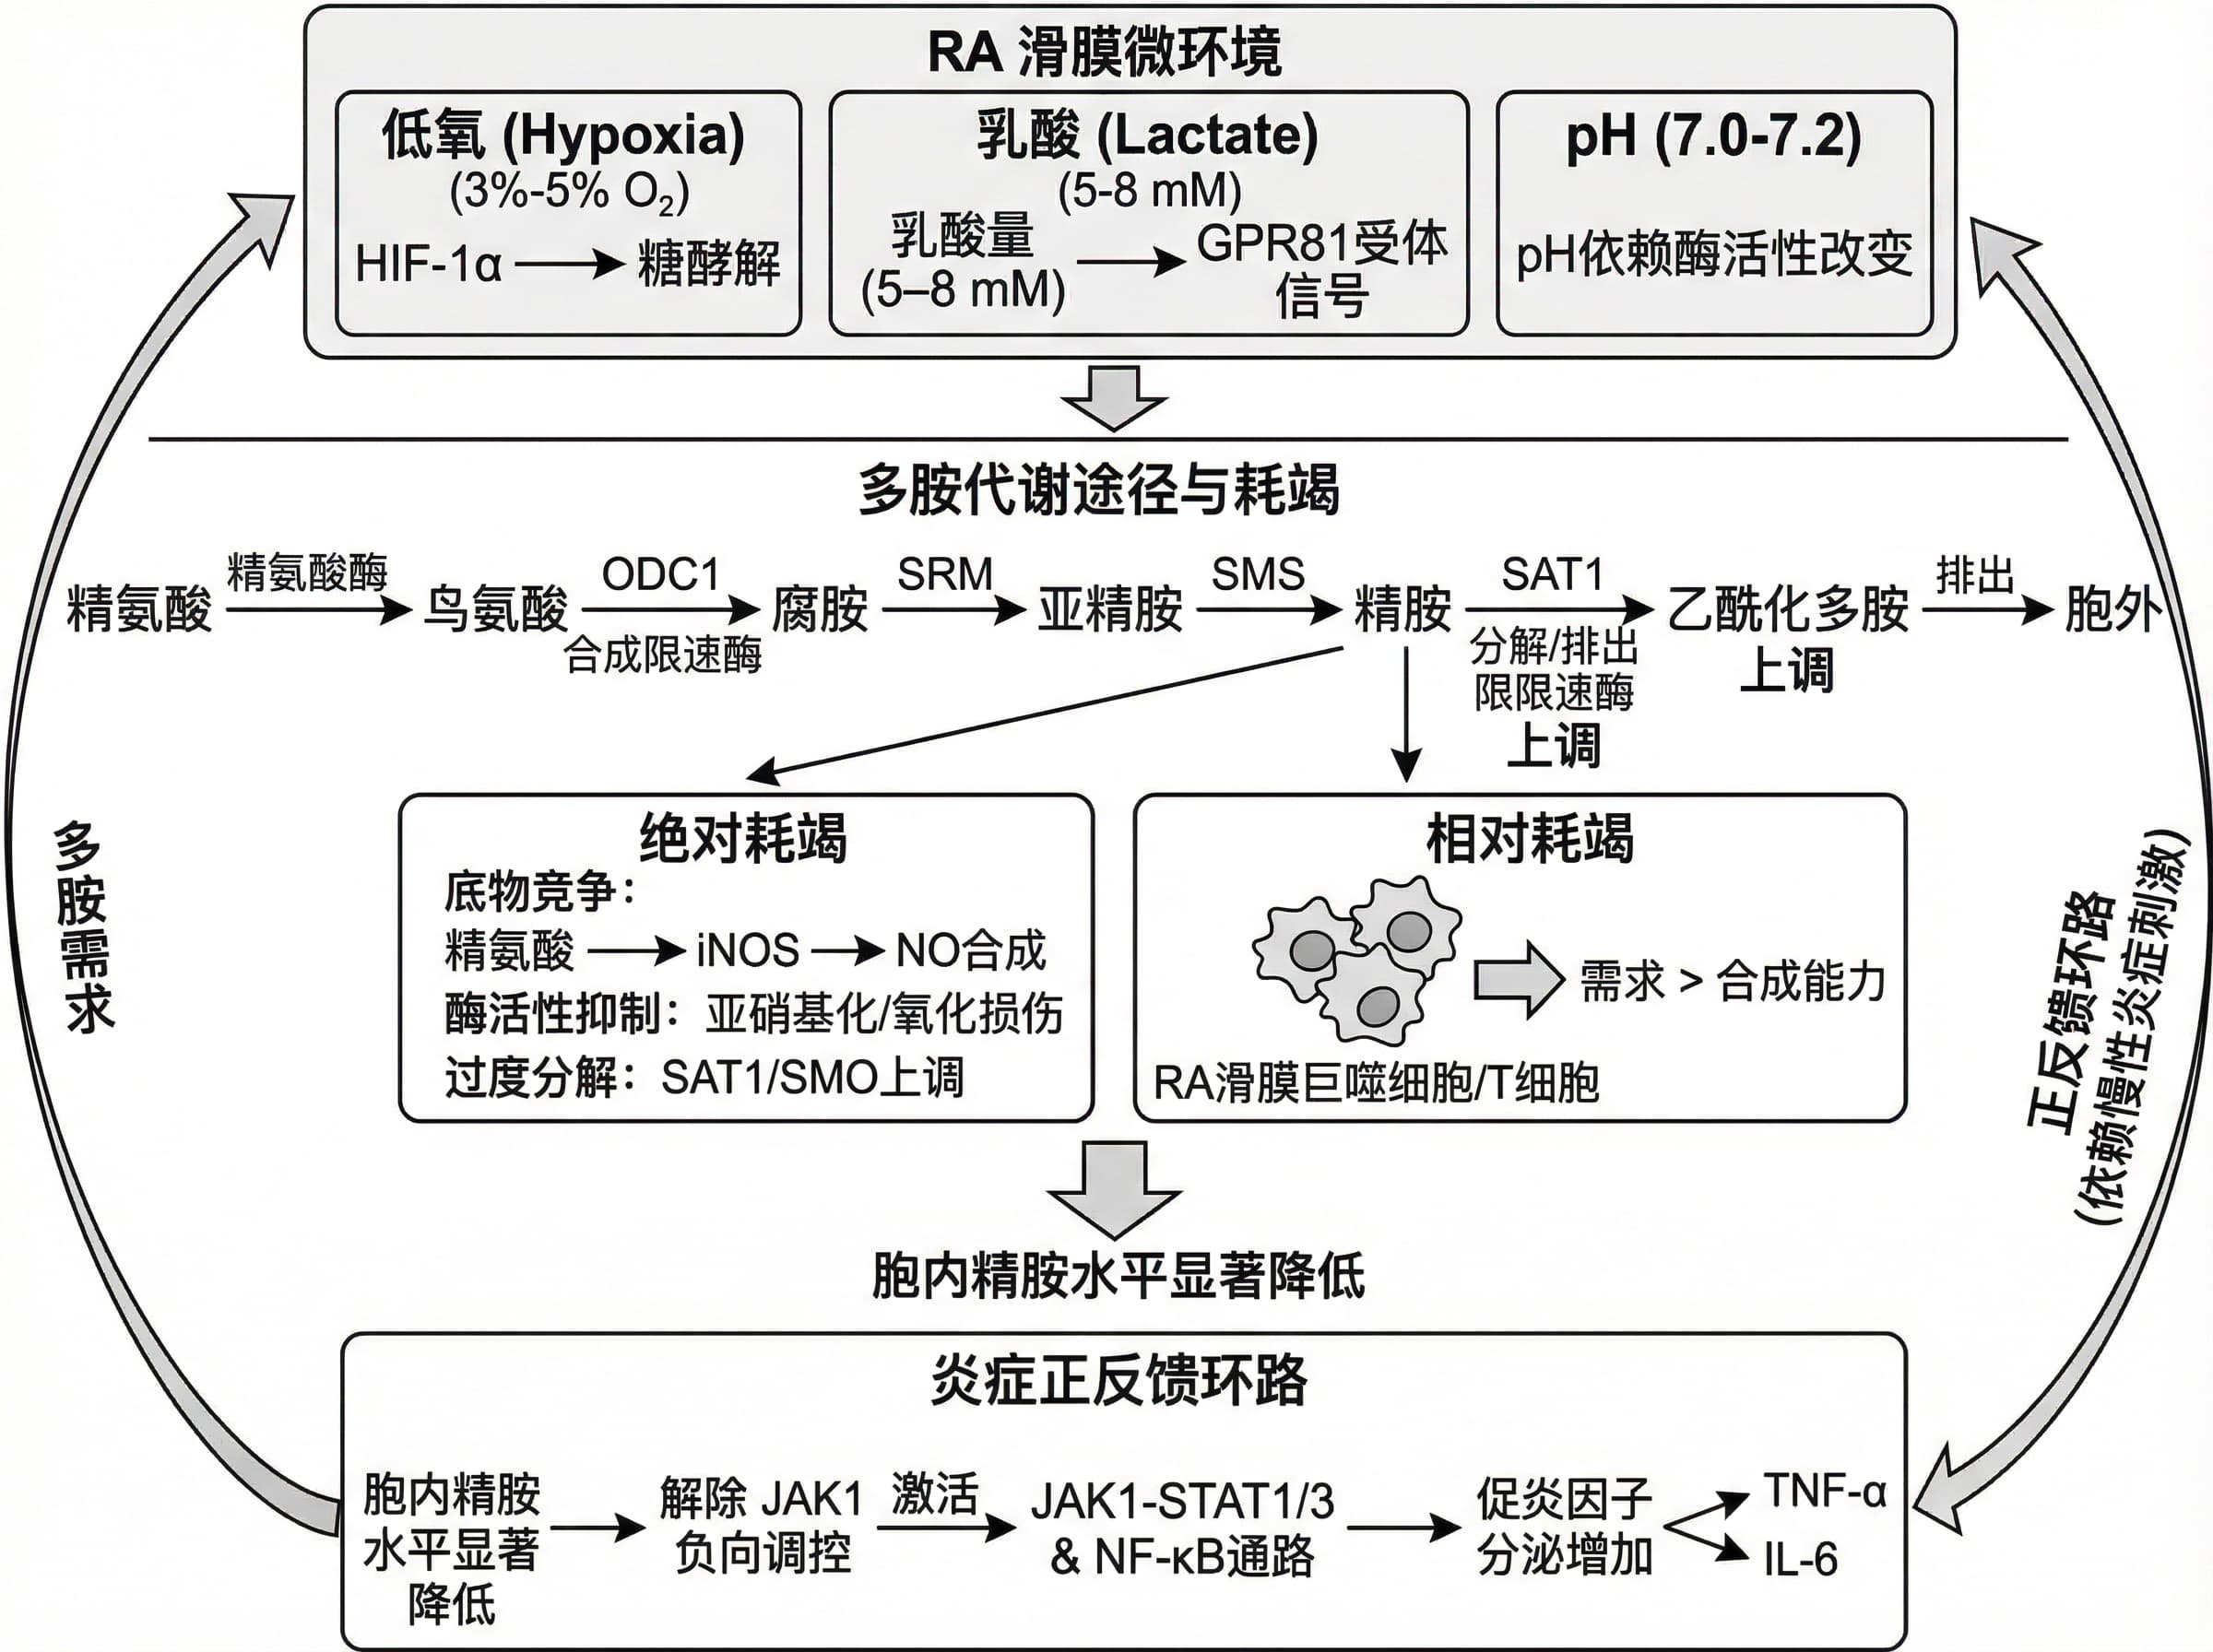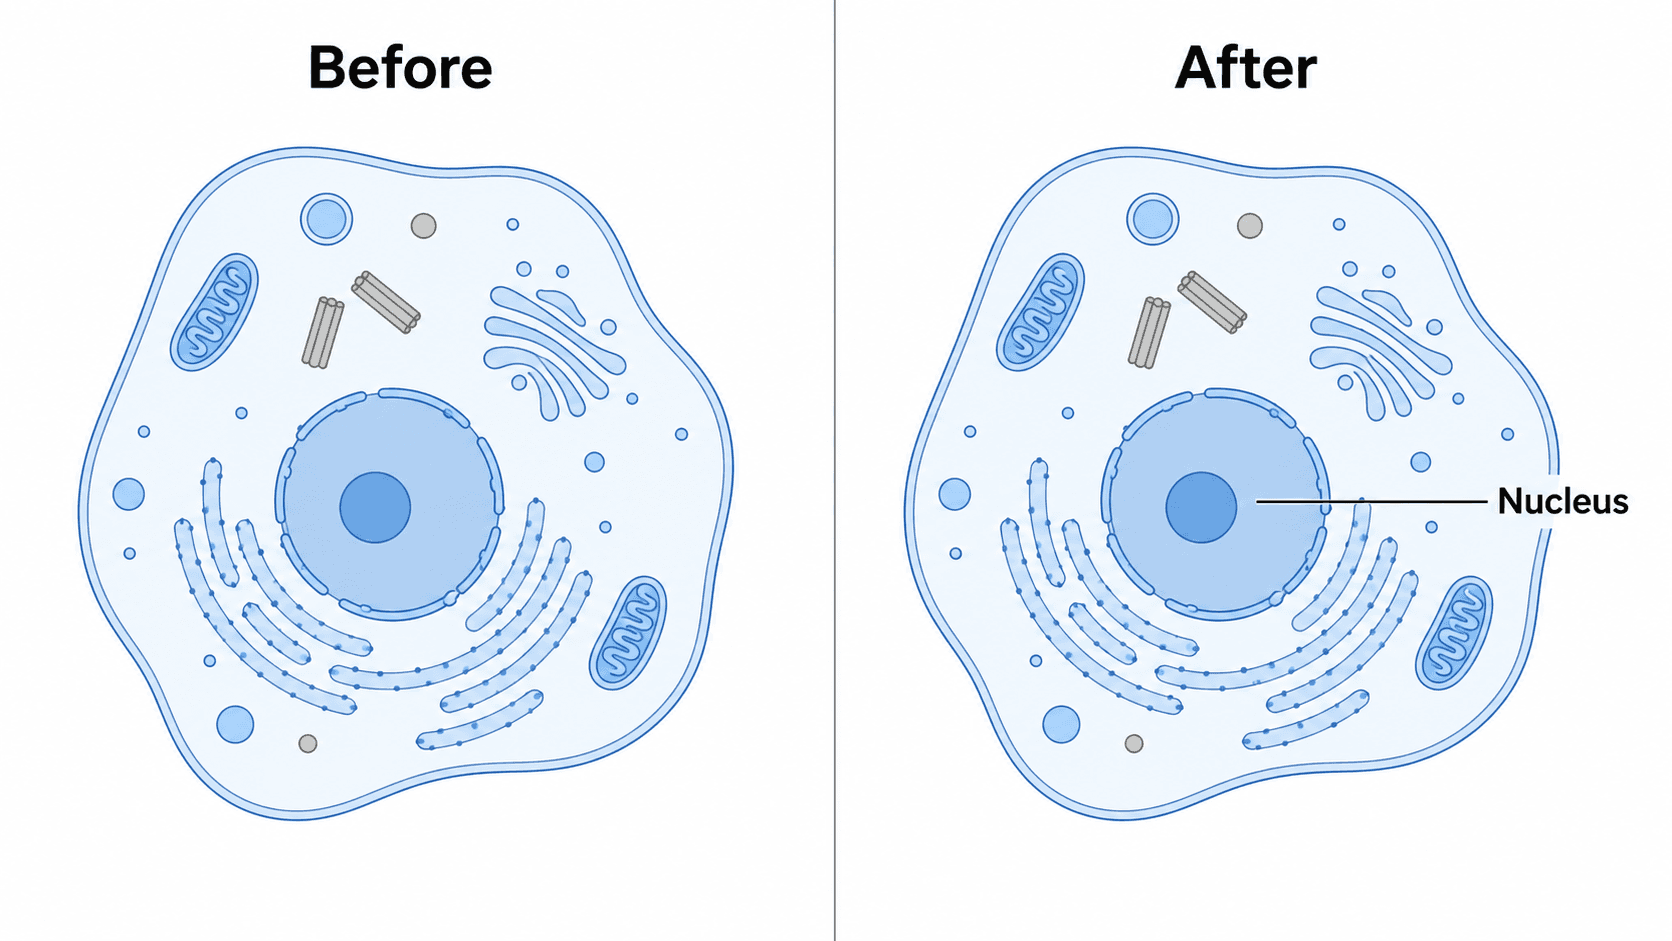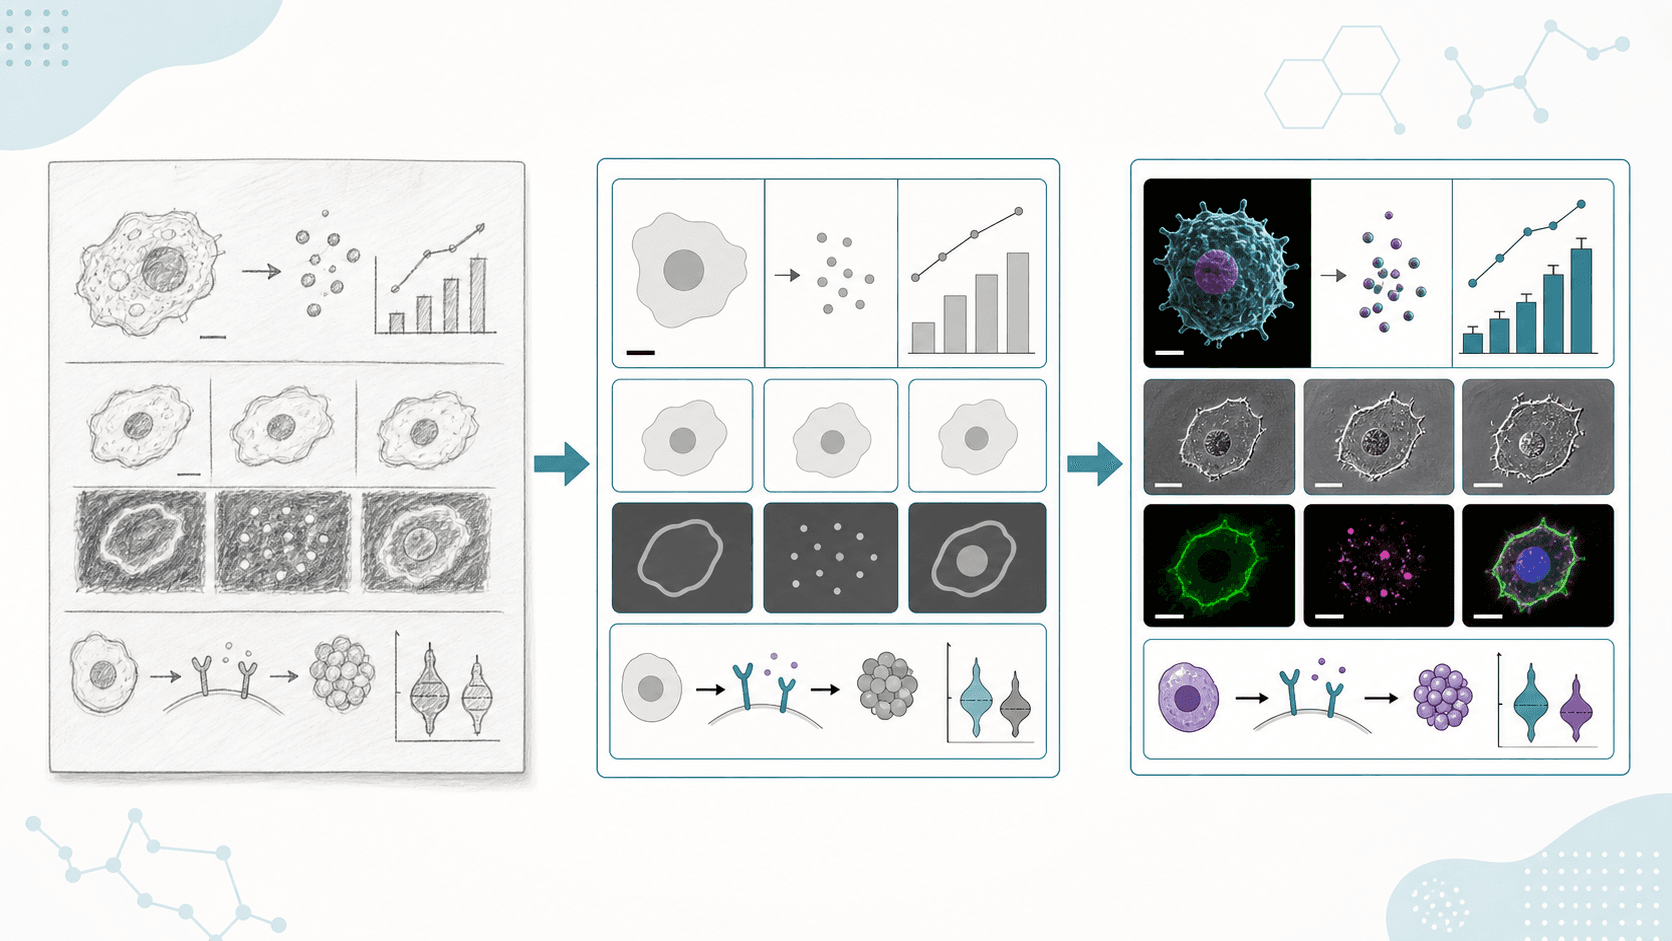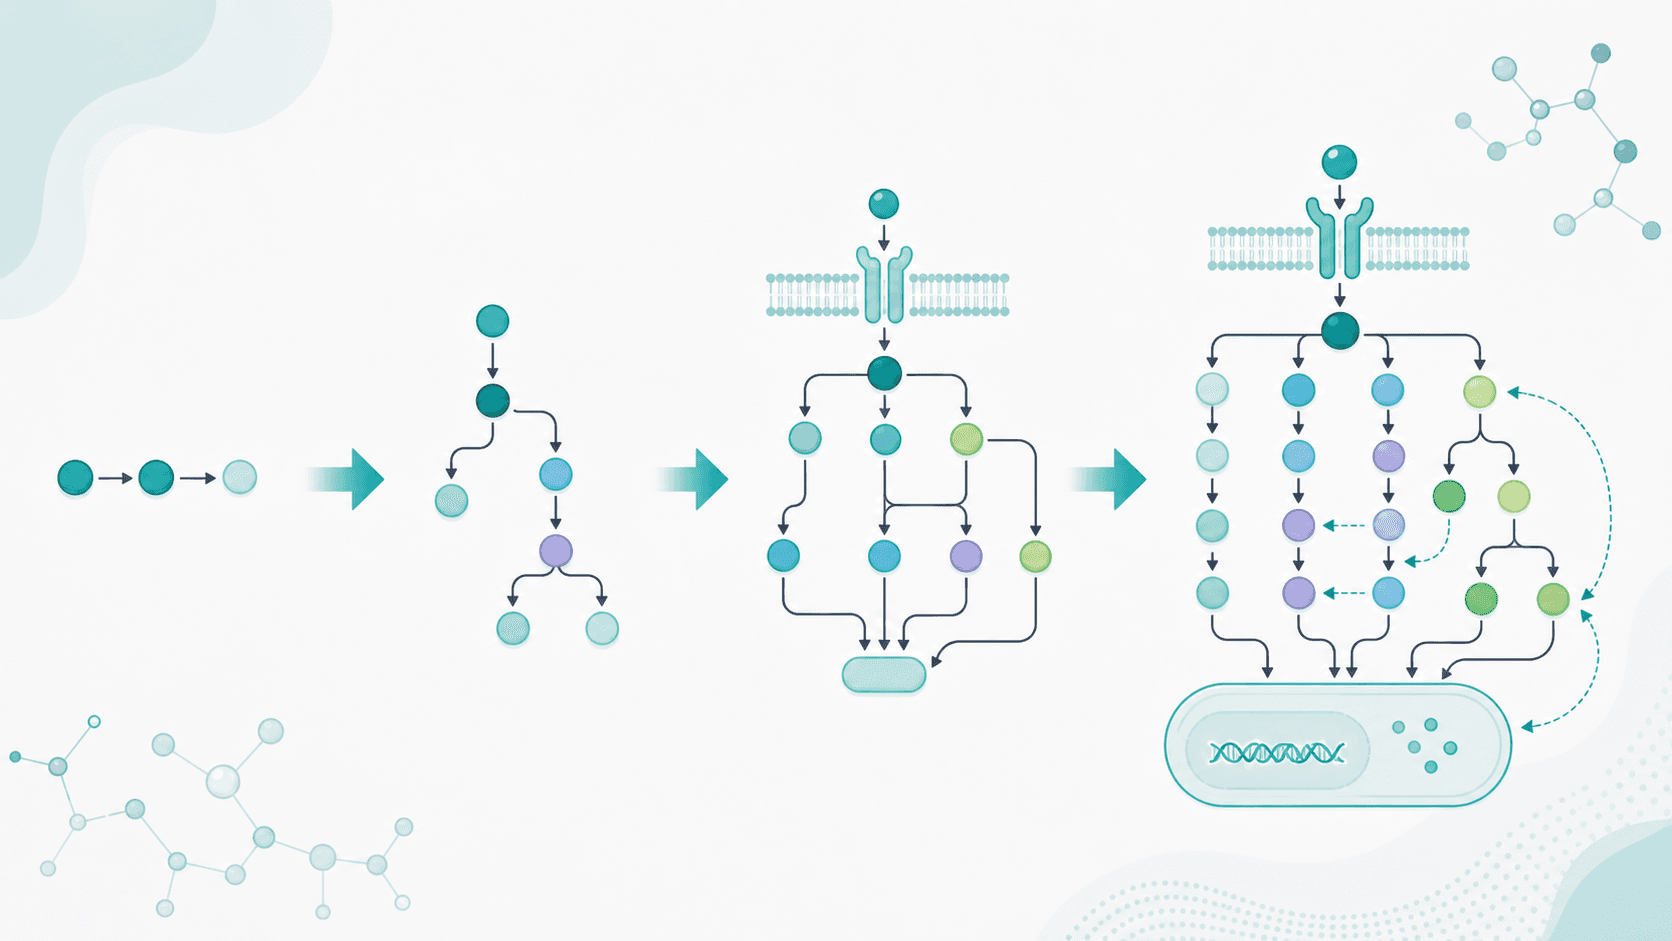
세포 신호전달 경로 그림은 한 번에 많은 일을 해내야 합니다. 막 수용체에서 키나아제 캐스케이드를 거쳐 핵까지 신호를 추적하고, 모든 노드에 라벨을 달고, 활성화와 억제를 명확히 구분해야 하죠. 이 글은 그 단계별 실전 가이드입니다 — 단순한 프롬프트 목록이 아니라, 빈 캔버스에서 내보내기 가능한 그림까지 따라가는 워크플로입니다. 복붙용 프롬프트를 원한다면 함께 보면 좋은 글 신호전달 경로 다이어그램 프롬프트를 참고하세요. 여기서는 어떤 경로 그림이든 깔끔하게 나오게 하는 방법론을 배웁니다.
이 가이드를 끝까지 읽으면 다음을 할 수 있습니다:
- AI로 신호전달 경로 그림 그리기를 네 단계로 반복 — 기획, 생성, 다듬기, 내보내기.
- 종양학이든, 면역학이든, 발생생물학이든 본인 분야에 맞게 워크플로를 적용하기.
- 라벨링된 노드, 정확한 화살표, 명확한 막-핵 흐름을 갖춘 학위논문·논문급 경로 그림 제작하기.
- AI 경로 다이어그램을 잘못 읽히게 만드는 실수 피하기.
모든 작업은 SciDraw AI 에디터에서 이뤄집니다. 그림이 곧 캔버스이고 일상 언어가 도구인 AI 네이티브 작업 공간입니다.
모든 경로 그림에 통하는 4단계 워크플로
MAPK, PI3K-AKT, NF-κB, JAK-STAT — 모든 경로 그림은 같은 네 단계에서 나옵니다.
- 경로를 기획한다. 방아쇠(리간드/수용체), 노드의 사슬(키나아제, 2차 전달자, 전사인자), 종점(유전자 발현 또는 세포 결과)을 정합니다.
- 첫 초안을 생성한다. 기획을 수용체, 순서대로의 각 노드, 활성화/억제 관계, 막과 핵을 명시한 한 문장으로 바꿉니다.
- 대화로 다듬는다. 기존 그림을 다시 칠하고, 라벨을 바꾸고, 억제제를 추가하고, 단순화하세요 — 다시 시작하지 마세요.
- 내보내고 배치한다. 논문·슬라이드·포스터용 고해상도 이미지나 편집 가능 SVG/PPTX를 다운로드합니다.
2단계 템플릿: "[수용체]에서 [노드1, 노드2, 노드3]을 거쳐 [핵 안의 종점]까지 이어지는 [경로]를 그려줘. 활성화 화살표와 끝이 평평한 억제 막대를 쓰고, 세포막과 핵을 보여줘."
1단계: 프롬프트 전에 경로를 기획하라
경로 그림은 사슬이 흐릿할 때 실패합니다. 프롬프트 전에 답하세요:
- 무엇이 방아쇠인가? 리간드와 수용체를 적습니다(예: 성장인자 → 수용체 티로신 키나아제).
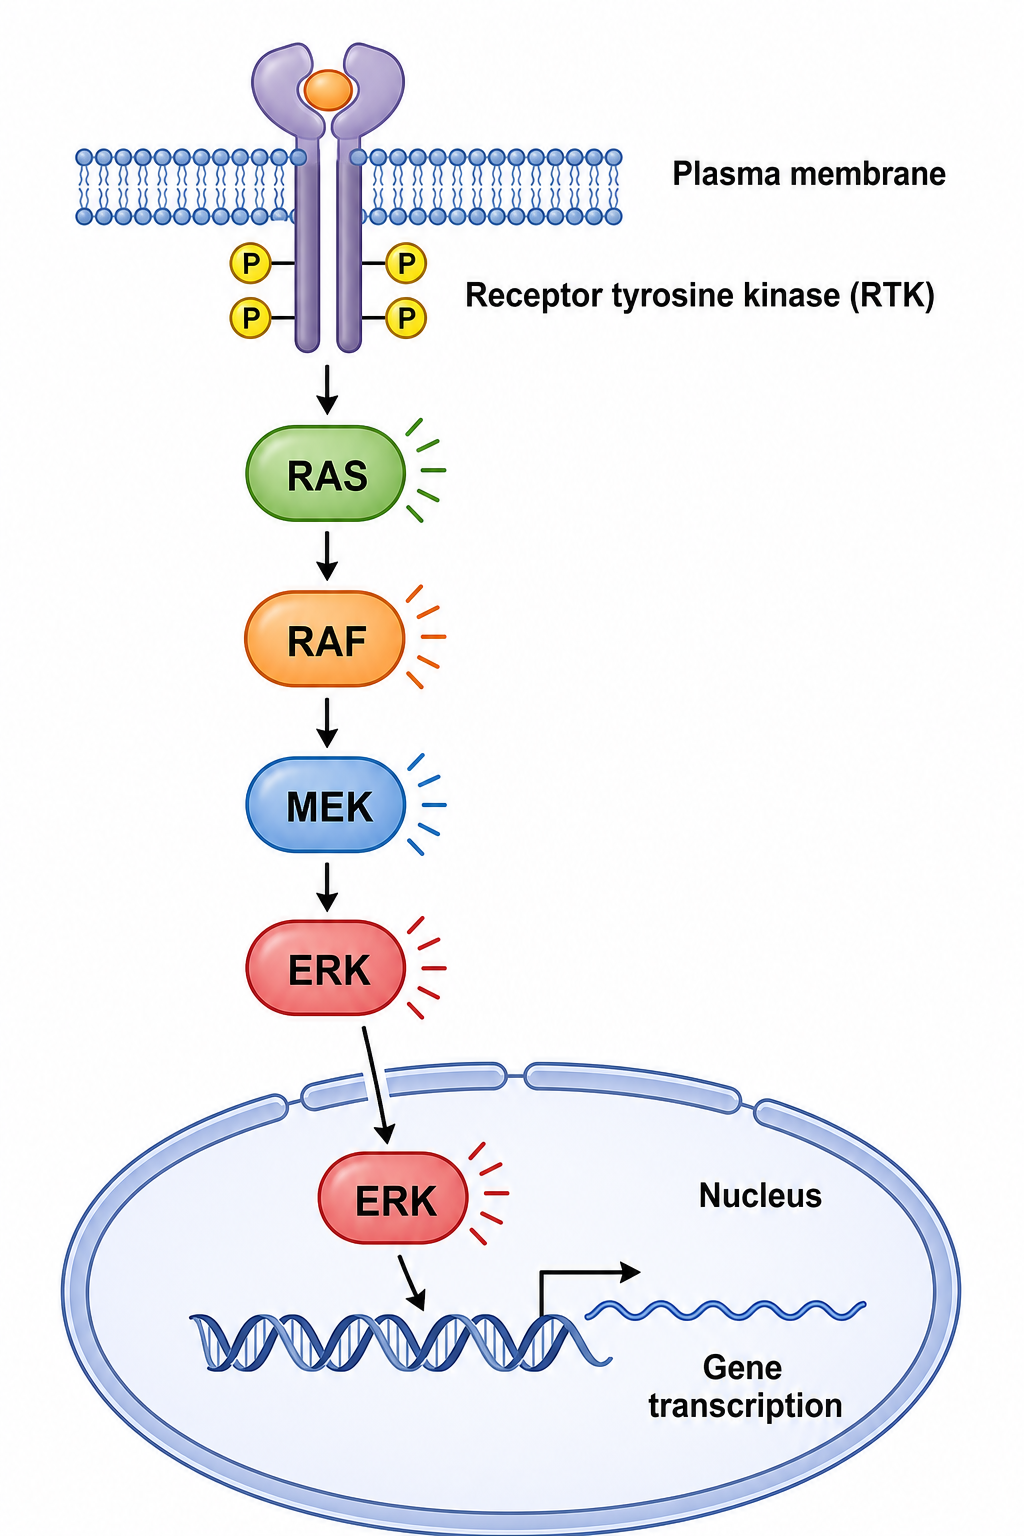
- 사슬은 순서대로 어떻게 되는가? 모든 노드를 나열합니다: RAS → RAF → MEK → ERK. 순서가 중요합니다 — AI는 당신이 준 순서대로 그립니다.
- 브레이크는 어디에 있는가? 억제제(예: PI3K에 작용하는 PTEN)를 표시해 화살표가 아니라 끝이 평평한 막대를 받게 하세요.
- 종점은 무엇인가? 유전자 전사, 성장, 생존, 염증 — 핵 안이나 그 너머에 있는 그림의 결말입니다.
이 순서가 잡힌 기획이 프롬프트의 골격이고, 캐스케이드가 올바른 순서로 나오는 이유입니다.
2단계: 첫 초안을 생성하라
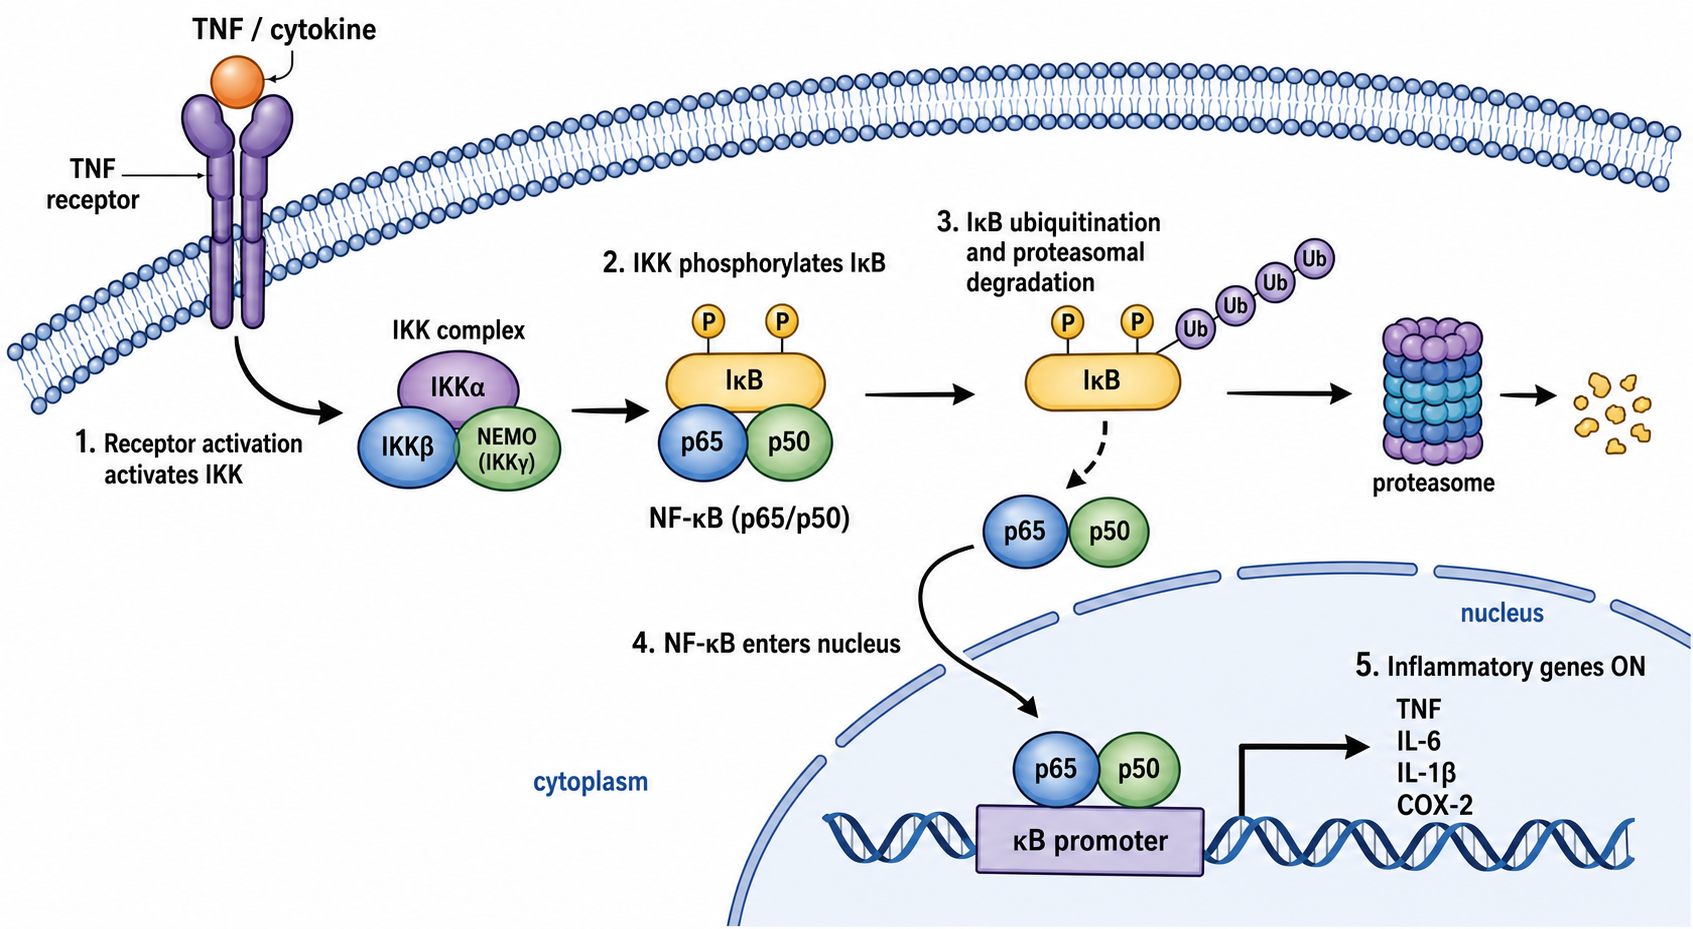
기획을 한 문장으로 바꾸세요. NF-κB라면, 기획("TNF 수용체 → IKK 복합체 → IκB 인산화/분해 → NF-κB가 핵으로 진입 → 염증성 유전자")이 한 줄의 묘사 프롬프트와 정돈된 결과가 됩니다.
첫 초안을 제대로 뽑는 요소:
- 라벨을 달고 싶은 모든 노드의 이름을 적어라. AI는 이름 붙인 것만 정확히 라벨링합니다.
- 순서를 명시적으로 진술하라. "수용체에서 X를 거쳐, 그다음 Y, 그다음 Z로, 핵에서 끝나도록."
- 화살표와 막대를 구분하라. 자극에는 "활성화 화살표", 브레이크에는 "끝이 평평한 억제 막대".
- 지리를 고정하라. "세포막과 핵"을 요청하면 다이어그램에 위에서 아래로의 공간 논리가 생깁니다.
3단계: 대화로 다듬어라 — 다시 시작하지 마라
AI 네이티브의 강점은 말로 설명해 편집하는 것입니다. 경로 그림의 전형적인 다듬기:
- "끝이 평평한 막대로 PI3K의 억제제 PTEN을 추가해줘."
- "키나아제는 파란색, 전사인자는 주황색으로 다시 칠해줘."
- "'STAT' 라벨을 'STAT3'으로 고쳐줘."
- "경로를 두 상태로 보여줘: 왼쪽은 'off', 오른쪽은 'on'."
각 지시는 기존 이미지를 그 자리에서 편집합니다. 라벨만 변경하려면 AI 그림에서 텍스트와 라벨 편집하는 법을 참고하세요.
분야별 실전 예제
네 단계는 무엇을 연구하든 적용됩니다. 기획만 달라집니다.
암 생물학과 약물 표적
메시지: 표적 치료제가 어디에 개입하는가. 성장인자 수용체에서 PI3K, PIP3, AKT, mTOR를 거치는 PI3K-AKT-mTOR를 PTEN을 억제제로 두고 기획하세요. 그다음 특정 노드를 차단하는 약물을 추가하도록 다듬어, 그림이 발암 신호와 그 치료적 브레이크를 함께 보여주게 하세요.
면역학과 사이토카인 신호전달
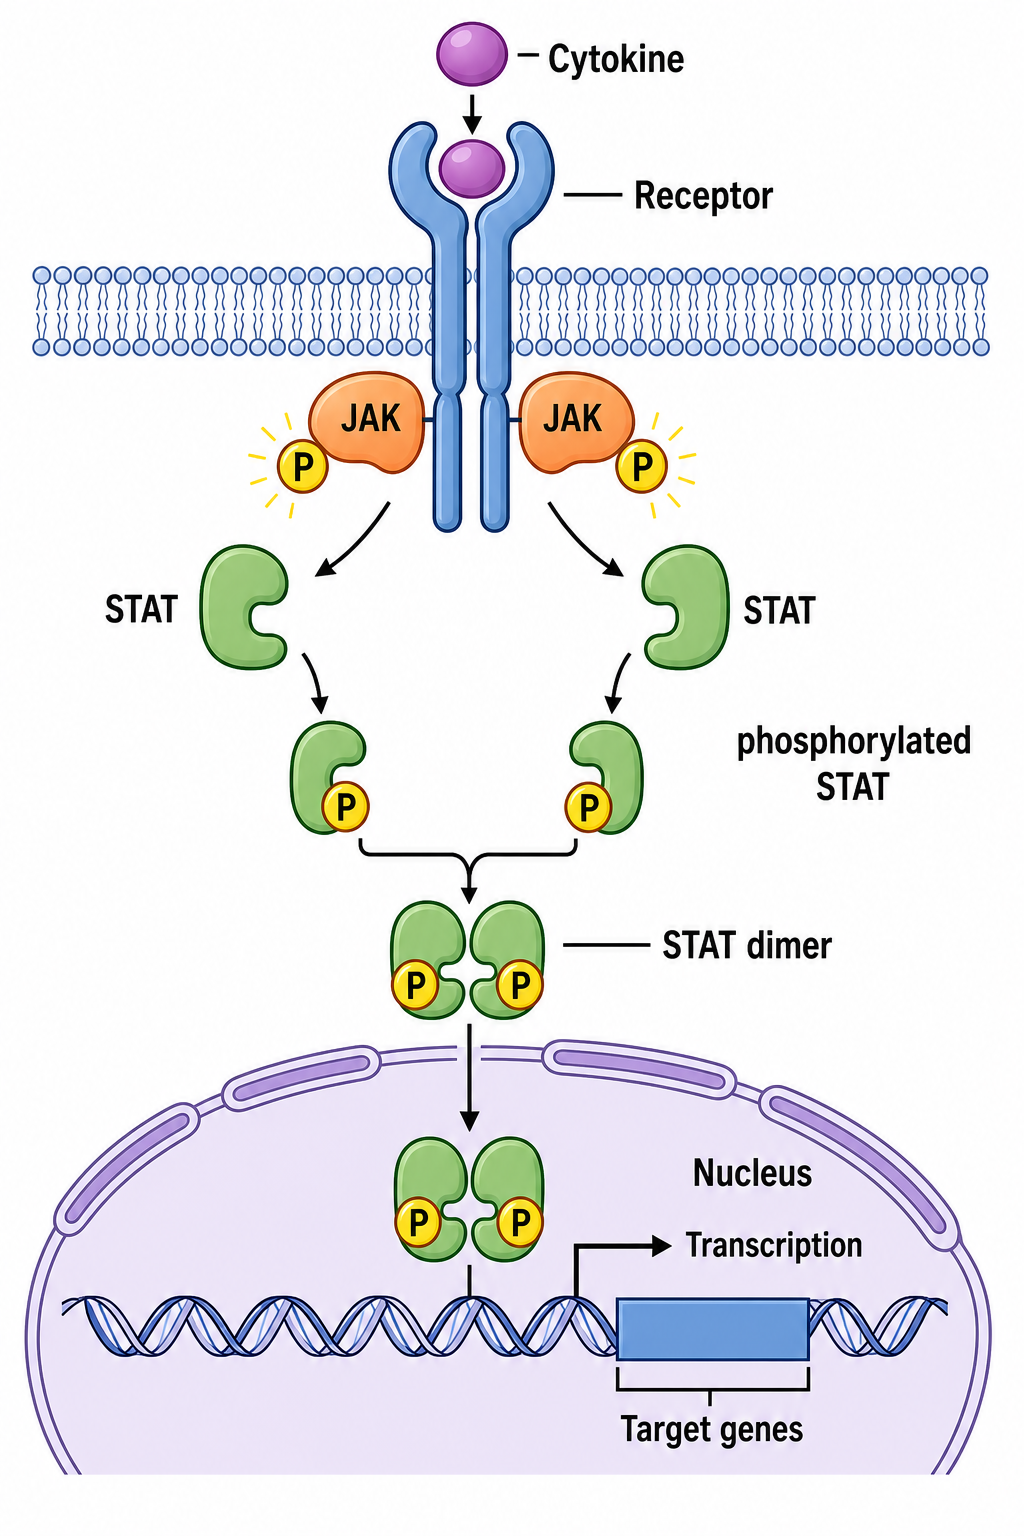
메시지: 사이토카인이 어떻게 유전자 발현을 재프로그래밍하는가. JAK-STAT를 기획하세요 — 사이토카인이 수용체에 결합, JAK가 인산화, STAT가 이량체화해 핵으로 진입. 이것이 위의 그림입니다. 염증이라면 NF-κB 기획으로 바꾸고 염증성 유전자 종점을 강조하세요.
발생생물학
메시지: 스위치 같은 결정. 정준 Wnt/β-catenin를 두 상태로 기획하세요 — "Wnt off"에서는 β-catenin이 분해 복합체에 의해 분해되고, "Wnt on"에서는 β-catenin이 안정화되어 전사를 구동. 두 상태 레이아웃이 발생학적 스위치를 한눈에 명확하게 보여줍니다.
학위논문이나 논문용 경로 그림 만들기
학위논문 챕터와 저널 투고에는 다음 제약을 처음부터 반영하세요:
- 단에 맞는 방향을 골라라. 세로의 막-핵 흐름은 1단에, 넓은 두 상태 비교는 2단에 맞습니다. 고해상도로 생성하세요.
- 패널 문자를 추가하라. "왼쪽 위에 패널 문자 'A'"를 요청해 복합 그림에 끼워 넣으세요.
- 노드 라벨은 짧게 유지하라. 상세한 메커니즘은 범례에 속하고, 그림은 골격을 보여줍니다.
- 일관성을 유지하라. 문서 안 모든 경로 그림에 색상 코드 하나(키나아제 한 색, 전사인자 다른 색)를 재사용하세요.
흔한 실수 (그리고 해결법)
- 캐스케이드 순서가 모호하다. 해결: 노드를 순서대로 명시해 AI가 순서대로 그리게 하세요.
- 억제가 활성화처럼 그려진다. 해결: 모든 브레이크에 이름을 붙여 "끝이 평평한 억제 막대"를 요청하세요.
- 지리가 빠졌다. 해결: "세포막과 핵"을 요청해 신호가 위에서 아래로 명확한 경로를 갖게 하세요.
- 크로스토크가 너무 복잡하다. 해결: 먼저 하나의 선형 경로를 그린 뒤, 후속 지시로 크로스토크를 추가하세요.
- 다듬는 대신 다시 시작한다. 해결: 기존 그림을 편집해("PTEN을 억제제로 추가해줘") 마음에 든 레이아웃을 유지하세요.
- 일반 이미지 AI의 깨진 라벨. 해결: SciDraw AI는 깔끔한 산세리프 텍스트를 렌더링합니다. 필요하면 정확한 용어를 다시 프롬프트하세요.
경로 그림 내보내기와 활용
맞춰졌다면 편집 가능한 SVG나 **PowerPoint(PPTX)**로 내보내거나, 논문·슬라이드·포스터용 고해상도 이미지를 다운로드하세요. 출판 전 색맹 안전 팔레트가 필요한가요? 과학 다이어그램 색상 변경하는 법을 보세요. 미리 작성된 시작점을 원한다면, 신호전달 경로 다이어그램 프롬프트를 둘러보고 아무거나 에디터에 넣어보세요.
자주 묻는 질문
AI로 신호전달 경로 그림은 어떻게 그리나요? 경로를 기획하고(방아쇠, 순서대로의 노드, 억제제, 종점), 신호전달 경로 다이어그램 생성기에서 한 문장으로 설명한 뒤, 대화로 다듬고 내보내세요. 4단계 워크플로가 디자인 소프트웨어 없이 논문급 그림을 줍니다.
경로 다이어그램에서 억제는 어떻게 올바로 표시하나요? 각 억제제에 이름을 붙이고 "활성화 화살표"와 구별되는 "끝이 평평한 억제 막대"를 요청하세요. 예: "끝이 평평한 막대로 PI3K의 억제제 PTEN을 추가해줘"라고 하면 AI가 브레이크를 올바로 그립니다.
논문용 세포 신호전달 그림을 무료로 만들 수 있나요? 네 — SciDraw AI 에디터에서 경로 그림을 무료로 생성하기 시작한 뒤, 더 많은 크레딧과 논문용 편집 가능 SVG/PPTX 내보내기를 위해 업그레이드할 수 있습니다.
두 상태 경로(on vs off)는 어떻게 그리나요? 두 상태를 기획하고 나란히 요청하세요: "왼쪽은 off, 오른쪽은 on으로 경로를 보여줘." Wnt/β-catenin 같은 스위치 형태 경로에 잘 맞습니다.
AI 경로 생성기는 작도 도구의 좋은 대안인가요? 모든 노드를 손으로 배치하기보다 캐스케이드를 말로 설명하는 게 낫다면, AI 생성기는 MAPK, PI3K-AKT, NF-κB, JAK-STAT 그림을 만드는 빠르고 저렴한 방법이며, 협업자용 편집 가능 내보내기까지 지원합니다.
지금 시작하기
신호전달 경로 다이어그램 생성기를 열고, 순서가 잡힌 기획을 적어, SciDraw AI 에디터에서 그림으로 바꿔보세요. RAS-RAF-MEK-ERK부터 JAK-STAT까지, 다음 논문·학위논문 그림은 워크플로 하나 거리에 있습니다.