
ECG(心電図)の図表は、学習者が「波形の正確さ」「ラベルの明快さ」「並列比較」の3つを同時に必要とするため、最も需要の高い医療ビジュアルの一つです。しかし、一般的な画像プロンプトでは、通常これらすべてにおいて失敗します。
このガイドでは、実用的なECGプロンプトシステムと、SciDraw AIですぐに活用できる30個のテンプレートを紹介します。
ユースケース:医療教育用スライド、試験対策の配布資料、ベッドサイド教育、および出版品質のコンセプト図。
なぜ一般的なECGプロンプトは失敗するのか
ほとんどのプロンプトは短すぎます。例えば、「三度房室ブロックのECGを描いて(draw third degree heart block ECG)」といった具合です。これでは、芸術的なだけの波形になったり、ラベルが欠落したり、臨床的に矛盾した間隔(インターバル)が描かれたりすることがよくあります。
優れたECGプロンプトには、以下の要素を含めるべきです:
- 臨床シナリオ(どのリズムや病態か)
- 波形のルール(PR、QRS、ST、T波の挙動)
- パネル構造(シングルストリップか、並列比較か)
- 注釈の要件(誘導名、矢印、間隔のラベル)
- 教育的コンテキスト(学生のレベルと意図する学習目標)
正確なECG図表のためのプロンプト構成案
以下の構造を使用してください:
Create a medical teaching ECG diagram of [condition].
Layout: [single strip / 2-panel / 4-panel comparison], white background.
Show leads: [lead II / V1-V6 / 12-lead summary].
Waveform rules: [PR/QRS/ST/T specifics].
Add labels: [key findings, arrows, interval values].
Style: clean textbook-style vector, high contrast, publication-ready.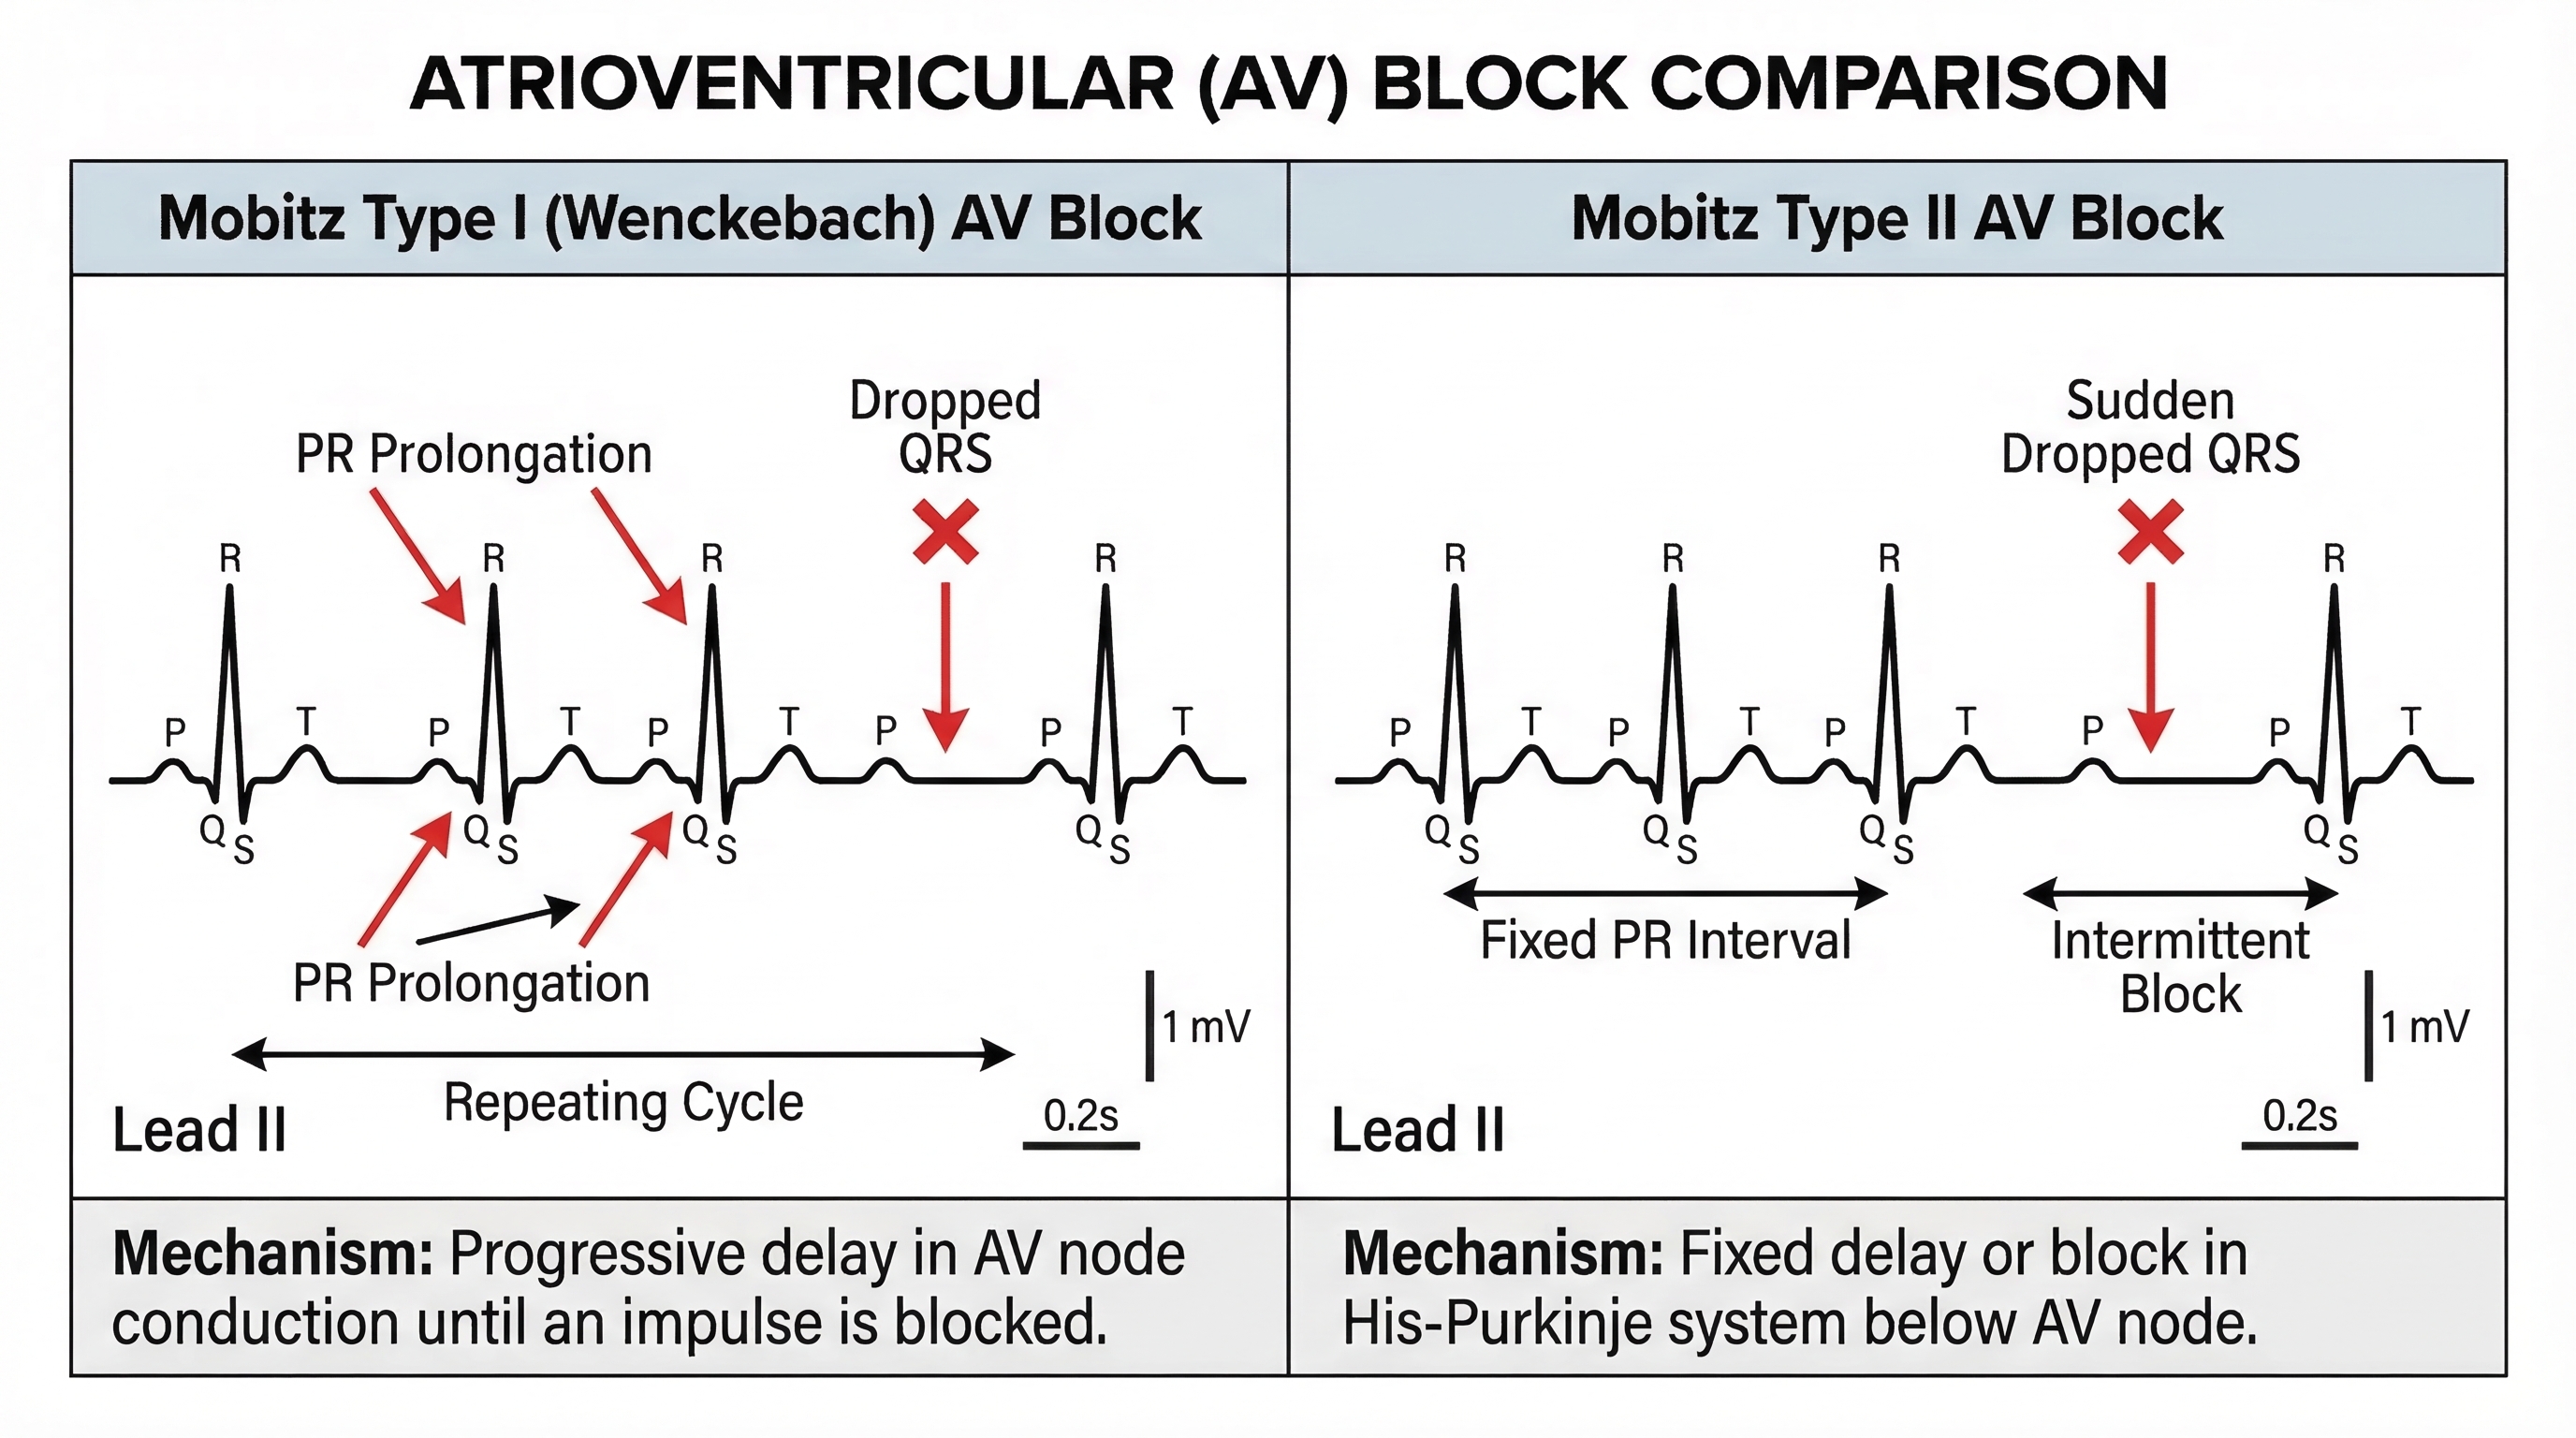
30個のECGプロンプトテンプレート
1) 伝導ブロック(Conduction Blocks)
Third-degree AV block ECG teaching diagram, 2-panel layout.
Panel A: normal sinus rhythm reference. Panel B: complete AV dissociation with
independent P waves and QRS escape rhythm. Label PR inconsistency, slow
ventricular rate, and AV dissociation arrows. Clean textbook style.
Mobitz I vs Mobitz II comparison ECG, side-by-side.
Left: progressive PR prolongation before dropped QRS. Right: fixed PR with
intermittent non-conducted P wave. Add interval callouts and color-coded labels.First-degree AV block ECG, lead II strip with normal morphology but prolonged
PR interval >200 ms. Add measurement bars and label thresholds.2) 虚血と心筋梗塞(Ischemia and Infarction)
STEMI localization ECG chart, 4-panel grid.
Inferior, anterior, lateral, and posterior patterns with affected leads and
reciprocal changes labeled. Include artery correlation notes.
NSTEMI vs STEMI ECG teaching figure, 2-panel comparison.
Left: NSTEMI ST depression/T inversion pattern. Right: STEMI ST elevation with
contiguous leads. Add decision labels for emergency pathway.Hyperacute T wave progression to ST elevation timeline in acute MI, 3-stage
horizontal diagram with clear temporal arrows.3) 不整脈の識別(Arrhythmia Recognition)
Atrial fibrillation ECG teaching figure, irregularly irregular rhythm,
no discrete P waves, variable R-R intervals. Add rhythm strip markers.
Atrial flutter ECG with sawtooth flutter waves and 2:1 conduction example.
Include lead II emphasis and comparison inset with sinus rhythm.SVT vs ventricular tachycardia quick differentiation chart with QRS width,
rate range, and AV relationship labels.4) 波形形態と電解質(Wave Morphology and Electrolytes)
T-wave morphology atlas ECG panel: peaked T wave, inverted T wave,
biphasic T wave, and hyperacute T wave with labels and clinical hints.
Hyperkalemia progression ECG sequence: peaked T, PR prolongation,
QRS widening, sine-wave morphology. Four-stage panel with arrows.Osborn wave (J wave) educational ECG figure in hypothermia context,
with notch labeling at J point and differential notes.5) 教育および評価用レイアウト(Teaching and Assessment Layouts)
ECG interpretation checklist infographic for medical students.
Sections: rate, rhythm, axis, intervals, morphology, ischemia signs.
Include icon-based flow and quick examples.
12-lead ECG systematic reading workflow, top-to-bottom algorithm chart with
branch decisions and common pitfalls.ECG exam review summary page with mini-strips and key diagnostic clues,
optimized for one-page print handout.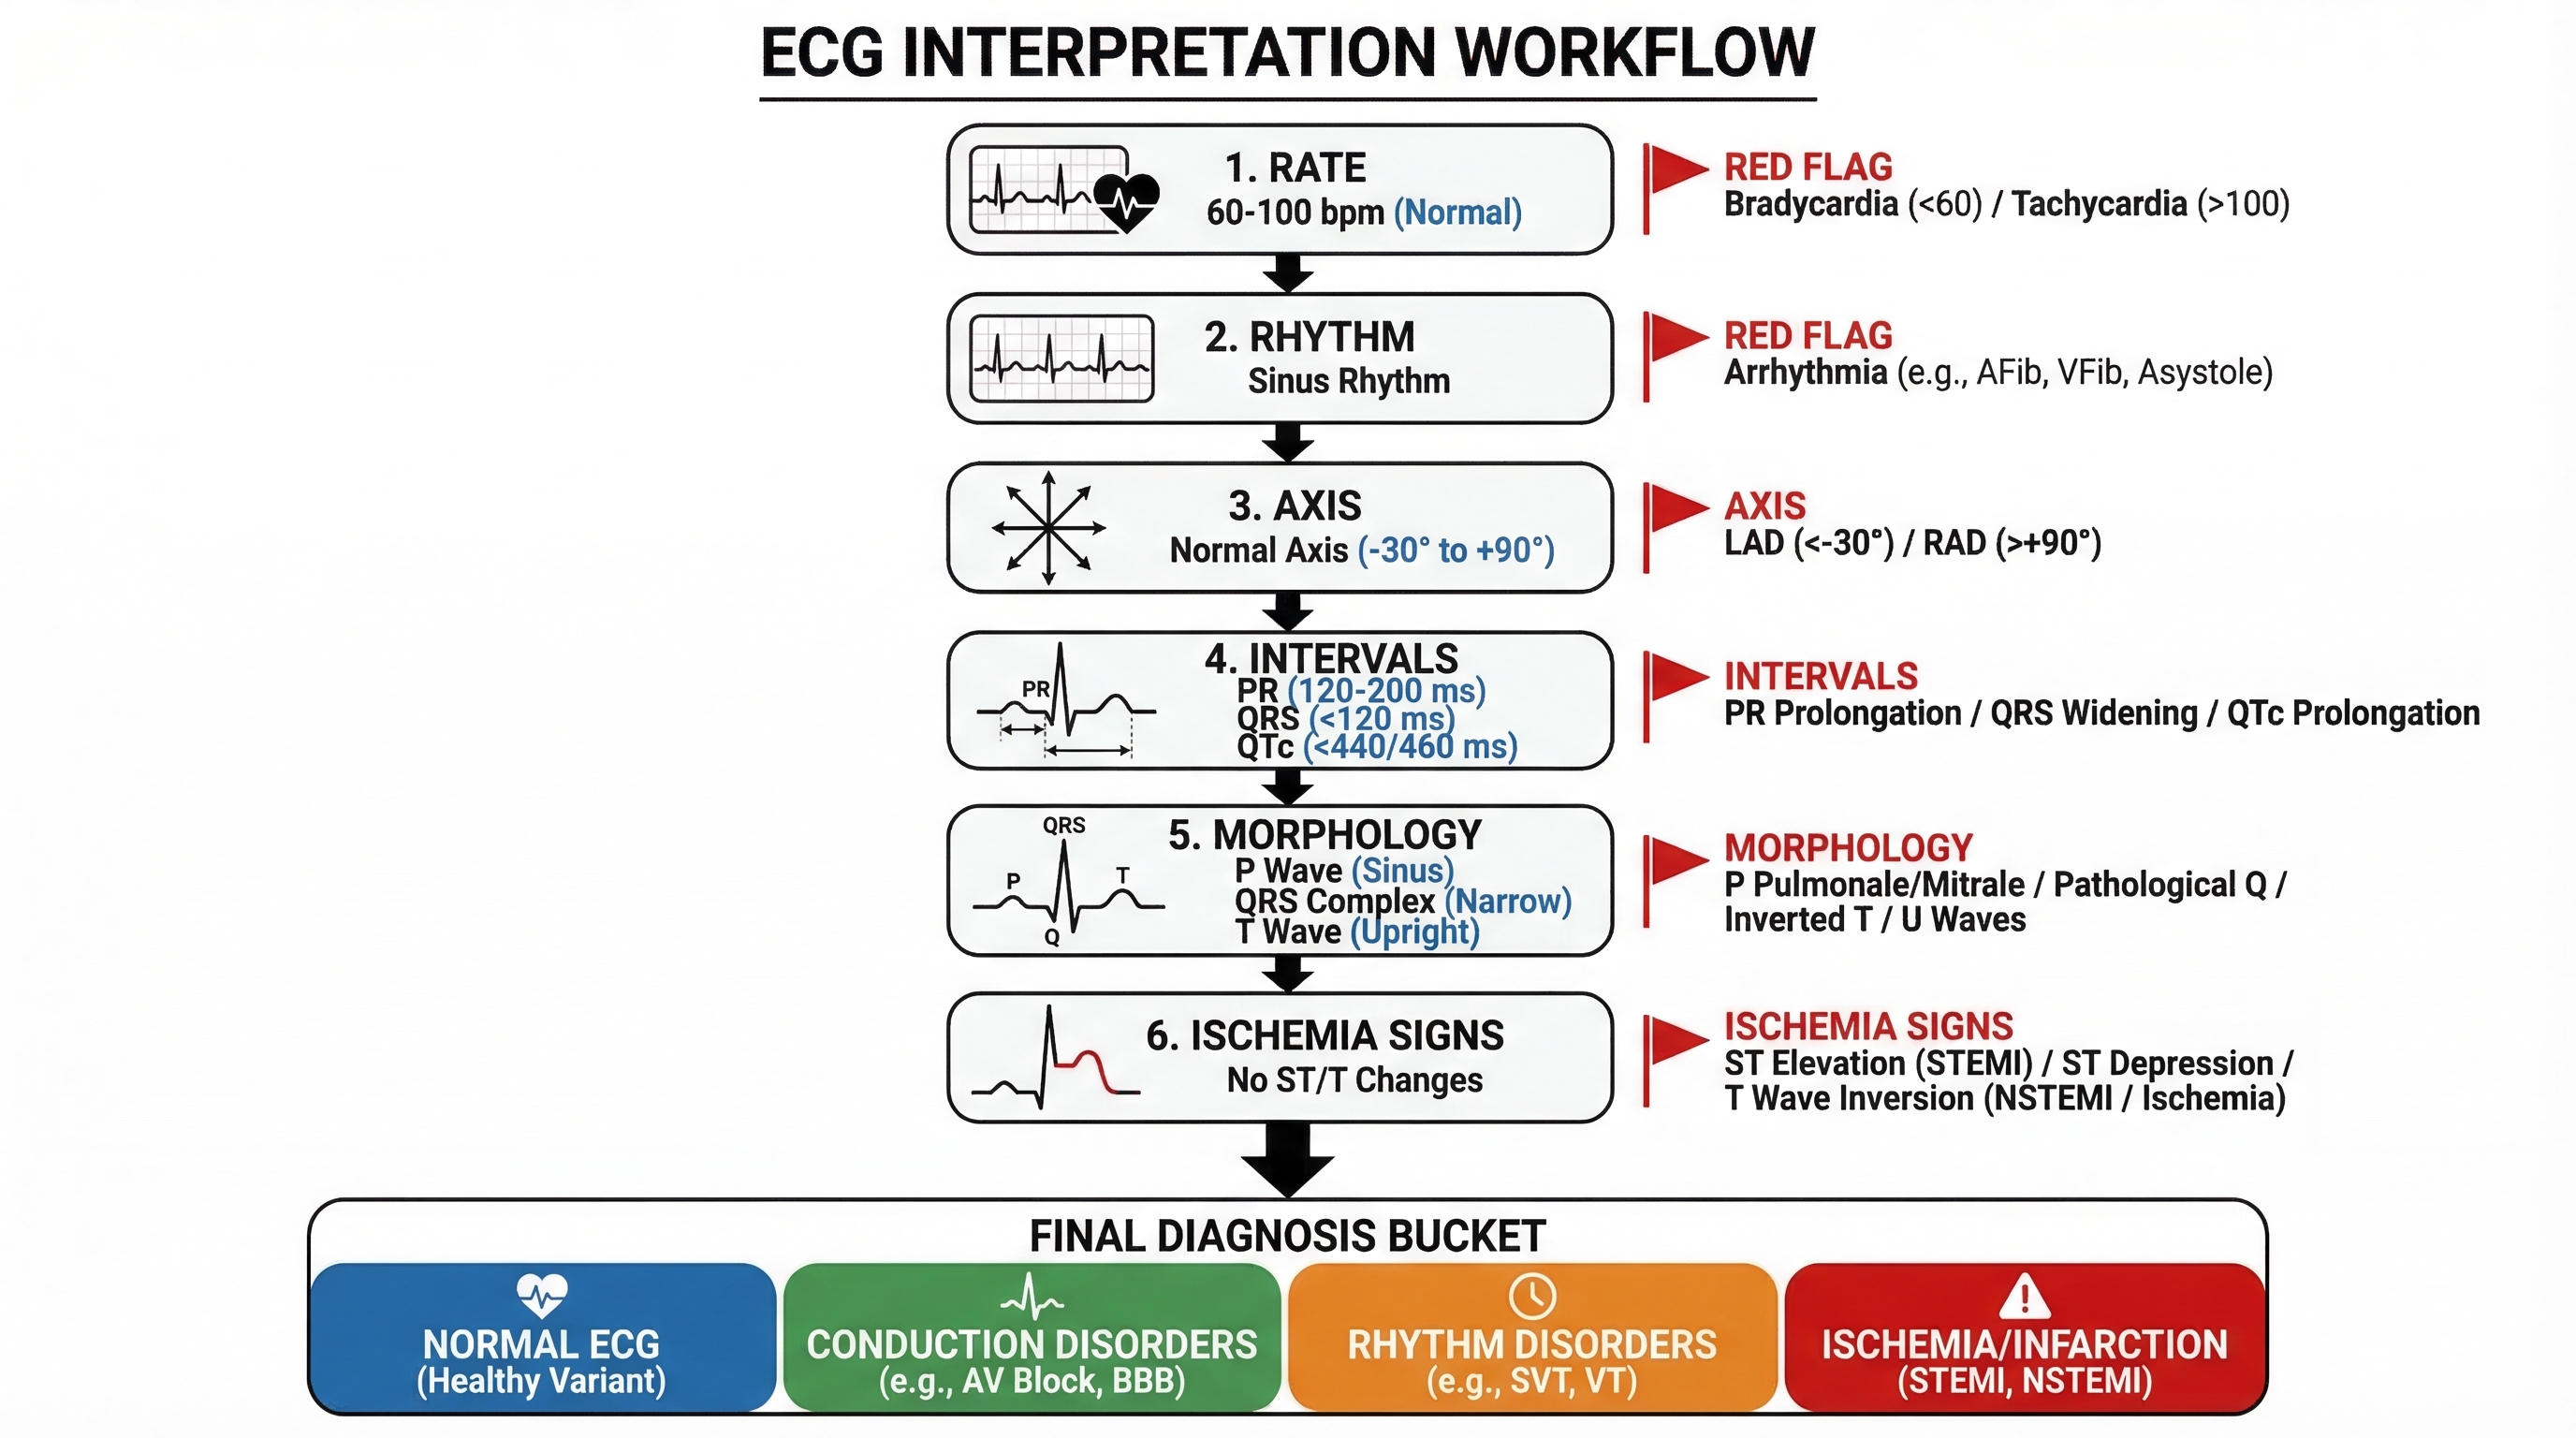
各テンプレートは、疾患名と波形のルールを書き換えるだけでカスタマイズ可能です。
エクスポート前の品質チェックリスト
- 波形は臨床的に妥当ですか?
- 誘導名やラベルは、スライドサイズで読める大きさですか?
- 比較レイアウトは、一つの教育的疑問に明確に答えていますか?
- 間隔の値や診断の手がかりは、明示的に注釈されていますか?
- 配色は、投影や印刷に適したクリーンなものですか?
最後にアドバイス
出力結果が「綺麗だが曖昧」な場合は、より厳格な波形の制約と、明示的なラベル要件を追加してください。ECGのビジュアルにおいては、装飾よりも正確さが重要です。
独自のECG教育用図表を作成してみましょう。


")
")