Die umweltwissenschaftliche Forschung erfordert klare Visualisierungen von ökologischen Prozessen, Schadstoffpfaden und Nachhaltigkeitsrahmenwerken. Dieser Leitfaden stellt 30 bewährte KI-Prompts aus der realen Umweltforschung vor, die Ihnen helfen, publikationsreife Diagramme für Fachzeitschriften, Berichte und Präsentationen zu erstellen.
Was Sie in diesem Leitfaden finden:
- Diagramme zu ökologischen Prozessen und biogeochemischen Kreisläufen
- Illustrationen von Schadstoffquellen und -pfaden
- Rahmenwerke für nachhaltiges Design und Optimierung
- Technische Roadmaps für die Umweltforschung
1. Nachhaltiges Design und Optimierung
1.1 Passives Solardesign
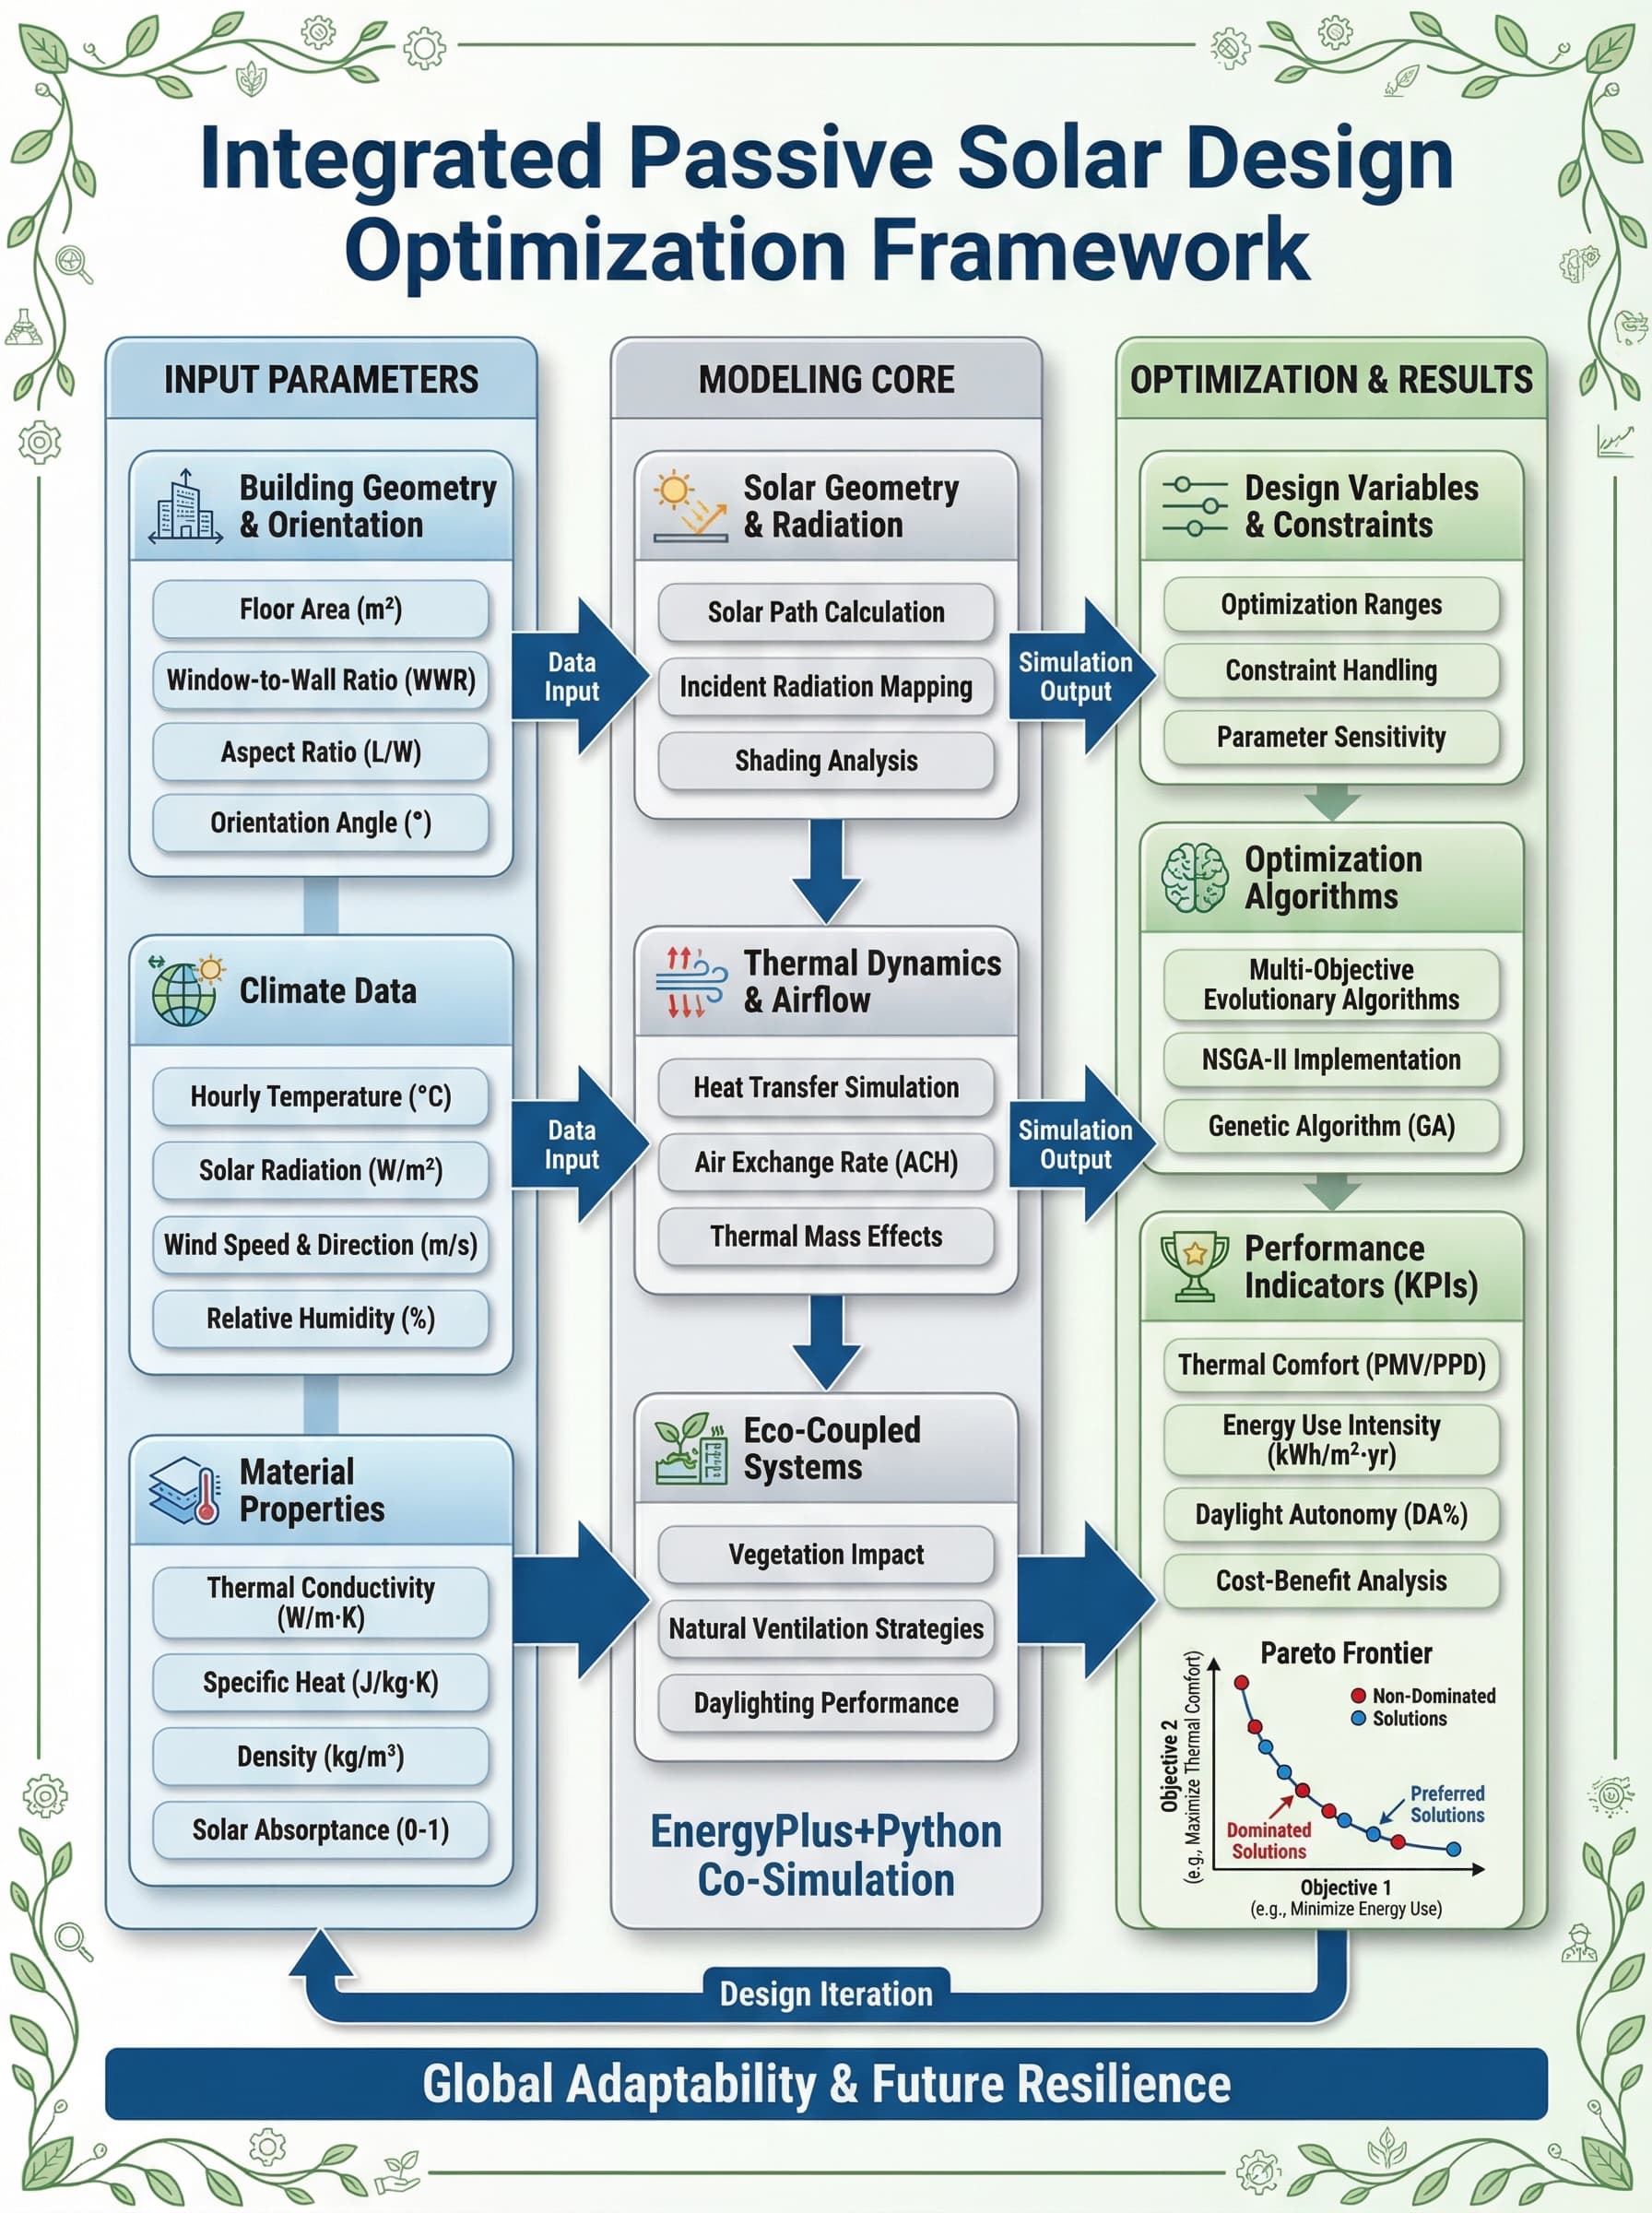
Prompt: Integriertes Rahmenwerk für passives Solardesign
Generate a landscape-oriented scientific framework diagram in English, titled
"Integrated Passive Solar Design Optimization Framework". Show:
- Building orientation and solar geometry
- Thermal mass placement strategies
- Natural ventilation pathways
- Daylighting optimization zones
- Energy performance indicators
- Integration with active systems
Use a professional scientific diagram style with clear hierarchical structure.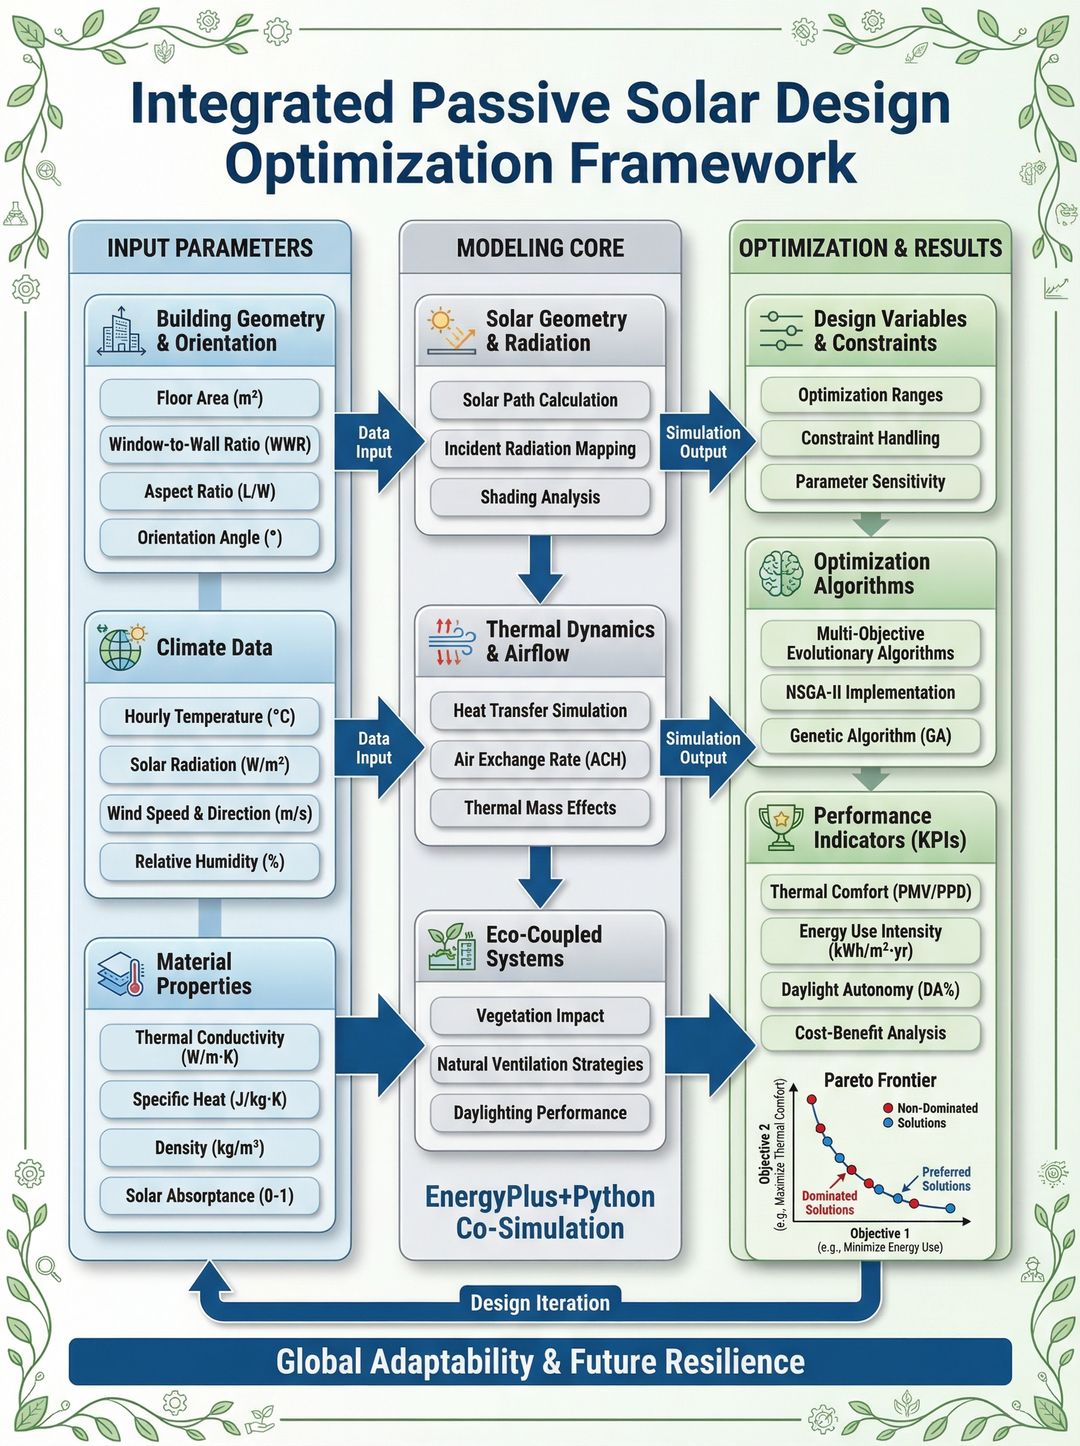
1.2 Reaktion auf landwirtschaftlichen Stress
Prompt: Auswirkungen von Umweltstress auf Nutzpflanzen
Environmental stress and suboptimal planting schedules significantly limit
cauliflower production by disrupting developmental processes. Create a diagram
showing:
- Temperature stress effects on plant physiology
- Water stress indicators and thresholds
- Developmental stage sensitivity windows
- Yield loss pathways
- Mitigation strategies (irrigation, shading)
Include both stress mechanism and management response panels.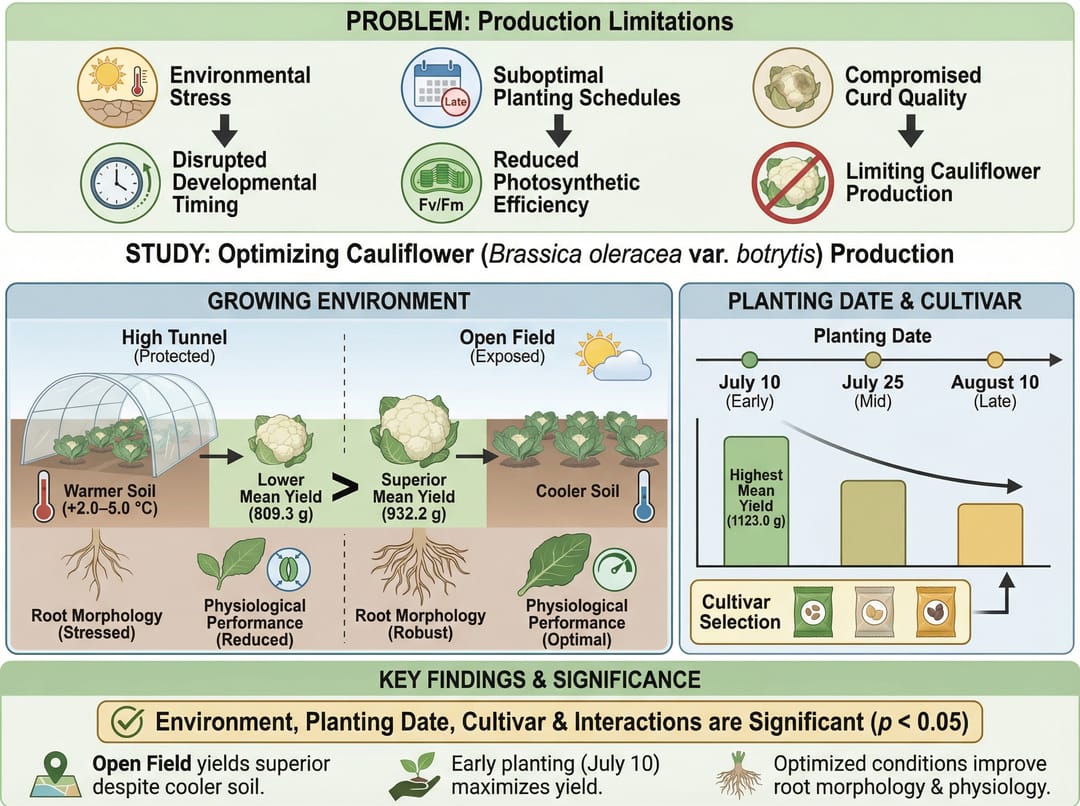
2. Biogeochemische Kreisläufe
2.1 Stickstoffprozesse im Boden
Prompt: Nitrifikationsmechanismus in Ackerböden
Draw a schematic diagram illustrating the mechanism of the nitrification process
in farmland soil. With ammonia oxidation as the central process, show:
- NH4+ to NO2- conversion (ammonia-oxidizing bacteria)
- NO2- to NO3- conversion (nitrite-oxidizing bacteria)
- Environmental factors affecting rates (pH, temperature, moisture)
- Coupling with denitrification
- N2O emission pathways
Use soil profile cross-section with microbial community visualization.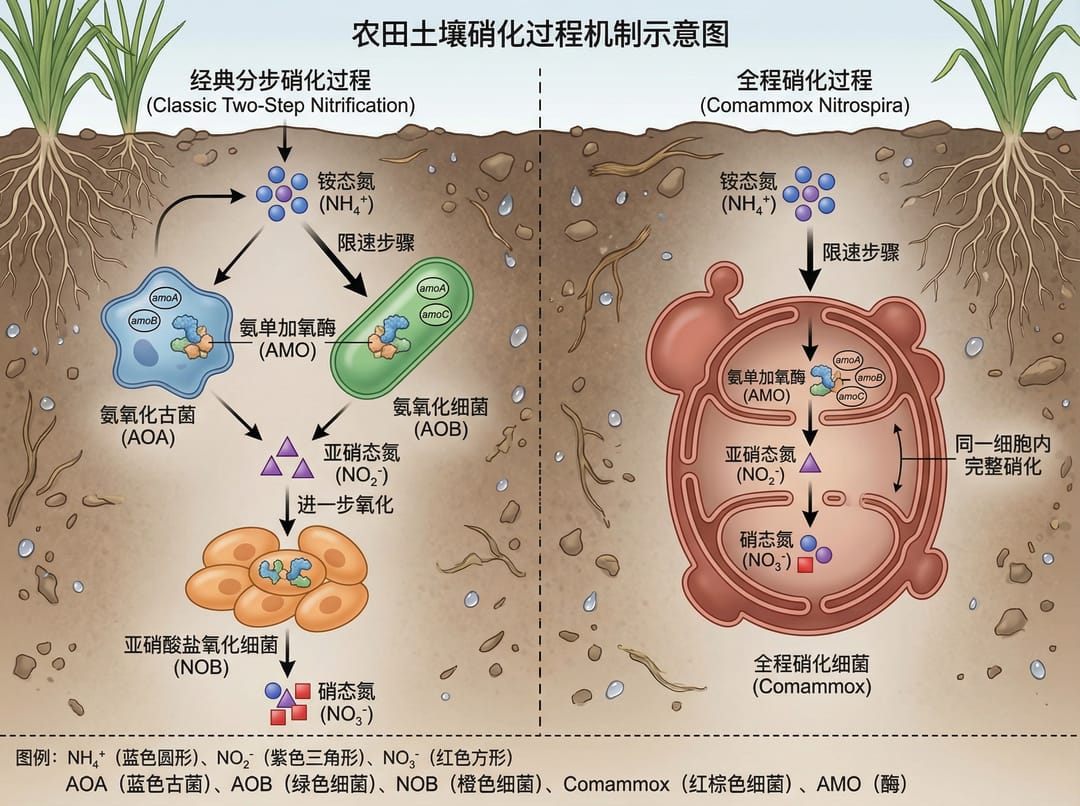
3. Neu auftretende Schadstoffe (Emerging Contaminants)
3.1 Schadstoffquellen und -pfade
Prompt: Quellen neu auftretender Schadstoffe
Emerging contaminants originate from diverse sources, with their release closely
linked to human production and lifestyle activities. Create an illustration showing:
- Pharmaceutical sources (hospitals, households, manufacturing)
- Personal care product pathways
- Agricultural chemical inputs
- Industrial discharge points
- Transport through water, soil, and air
- Exposure routes to ecosystems and humans
Use a circular or network diagram style.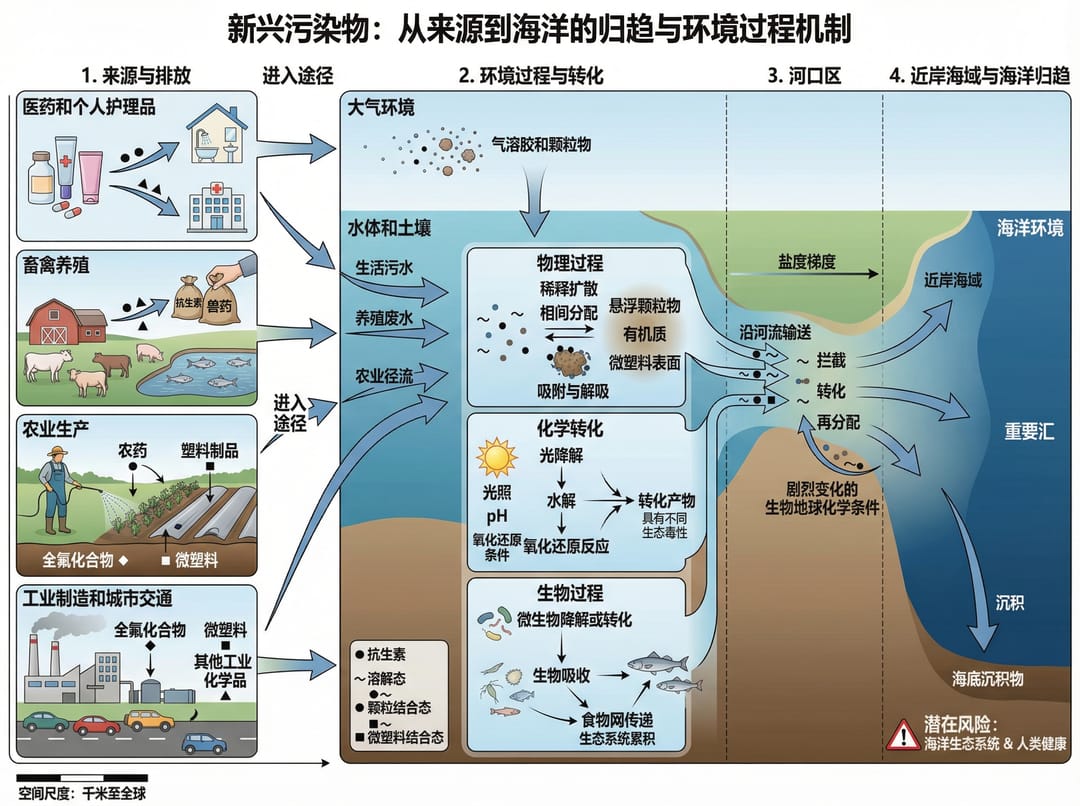
3.2 Transfer im marinen Nahrungsnetz
Prompt: Trophischer Transfer von PPCPs in marinen Systemen
Could you help me generate a technical roadmap? I am a graduate student studying
the trophic transfer of PPCPs (pharmaceuticals and personal care products) in
marine food webs. Show:
- Primary producer uptake mechanisms
- Bioaccumulation at each trophic level
- Biomagnification factors
- Metabolic transformation pathways
- Human exposure through seafood consumption
- Research methodology workflow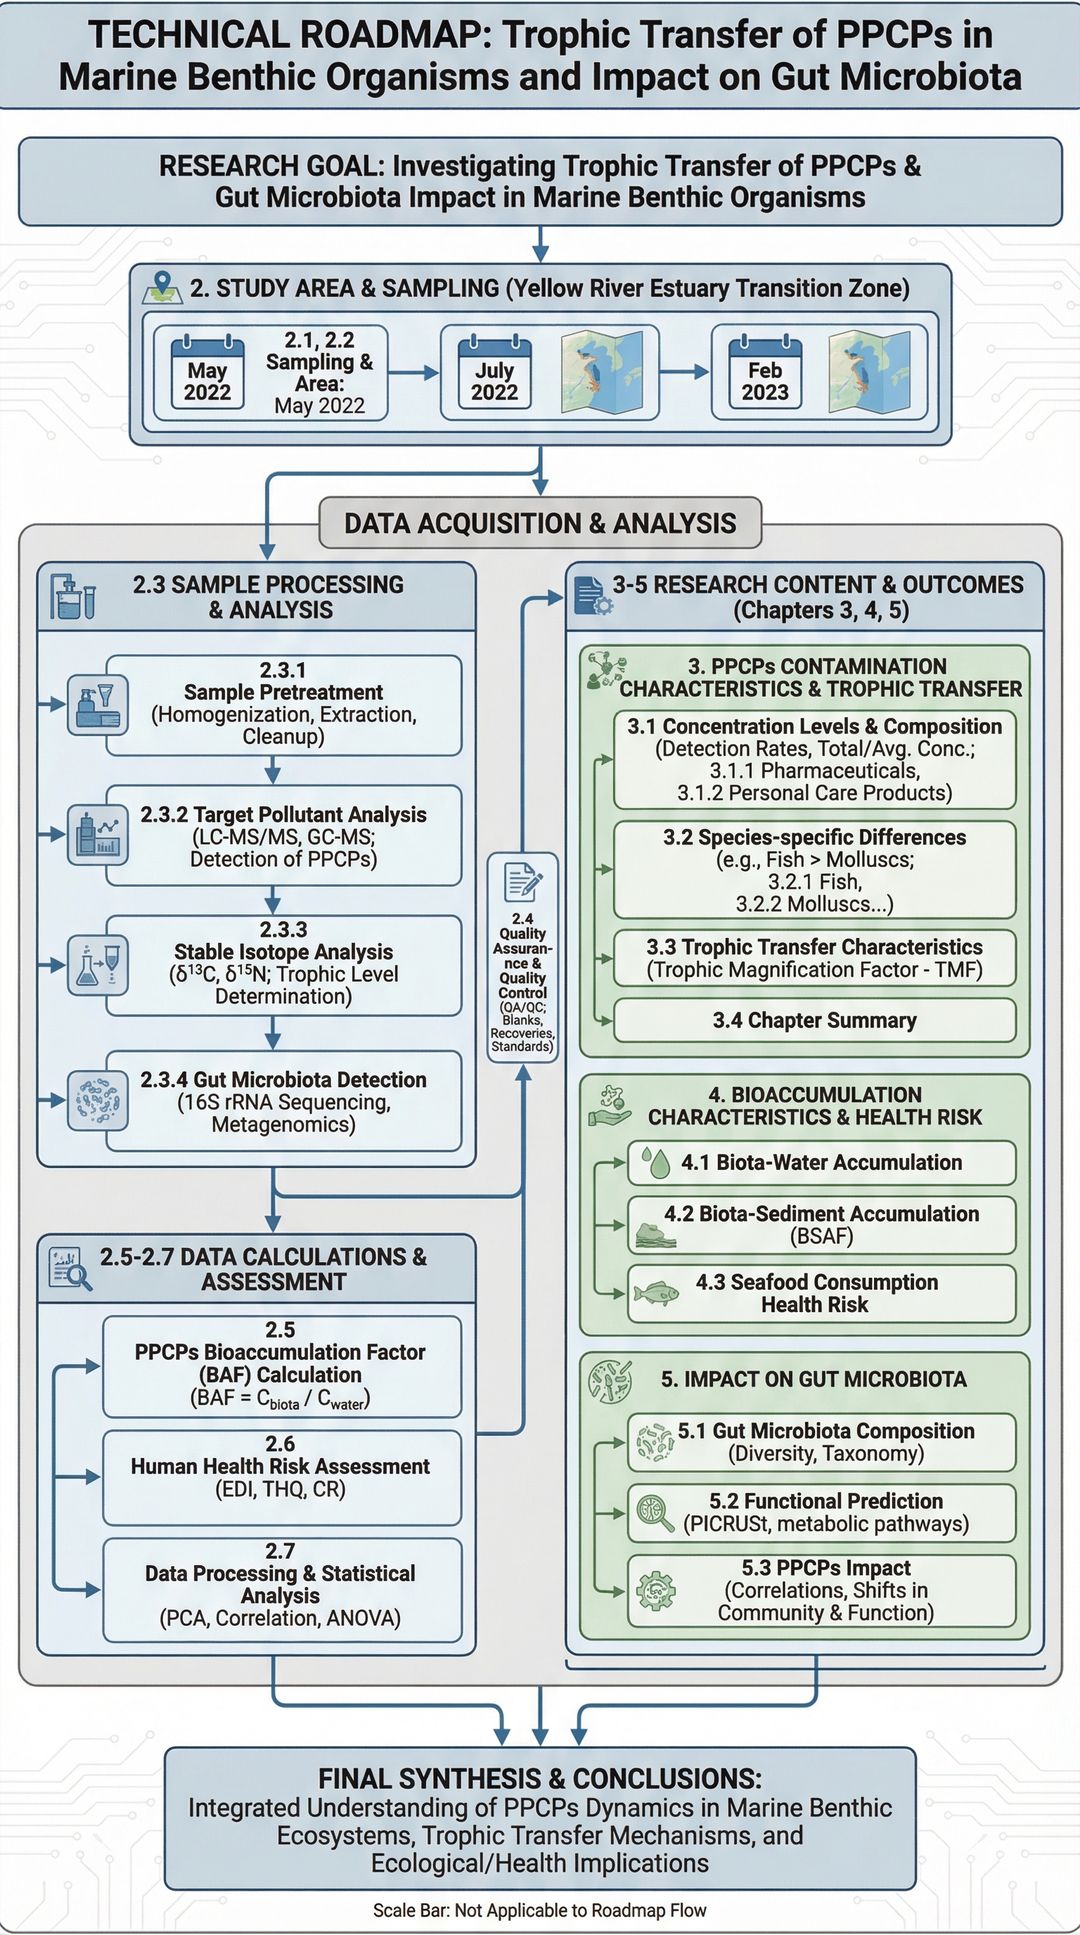
3.3 Ökologische Prozesse und Gesundheitsrisiken
Prompt: Rahmenwerk für ökologische und gesundheitliche Risiken von PPCPs
This study focuses on the ecological processes and health risks of emerging
contaminants, specifically pharmaceuticals and personal care products in aquatic
environments. Create a framework diagram showing:
- Source identification and quantification
- Environmental fate and transport
- Ecological toxicity pathways
- Human health risk assessment
- Regulatory framework and monitoring
Use a hierarchical or flow-based structure.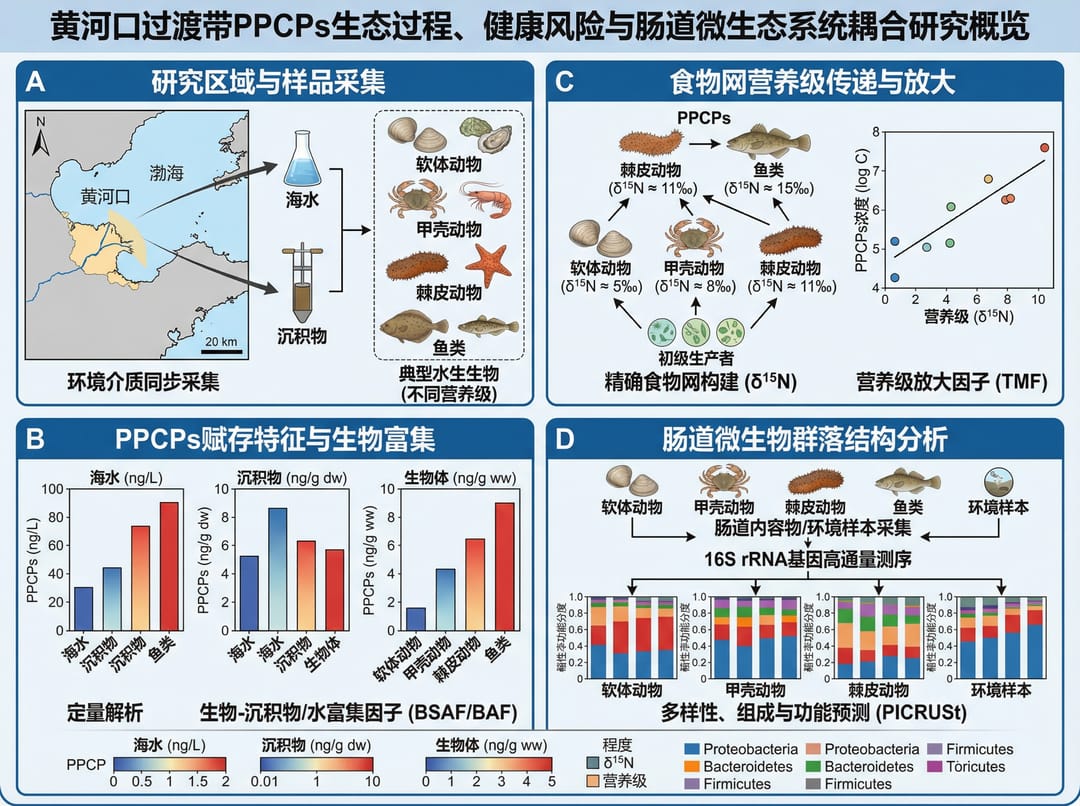
4. Regionale Umweltstudien
4.1 Ästuar-Ökosysteme
Prompt: Technologie-Roadmap für das Gelbe-Fluss-Ästuar
Generate a technology roadmap. This study focuses on the ecologically sensitive
Yellow River Estuary transition zone as a case study. Include:
- Study area characterization
- Research objectives and hypotheses
- Sampling and monitoring strategy
- Data analysis methods
- Expected outcomes and applications
- Timeline and milestones
Use a professional research roadmap format.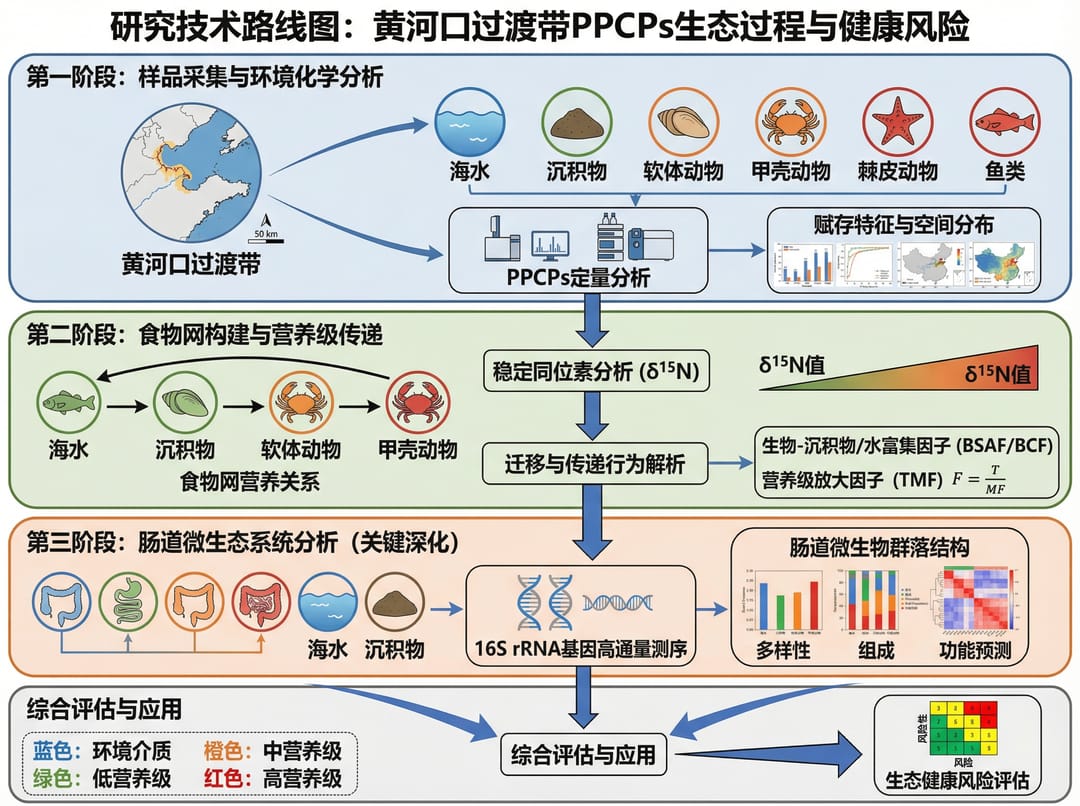
5. Problem-Lösungs-Rahmenwerke
5.1 Zirkuläre Infografiken
Prompt: Problemkaskade der Winderosion
Scientific illustration, circular infographic format.
Top Half: Problem Cascade illustrating the effects of wind erosion:
- Soil loss and degradation
- Nutrient depletion
- Vegetation damage
- Air quality impacts

Bottom Half: Solution Framework showing:
- Windbreak establishment
- Cover cropping
- Tillage management
- Monitoring and assessment
Use a professional circular infographic with clear visual hierarchy.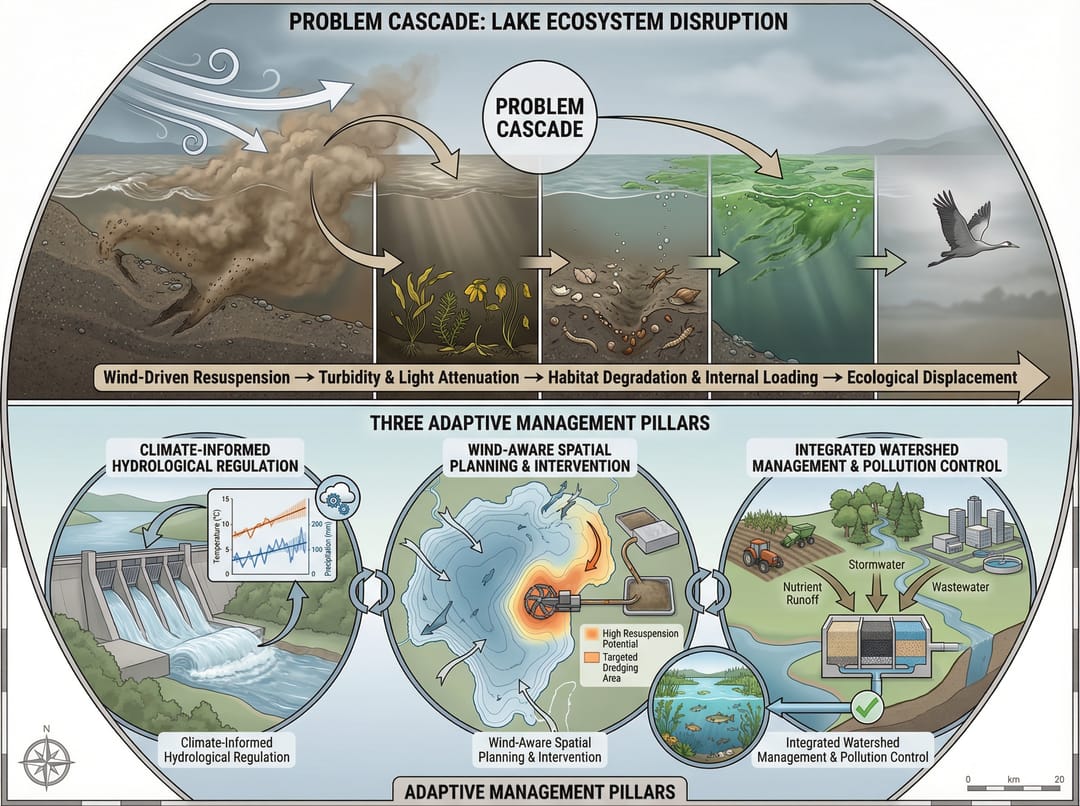
6. Infrastruktur und Nachhaltigkeit
6.1 Nutzung von Materialien für den Straßenunterbau
Prompt: Forschung zu Füllmaterialien für den Straßenunterbau
1.1 Research Significance
The efficient utilization of roadbed filling materials is a concrete
implementation of key transportation sustainability goals. Create a figure showing:
- Material sources (recycled, natural, industrial byproducts)
- Processing and treatment methods
- Performance requirements and testing
- Environmental benefits quantification
- Life cycle assessment framework
Use a research significance diagram style.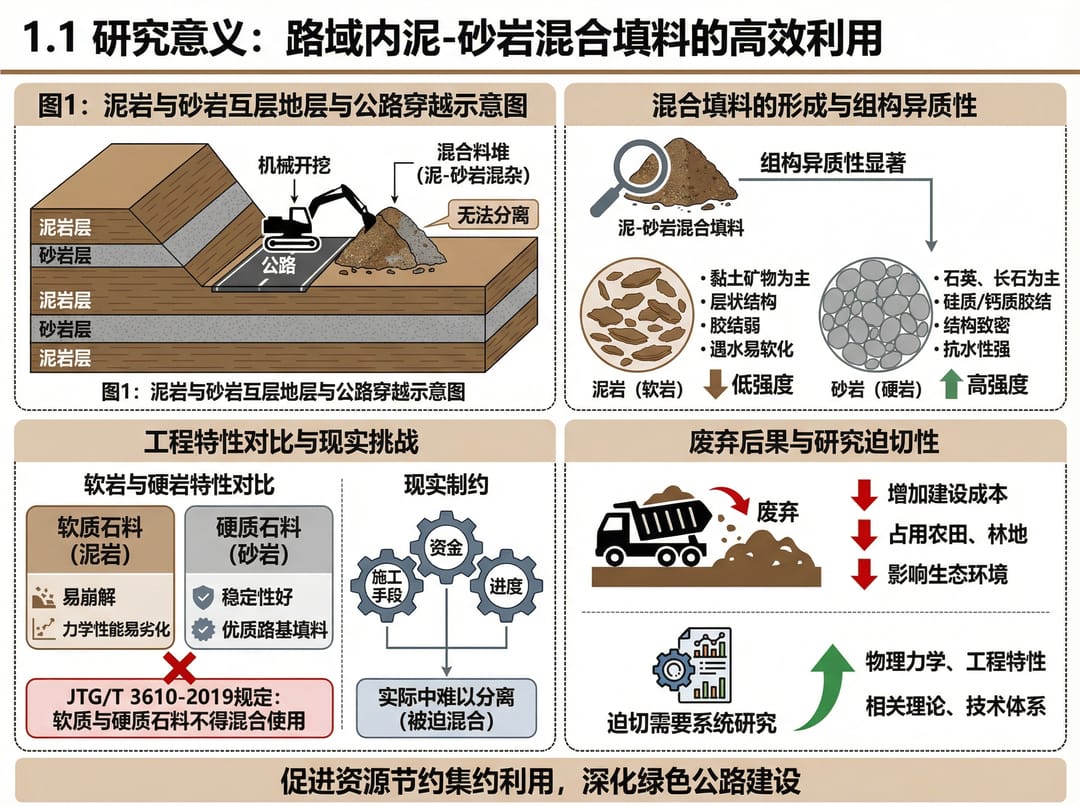
7. Best Practices für umweltwissenschaftliche Diagramme
Wichtige Elemente nach Diagrammtyp
| Diagrammtyp | Wesentliche Komponenten |
|---|---|
| Biogeochemische Kreisläufe | Speicher, Flüsse, Transformationsprozesse, mikrobielle Akteure |
| Schadstoffpfade | Quellen, Transportmedien, Rezeptoren, Expositionspfade |
| Ökosystemstudien | Trophische Ebenen, Energiefluss, Nährstoffkreislauf, Arteninteraktionen |
| Nachhaltigkeitsrahmenwerke | Inputs, Outputs, Rückkopplungsschleifen, Indikatoren |
Tipps für umweltwissenschaftliche Prompts
- Maßstab einbeziehen: Zeitlich (täglich, saisonal, jährlich) und räumlich (lokal, regional, global).
- Quantitative Daten zeigen: Flussraten, Konzentrationen, Prozentsätze.
- Unsicherheit angeben: Fehlerbalken, Konfidenzintervalle, wo anwendbar.
- Referenzstandards: EPA, WHO oder regionale regulatorische Schwellenwerte.
- Anerkannte Symbole verwenden: Standardsymbole für Prozesse und Kompartimente.
Beginnen Sie mit der Erstellung Ihrer umweltwissenschaftlichen Diagramme
Probieren Sie diese Prompts mit den KI-Illustrationswerkzeugen von SciDraw AI aus: