2025/11/08
實驗流程圖範例、類型與版面範本
比較常見實驗流程圖類型、參考實際範例,並重複使用適合方法學插圖、實驗方案與研究論文的版面範本。
比較常見實驗流程圖類型、參考實際範例,並重複使用適合方法學插圖、實驗方案與研究論文的版面範本。
如果你正在準備實驗流程圖、科研流程圖或論文流程圖,這篇指南會提供從結構設計到投稿排版的完整步驟。你可搭配 科研繪圖工具、AI科研繪圖 與 線上科研繪圖入口 快速完成可投稿版本。
審稿意見裡最傷人的一句,往往是:「方法讀不懂,實驗到底怎麼做的?」——你明明寫了兩頁,審稿人卻沒讀進去。方法部分光靠文字描述一套多步驟實驗,讀者得在腦中自己把時序拼出來;而一張實驗流程圖,等於把這道工替他做完了。這篇會講清楚:流程圖分哪幾種、怎麼排版才不會被審稿人挑毛病,以及怎麼用一段文字描述快速生成。工具可以直接用工作流程圖產生器。
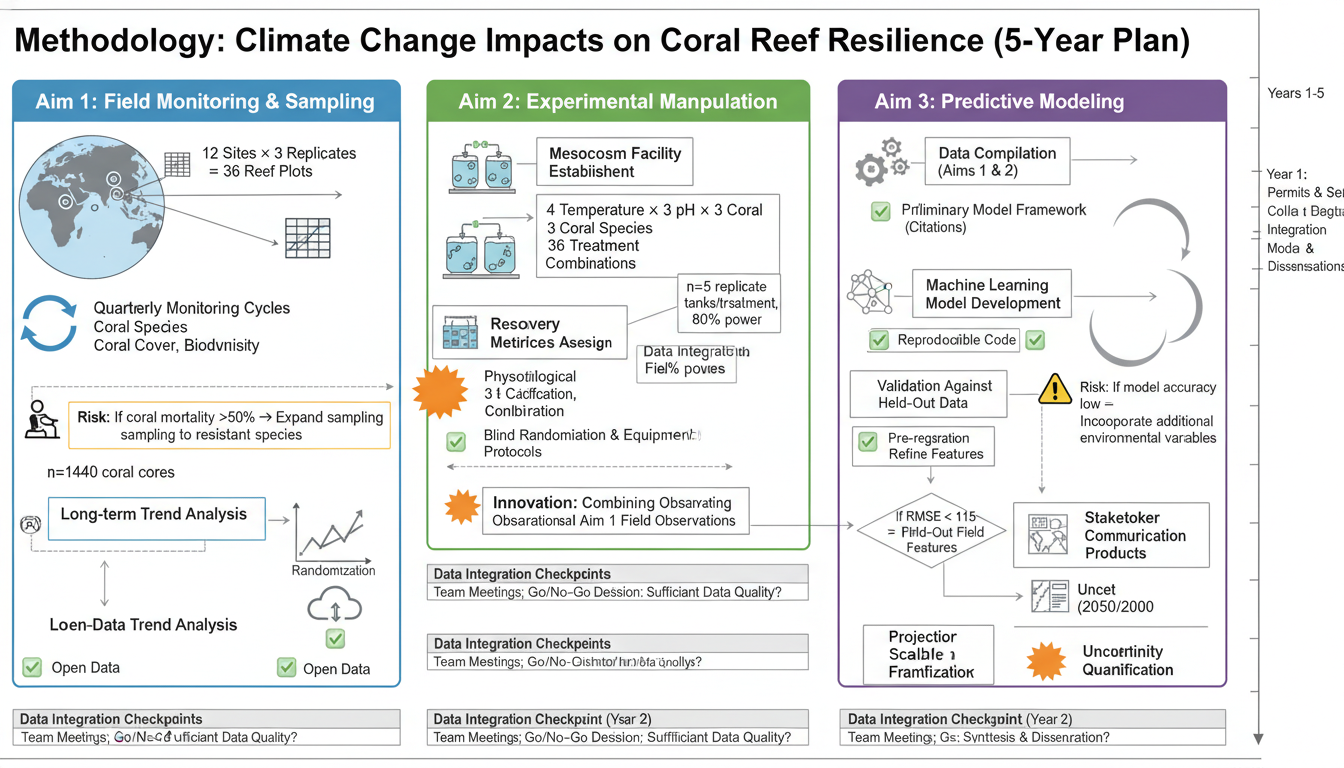 一張清楚的流程圖,能讓方法部分一眼看懂
一張好的實驗流程圖能抵半頁文字:讀者不必逐句讀方法就看得懂實驗時序,這直接關係到「可重現性」——別人照著你的圖能不能把實驗重跑一遍。審稿人讀得順,審查也更順;而方法清楚的論文,日後被引用時也更容易被人拿來對照。花一小時畫圖,省下的是審查來回裡反覆解釋「我到底做了什麼」的時間。
簡單的逐步流程:
Step 1 → Step 2 → Step 3 → Step 4 → Result最適合:具有清晰進展的簡單協議
具有決策點或平行路徑的流程:
        → Path A →
Start →            → Result
→ Path B →最適合:具有條件或多個樣本類型的方法
迭代或回饋流程:
Step 1 → Step 2 → Step 3
   ↑                 ↓
←←←← Repeat ←←←←←最適合:優化程序、迭代分析
具有不同階段的複雜流程:
[Sample Prep] → [Treatment] → [Analysis] → [Data Processing]最適合:多日協議、複雜的實驗設計
推薦模式:
避免:
包含:
排除:
細胞培養實驗:
Experimental workflow for cell biology,
cell seeding → treatment (24h) → harvest → analysis,
specific cell line "HeLa" indicated,
treatment conditions "Drug X, 10 μM" labeled,
timeline bar below showing days,
analysis methods: "Western blot, qPCR, Flow cytometry",
life sciences publication style
動物研究工作流程:
In vivo experiment workflow diagram,
animal model → treatment groups → intervention → endpoints,
"C57BL/6 mice, n=10/group" indicated,
treatment arms shown in parallel,
sacrifice time points marked,
tissue collection and analysis specified,
preclinical research style
分子生物學協議:
Molecular cloning workflow,
PCR amplification → gel extraction → ligation → transformation,
vector and insert icons,
colony screening step,
sequence verification endpoint,
molecular biology methods figure style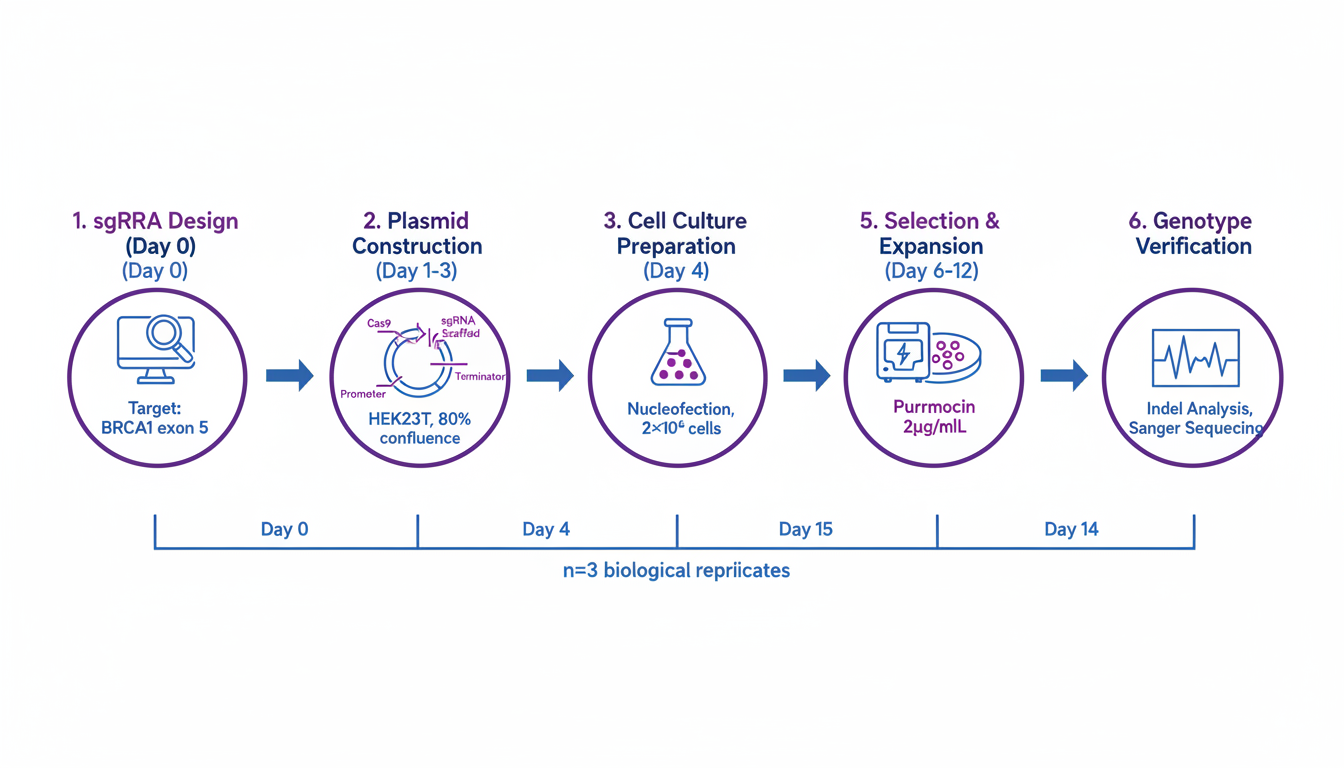 分子生物學工作流程受益於圖示表示
合成工作流程:
Multi-step synthesis workflow diagram,
starting material → intermediate 1 → intermediate 2 → product,
reaction conditions above each arrow,
purification methods noted (column, recrystallization),
yield percentages at each step,
organic chemistry methods style
分析協議:
Analytical chemistry workflow,
sample collection → preparation → measurement → data analysis,
specific techniques labeled,
quality control steps included,
instrument parameters noted,
analytical methods figure format材料合成:
Nanomaterial synthesis workflow,
precursor preparation → reaction → purification → characterization,
reaction conditions (temperature, time, atmosphere),
characterization techniques listed,
scale indicated,
materials science methods style
設備製造:
Device fabrication workflow diagram,
substrate preparation → deposition → patterning → testing,
layer-by-layer steps shown,
equipment/techniques at each step,
cleanroom requirements noted,
engineering methods figure format臨床試驗工作流程:
Clinical study workflow diagram,
patient screening → enrollment → randomization → intervention → follow-up,
inclusion/exclusion criteria summarized,
treatment arms in parallel,
assessment time points marked,
CONSORT-style diagram elements
樣本處理:
Biospecimen processing workflow,
collection → transport → processing → storage → analysis,
sample types indicated,
time constraints noted,
temperature requirements shown,
biobank protocols styleExperimental workflow diagram for [field] research,
[number] main steps: [list steps],
left to right flow with arrows,
icons representing each major step,
key parameters labeled,
timeline indicated below,
publication-ready methods figure styleDetailed experimental protocol workflow,
[your experiment type] methodology,
Step 1: [description with parameters],
Step 2: [description with parameters],
[continue for all steps],
critical steps highlighted,
QC checkpoints marked,
reproducibility-focused designComparative experimental workflow showing two methods,
Method A (left/top) vs Method B (right/bottom),
shared steps in center,
differences highlighted with color,
time/cost comparison indicated,
methods comparison figure styleHigh-throughput screening workflow diagram,
library/sample input → primary screen → hit identification,
secondary validation → lead selection,
numbers at each stage (e.g., "10,000 → 500 → 50 → 5"),
funnel visualization style,
drug discovery/screening format常見的工作流程圖示:
使用圖示來:
功能顏色:
階段顏色:
箭頭類型:
最佳實踐:
┌────────┐    ┌────────┐    ┌────────┐    ┌────────┐
│ Step 1 │───→│ Step 2 │───→│ Step 3 │───→│ Step 4 │
└────────┘    └────────┘    └────────┘    └────────┘
Day 0 Day 1 Day 3 Day 7 ┌────────┐
────→│ Path A │────┐
┌────────┐ │ └────────┘ │ ┌────────┐
│ Start │────┤ ├───→│ Result │
└────────┘ │ ┌────────┐ │ └────────┘
────→│ Path B │────┘
└────────┘┌─────────────────────────────────────────────────────┐
│ Phase 1: Setup │
│ ┌──────┐ ┌──────┐ ┌──────┐ │
│ │ Prep │──→│ Treat│──→│ Check│ │
│ └──────┘ └──────┘ └──────┘ │
└─────────────────────────────────────────────────────┘
↓
┌─────────────────────────────────────────────────────┐
│ Phase 2: Analysis │
│ ┌──────┐ ┌──────┐ ┌──────┐ │
│ │Collect│──→│Analyze│──→│Report│ │
│ └──────┘ └──────┘ └──────┘ │
└─────────────────────────────────────────────────────┘問題:包含每個次要步驟 解決方案:總結常規步驟;僅詳細說明關鍵點
問題:讀者無法跟隨流程 解決方案:使用清晰的箭頭;保持一致的方向
問題:省略重要參數 解決方案:包括時間、溫度、濃度
問題:混合圖示、字體、顏色 解決方案:建立樣式指南;始終如一地應用
問題:對於受眾來說太簡單或太複雜 解決方案:使詳細程度與讀者的專業知識相匹配
使用清晰的工作流程圖轉換您的方法部分:
您的方法值得以視覺化方式呈現,使其立即易於理解。
實驗流程圖聚焦單次實驗或方法學步驟,技術路線圖聚焦整體研究階段與節點。可在 科研繪圖工具 先分別建構再統一風格。
建議至少包含關鍵步驟、輸入輸出、重要參數與決策節點。若不確定層級,可先在 線上科研繪圖 生成草稿。
先在 AI科研繪圖 建立主架構,再依期刊要求微調字體、配色與尺寸即可。
相關文章:

Researcher
Davie Chen is a researcher at the Faculty of Animation and Intermedia, University of Arts in Poznan, studying generative AI for scientific figure creation, patent illustration, and manuscript drafting. SciDraw AI is one of the research-to-product tools built from this work.
Author profile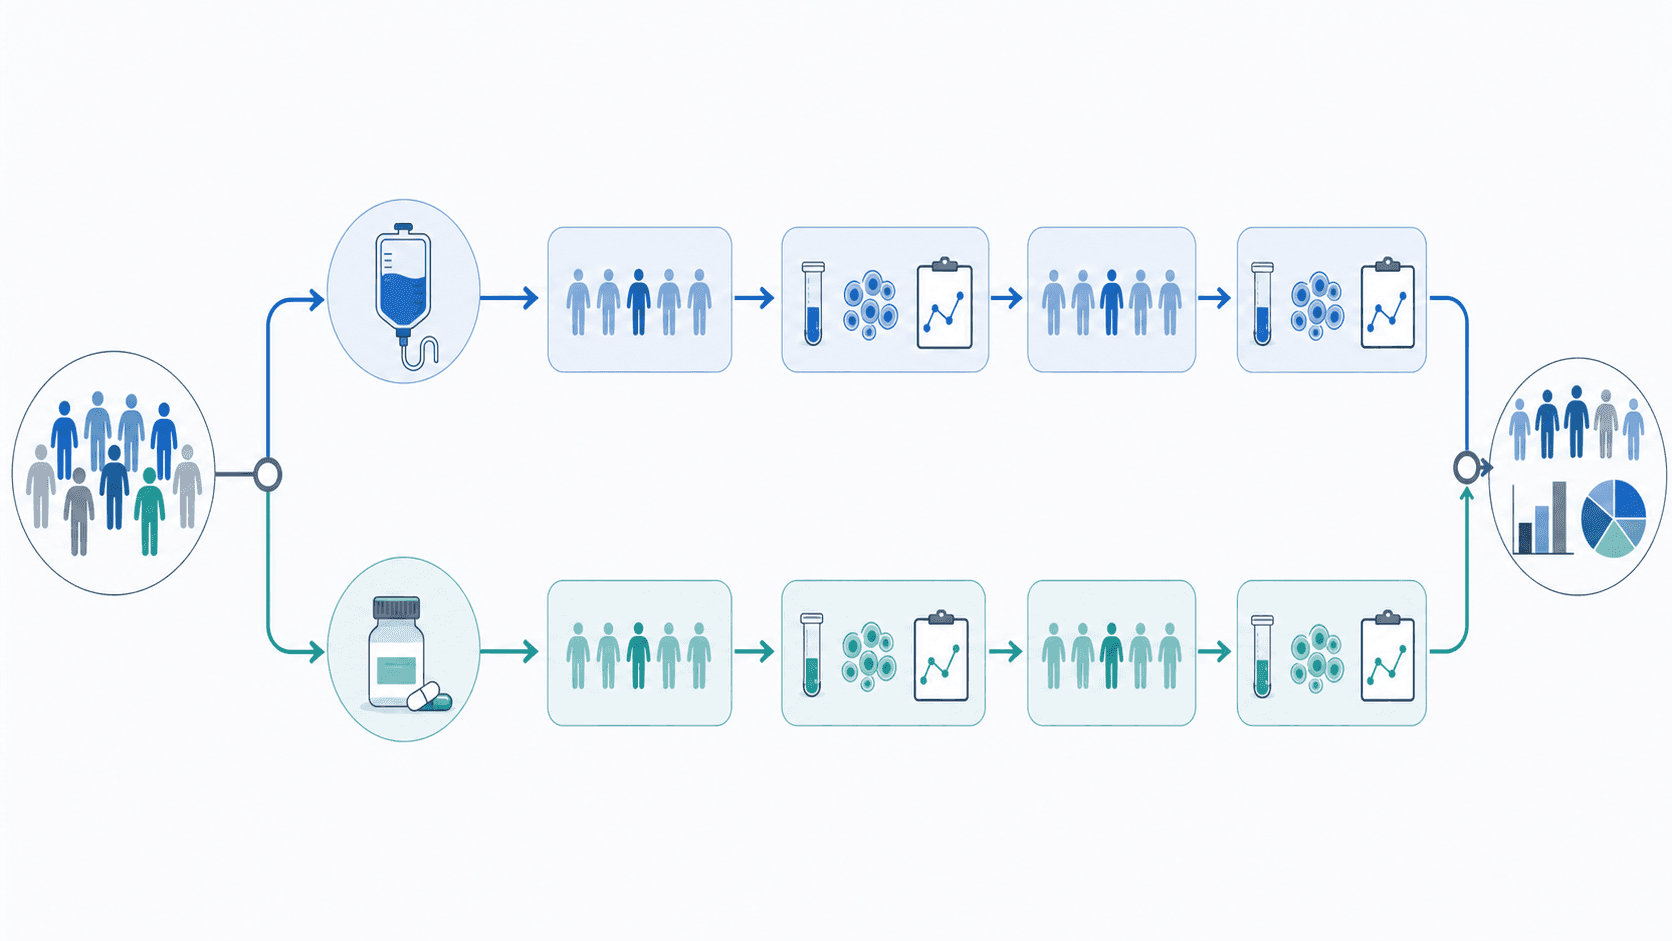
A step-by-step guide to designing a clear experimental workflow diagram for a research paper — what to include, a reusable layout, common mistakes, and a checklist.
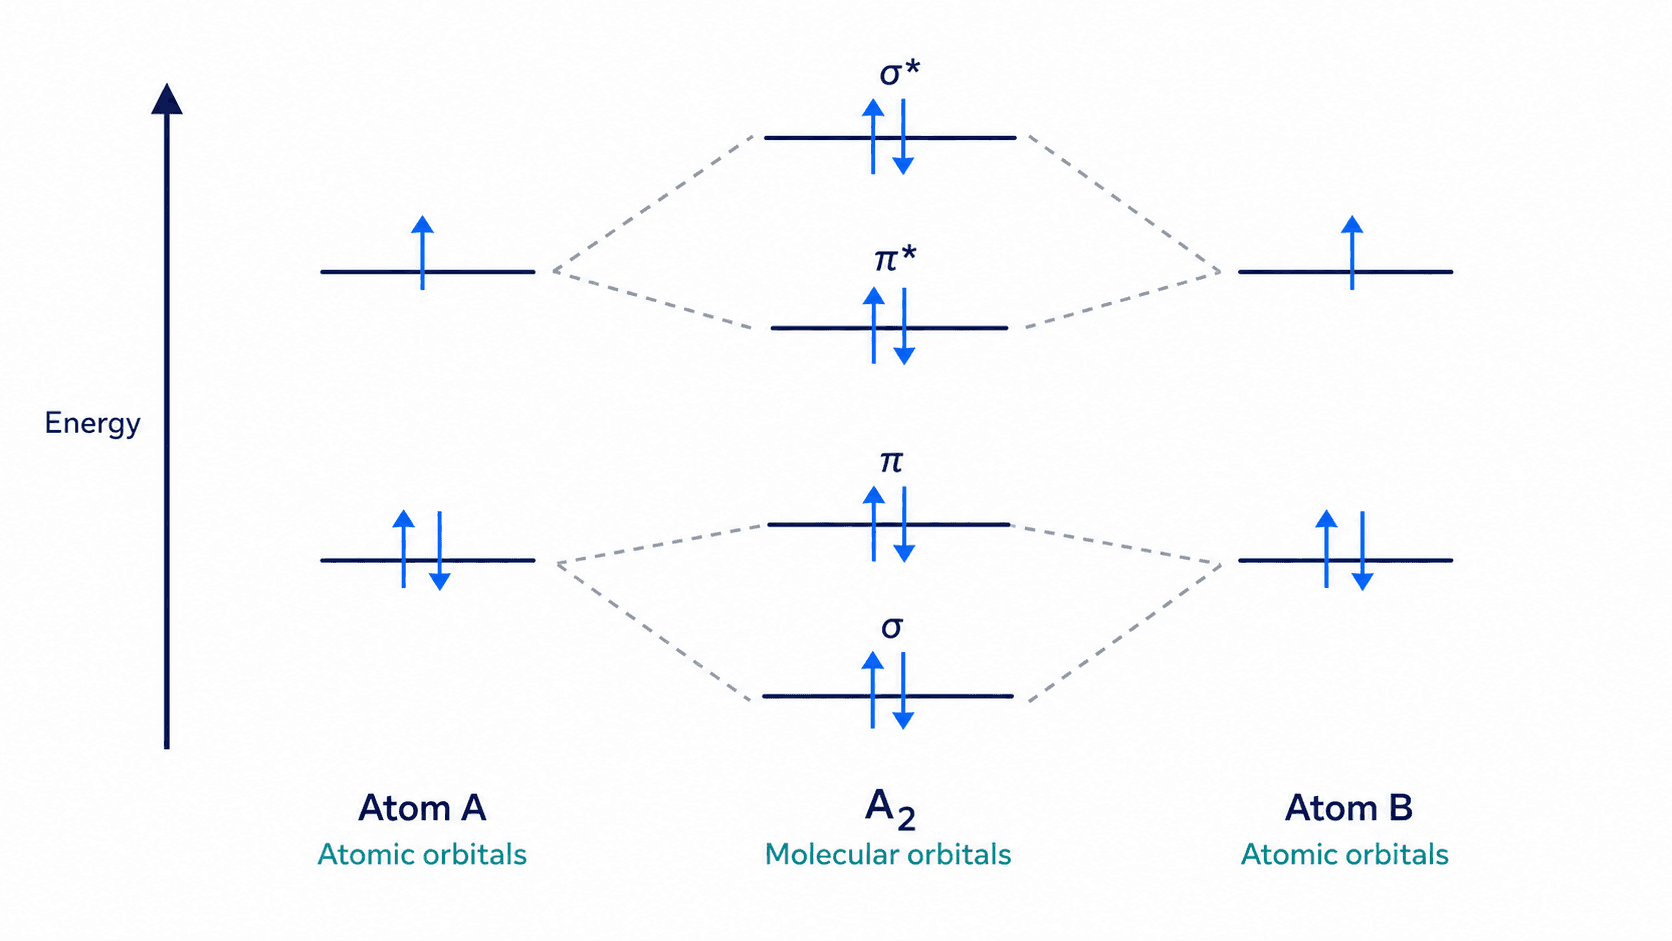
手把手教你畫分子軌域(MO)能階圖:鍵結與反鍵結軌域的差別、電子填入順序規則、鍵級計算方法,以及 O₂ 與 N₂ 的完整繪製範例,逐步拆解每個環節,適合物理化學課程學習、作業練習與考試複習時對照參考使用。
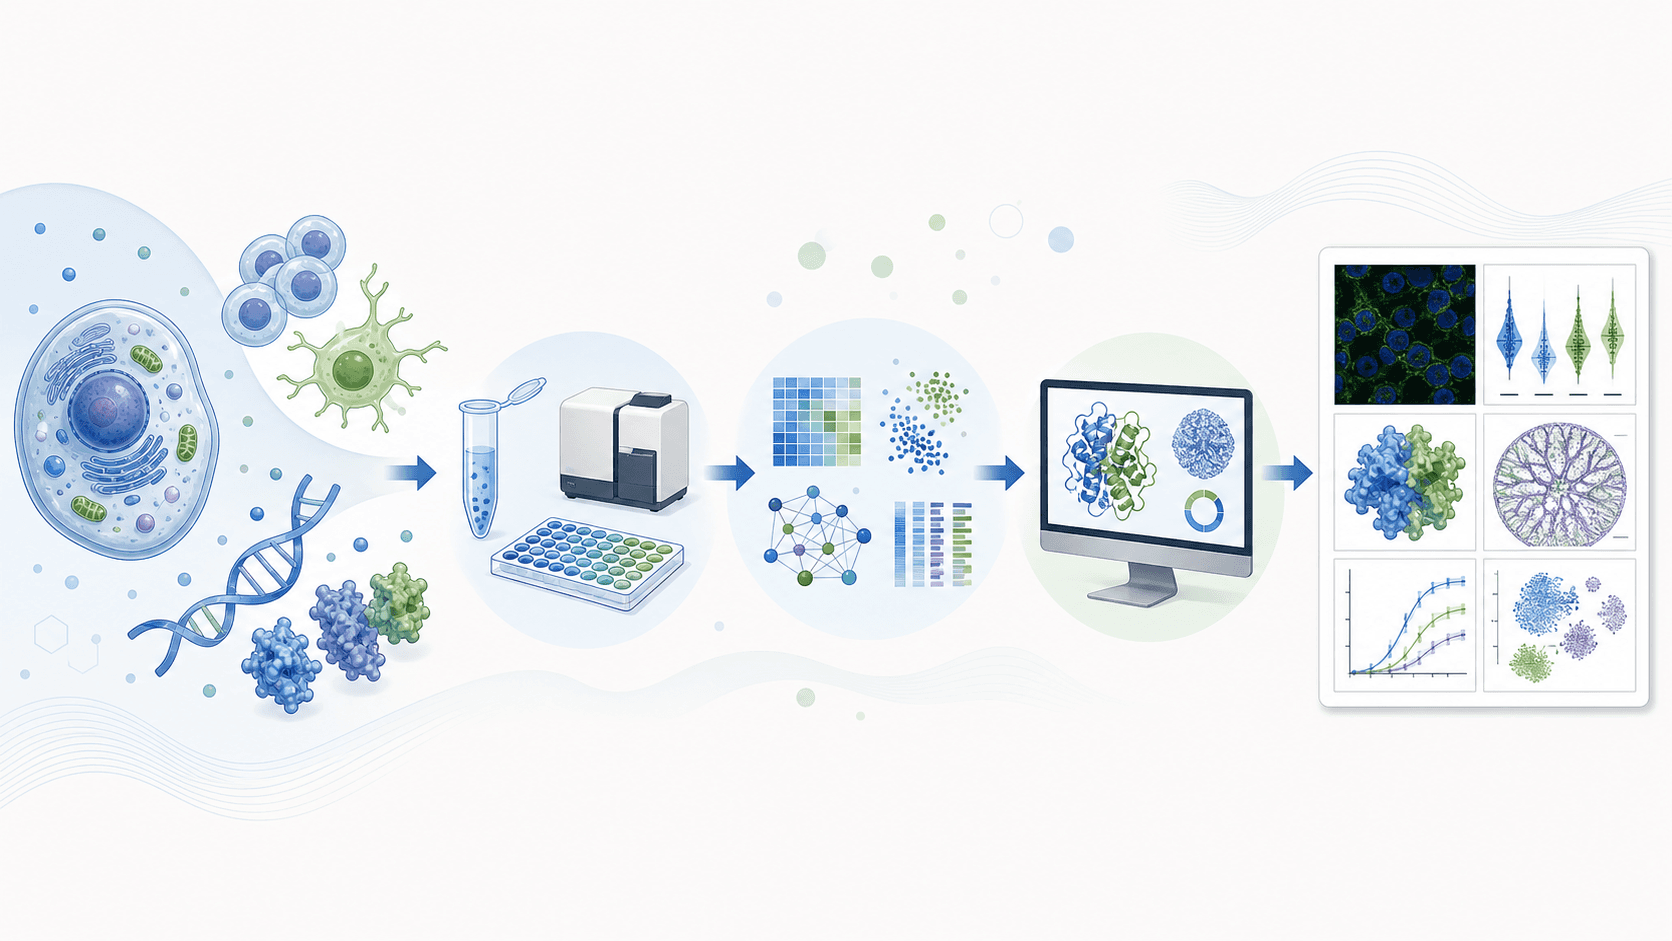
同一篇生物醫學論文裡的細胞圖、訊號通路圖、實驗流程圖要怎麼統一視覺風格——把圖拆成背景層、機制層、實驗層三個層次,再用結構化 prompt 生成可繼續修改的初稿。附細胞對比圖與機制圖的完整 prompt 範本。