Swimlane Diagram Maker
Cross-functional flowcharts from a written process
List the roles and write the steps each one performs, such as an expense claim, an order or an approval. SciDraw AI draws one horizontal lane per role, places every step in the lane of whoever does it, and connects them with arrows that cross lanes at each handoff.
Swimlane Diagram Examples
Click an example to load its description.
What does this swimlane diagram maker do?
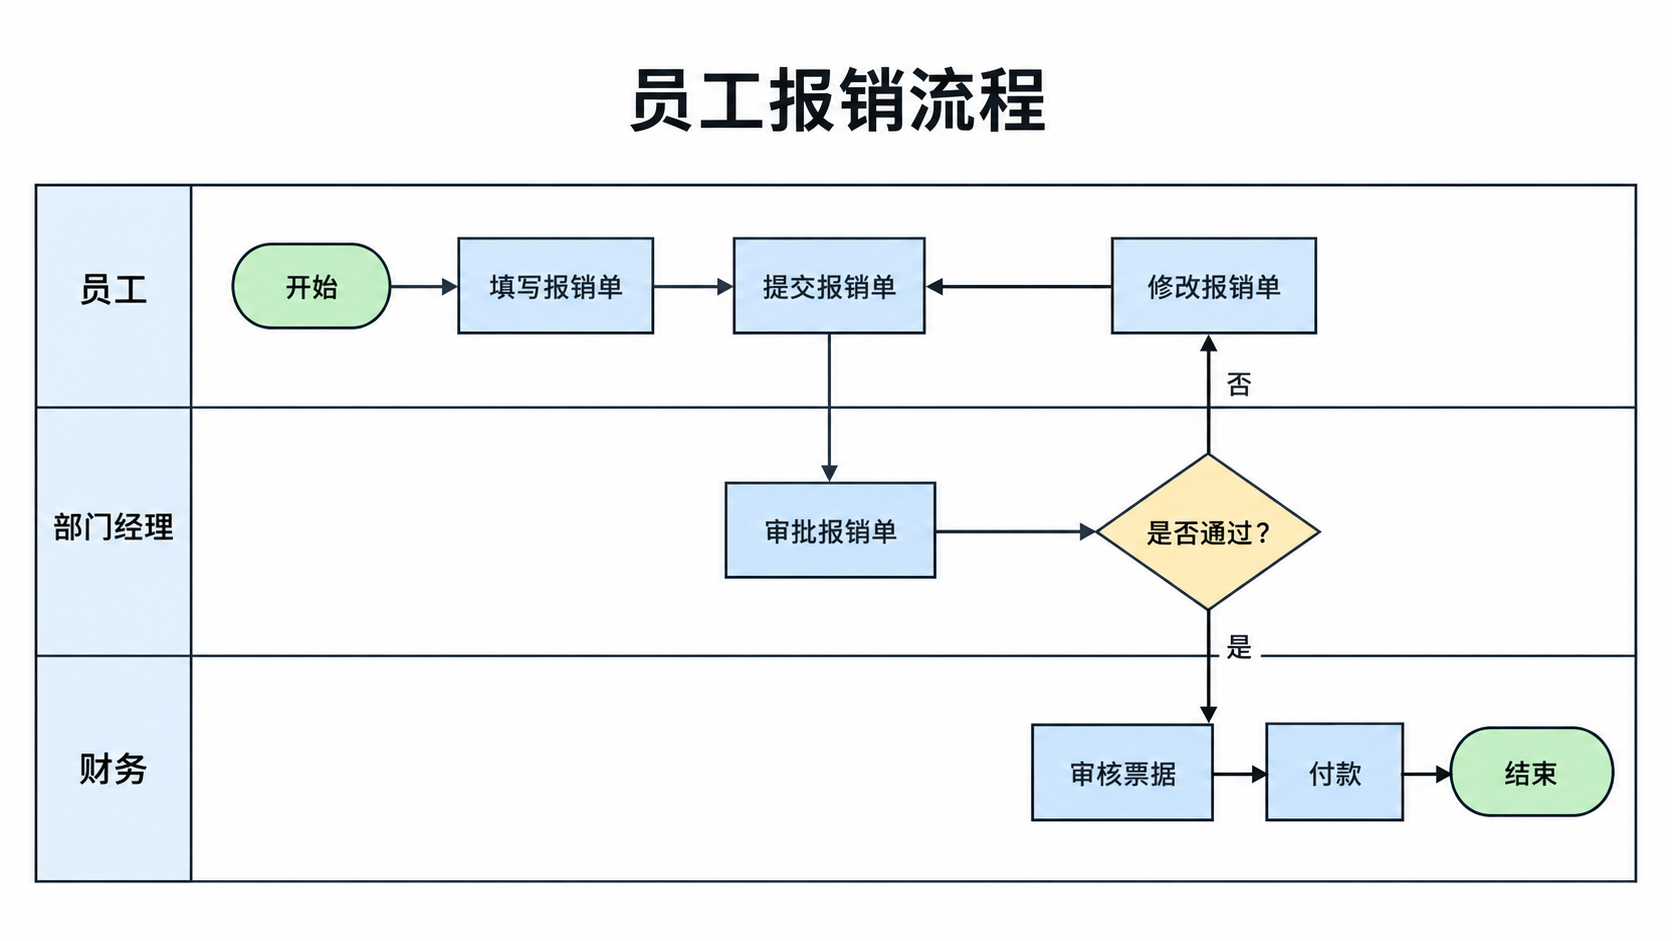
It draws a swimlane diagram, also called a cross-functional flowchart, from a written process. Each role gets one horizontal lane in the order you list them, with the role name in a header cell on the left. Every step sits in the lane of the role that performs it; start and end are rounded shapes, steps are rectangles and decisions are diamonds with each branch labelled. Arrows follow the order you describe and cross lanes when the work changes hands. Use it for requirement documents, SOPs, process improvement reports and the business process diagrams in a thesis.
Why swimlane diagrams help
- They show who is responsible for each step, which an ordinary flowchart leaves out.
- Every arrow that crosses a lane is a handoff, so delays, repeated approvals and unclear ownership are easy to spot.
- Requirement documents, SOPs and software-engineering theses commonly describe each business process with one swimlane diagram.
How to draw a swimlane diagram
First decide where the process starts and ends, then list the roles that take part: people, departments or systems. Each role becomes one lane; put them in the order the work usually passes through them. Next write the steps in sequence and say who performs each one, using a short verb phrase such as "Approve request". For every decision, write it as a yes/no question and state where each branch goes, including any loop back to an earlier step. Draw start and end as rounded shapes, steps as rectangles and decisions as diamonds, and let an arrow cross a lane border whenever the work is handed over. Keep one diagram to about ten steps; split longer processes.
Elements of a swimlane diagram
- Lane: a horizontal band for one role, department or system, with its name in a header cell on the left.
- Start and end: rounded shapes that mark where the process begins and finishes.
- Step: a rectangle with a short verb phrase, placed in the lane of the role that performs it.
- Decision: a diamond holding a question, with each outgoing branch labelled, for example Yes and No.
- Flow arrow: shows the order of steps; an arrow that crosses a lane border is a handoff between roles.
Frequently Asked Questions
What should I include in the description?
The lanes in order, then every step with the role that performs it, for example "Finance: Check receipts -> Make payment". For each decision, give the question and say where the Yes and No branches lead. The generator draws only what you list.
How many lanes and steps can one diagram hold?
Three or four lanes with up to about ten steps and one or two decisions stay readable. For a longer process, split it into stages and draw one swimlane diagram per stage.
What is the difference between a swimlane diagram and a flowchart?
A flowchart shows the steps and their order. A swimlane diagram shows the same flow divided into lanes, so it also shows who performs each step and where the work passes from one role to another. That is why it is also called a cross-functional flowchart.
Is the generated diagram always correct?
It follows your description closely, but check before you submit that each step is in the right lane, that the arrows point the right way and that the decision branches are labelled correctly. If one step is wrong, regenerate or fix it in the editor.
Can I edit the diagram afterwards?
Yes. Download it as a high-resolution PNG, or open it in the editor to keep refining it. From the editor you can convert it to an SVG vector file (10–15 credits), a PowerPoint PPTX file (10 credits) or a Visio file (20 credits).
How many credits does it cost?
Each diagram uses 5 credits at 2K. A free account gets 10 credits at sign-up and 5 more every day; paid plans and credit packs add more. See the pricing page for current plans.
Draw your swimlane diagram now
Write who does what in plain language and get a clean cross-functional flowchart.