Blog
Ultime notizie e aggiornamenti dal nostro team
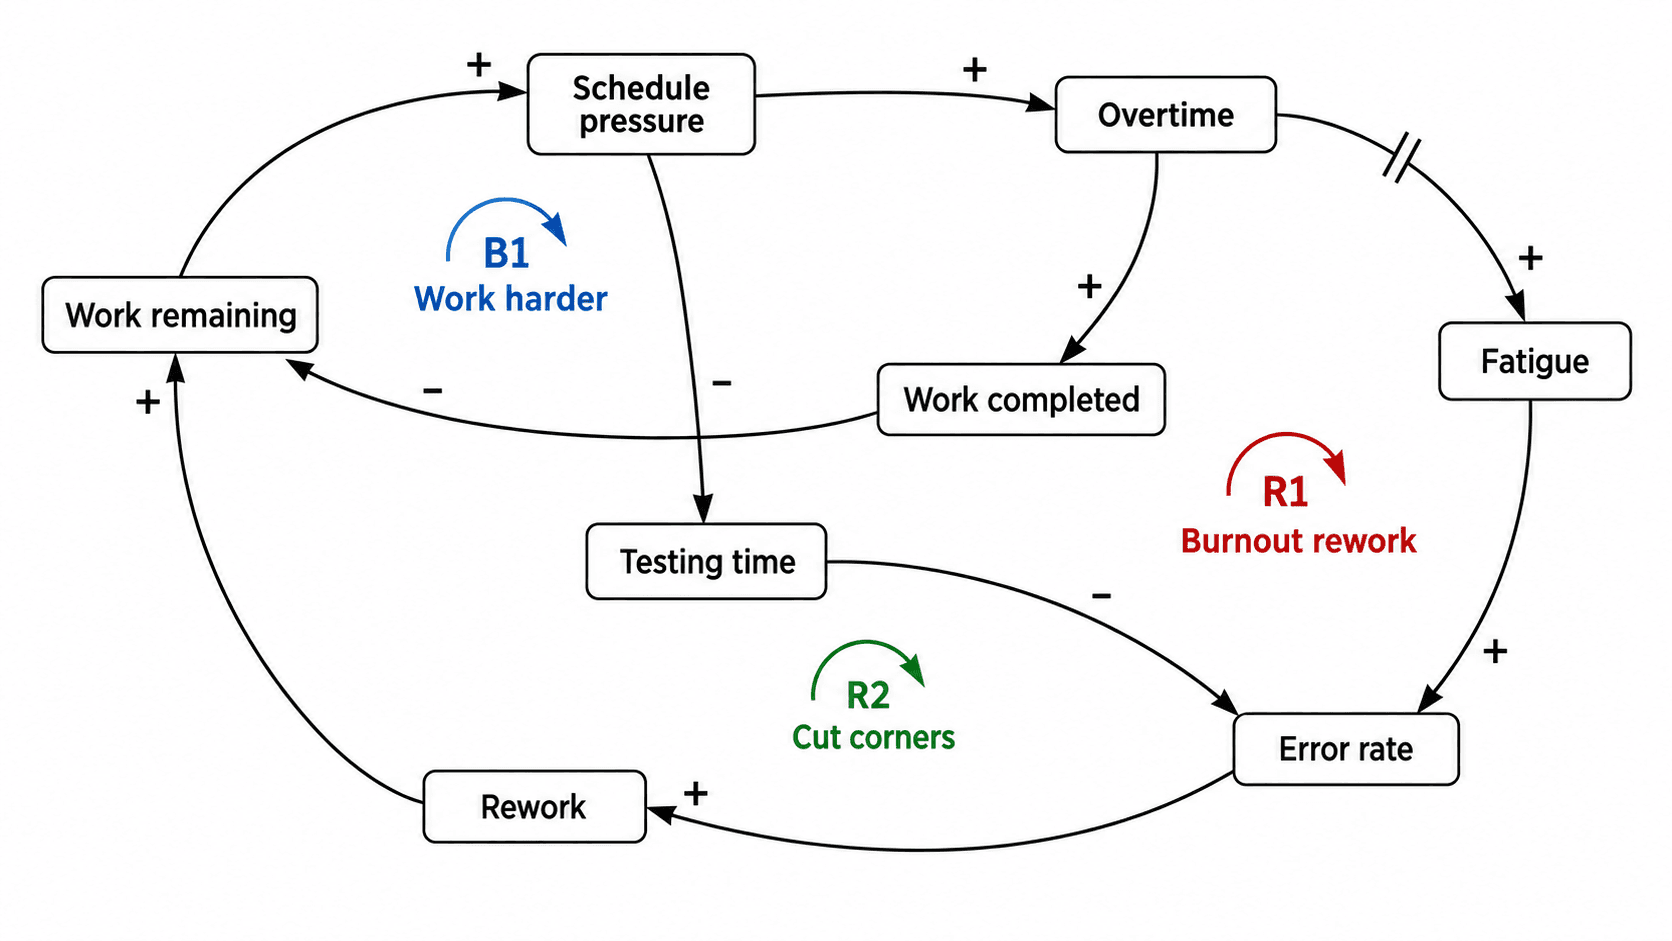
How to Draw a Causal Loop Diagram: Polarity, Reinforcing and Balancing Loops (2026)
A practical guide to causal loop diagrams for system dynamics: choosing variables, assigning + and − polarity, telling reinforcing from balancing loops, marking delays, and writing the loops up in a thesis.

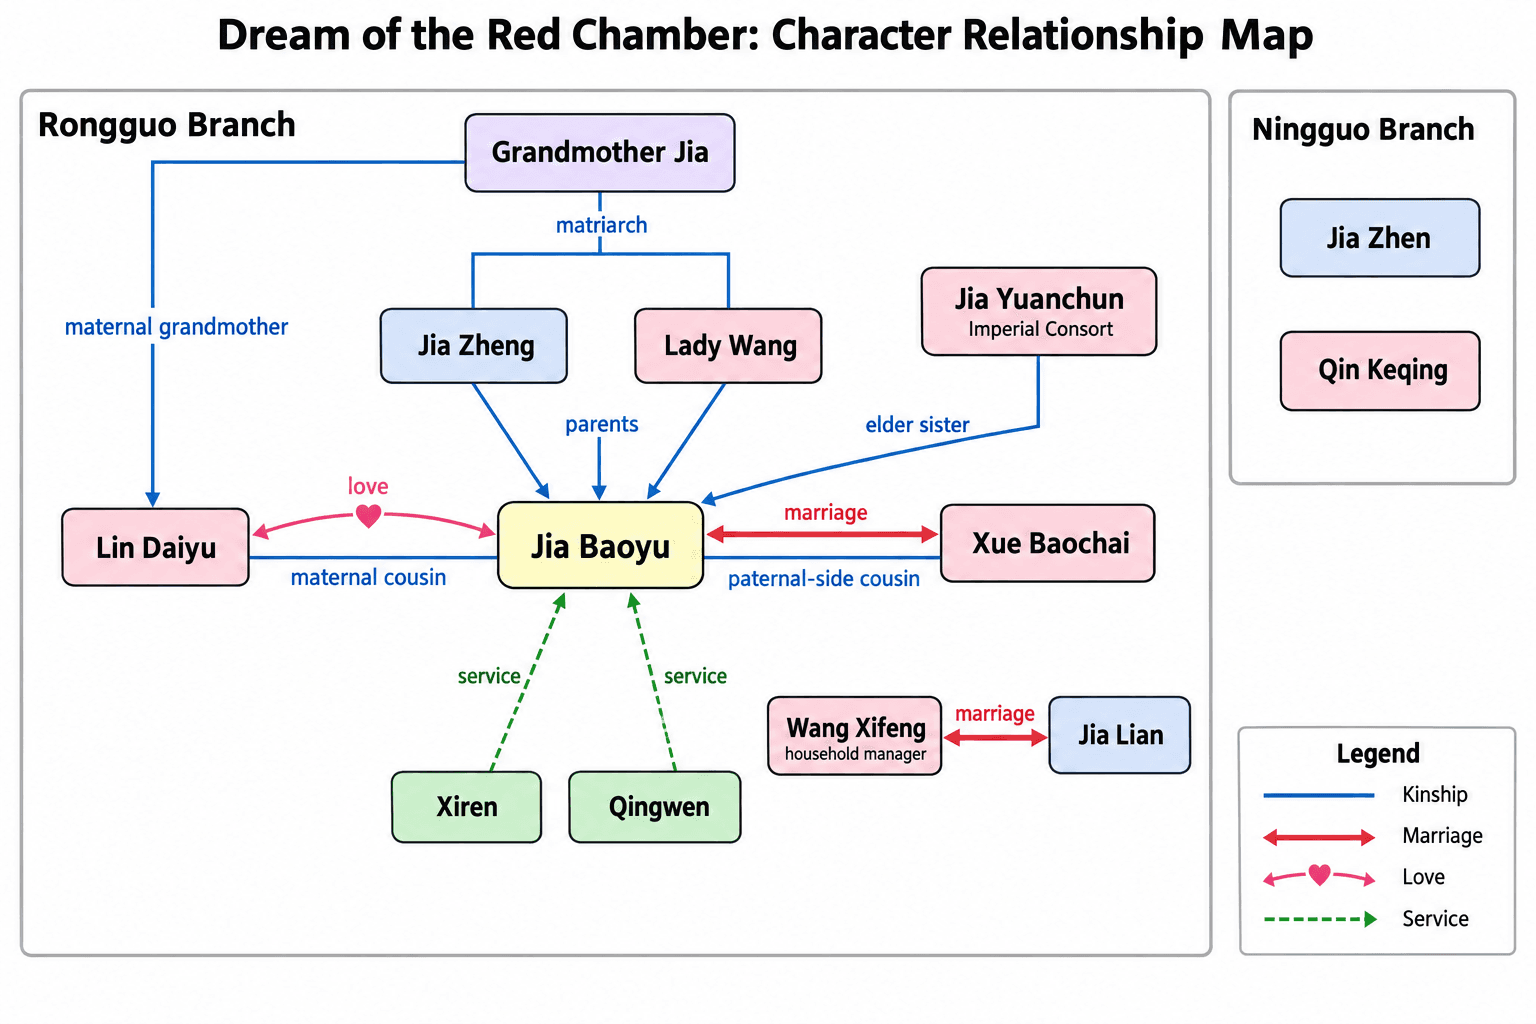
How to Make a Character Relationship Map for a Literature or History Thesis (2026)
How to make a character relationship map for a novel, play, history or film thesis: required elements, a cited relationship table, Pride and Prejudice and Hamlet examples, common mistakes, captions, and AI drafts.
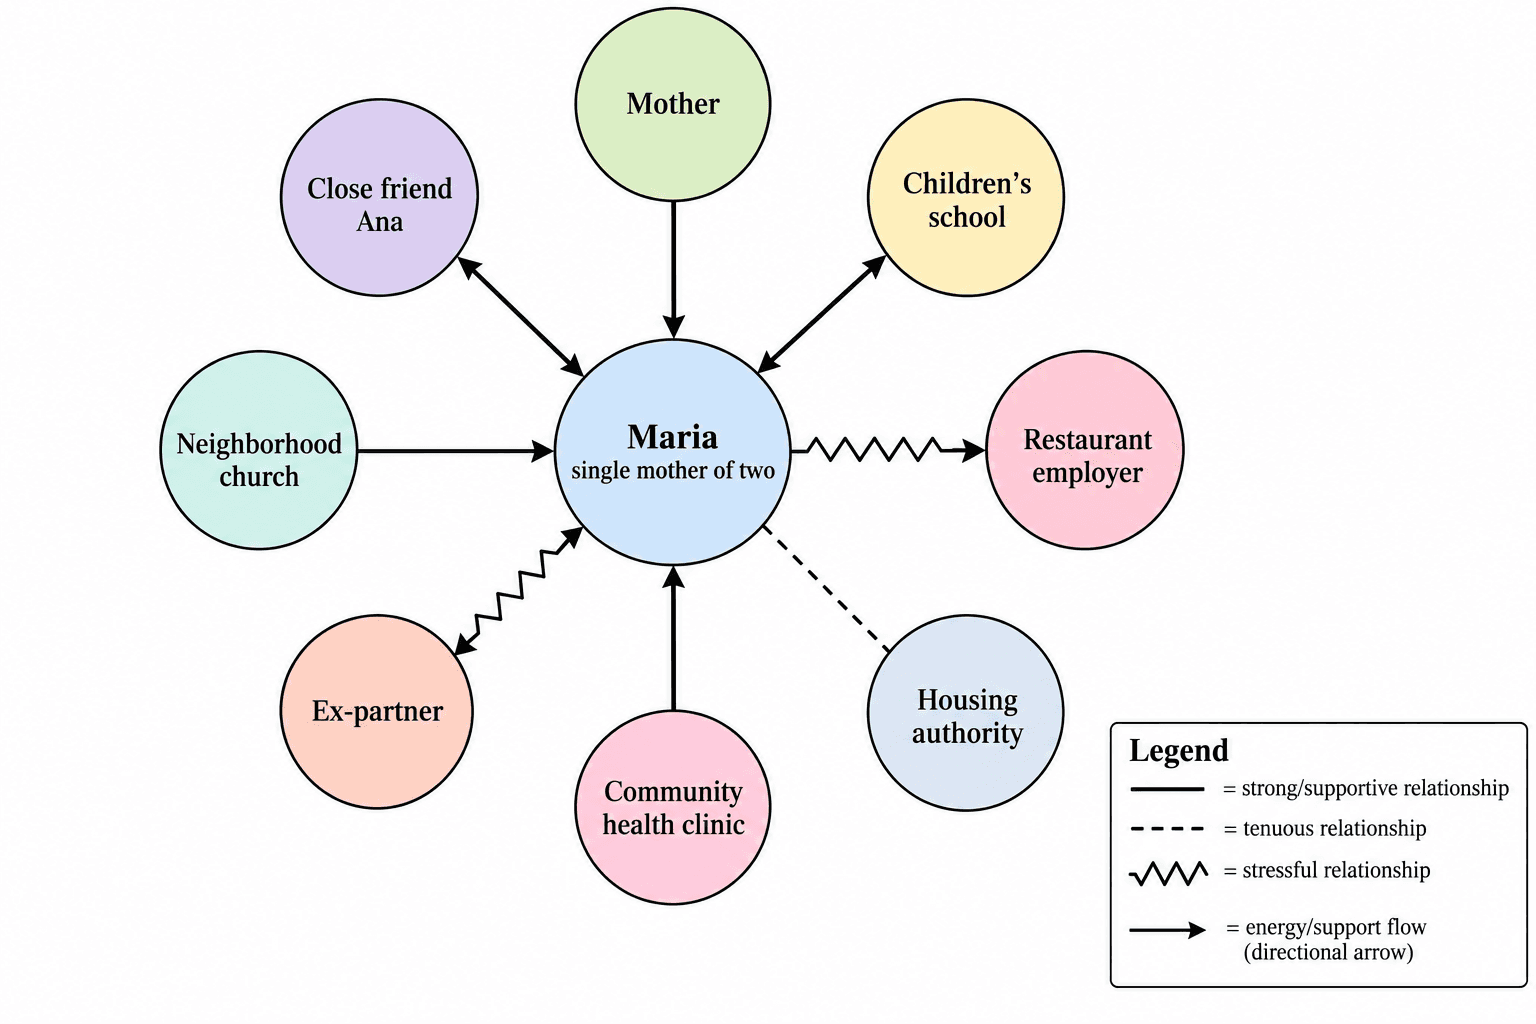
How to Make an Ecomap: Social Work and Nursing Case Assessment (2026)
How to make an ecomap for social work and nursing assessment: line conventions, the legend, ecomap vs genogram, anonymization, and two worked examples.
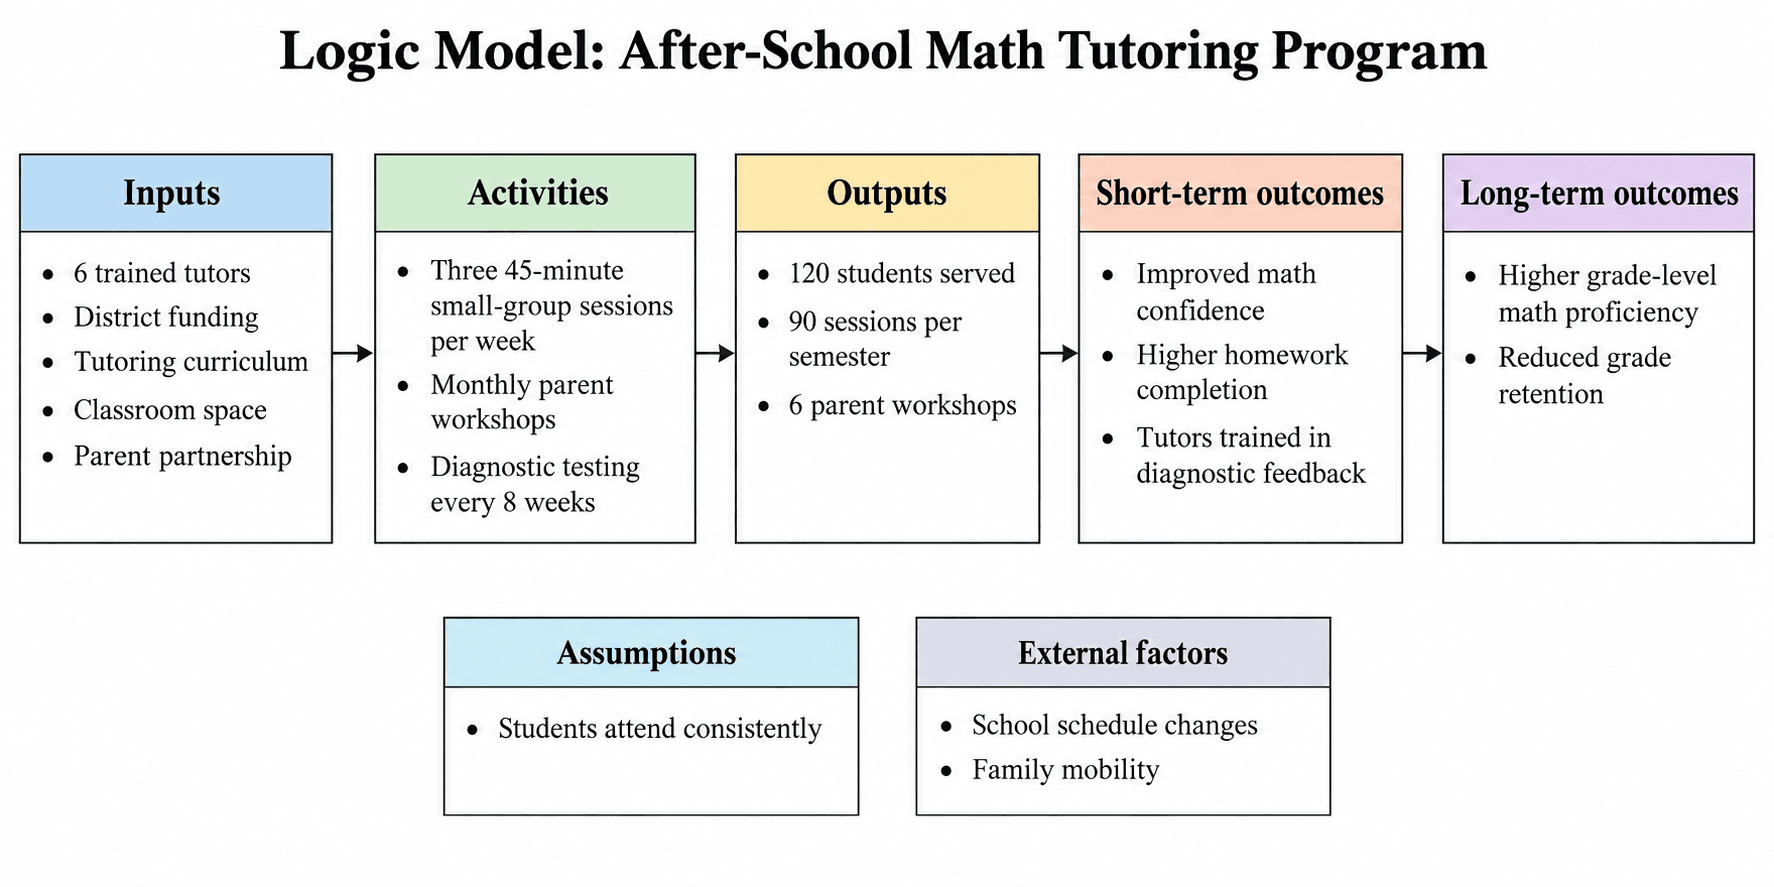
How to Create a Logic Model: Inputs, Activities, Outputs and Outcomes (2026)
How to create a program logic model: the five columns, where assumptions and external factors go, outputs versus outcomes, and a worked logic model example.
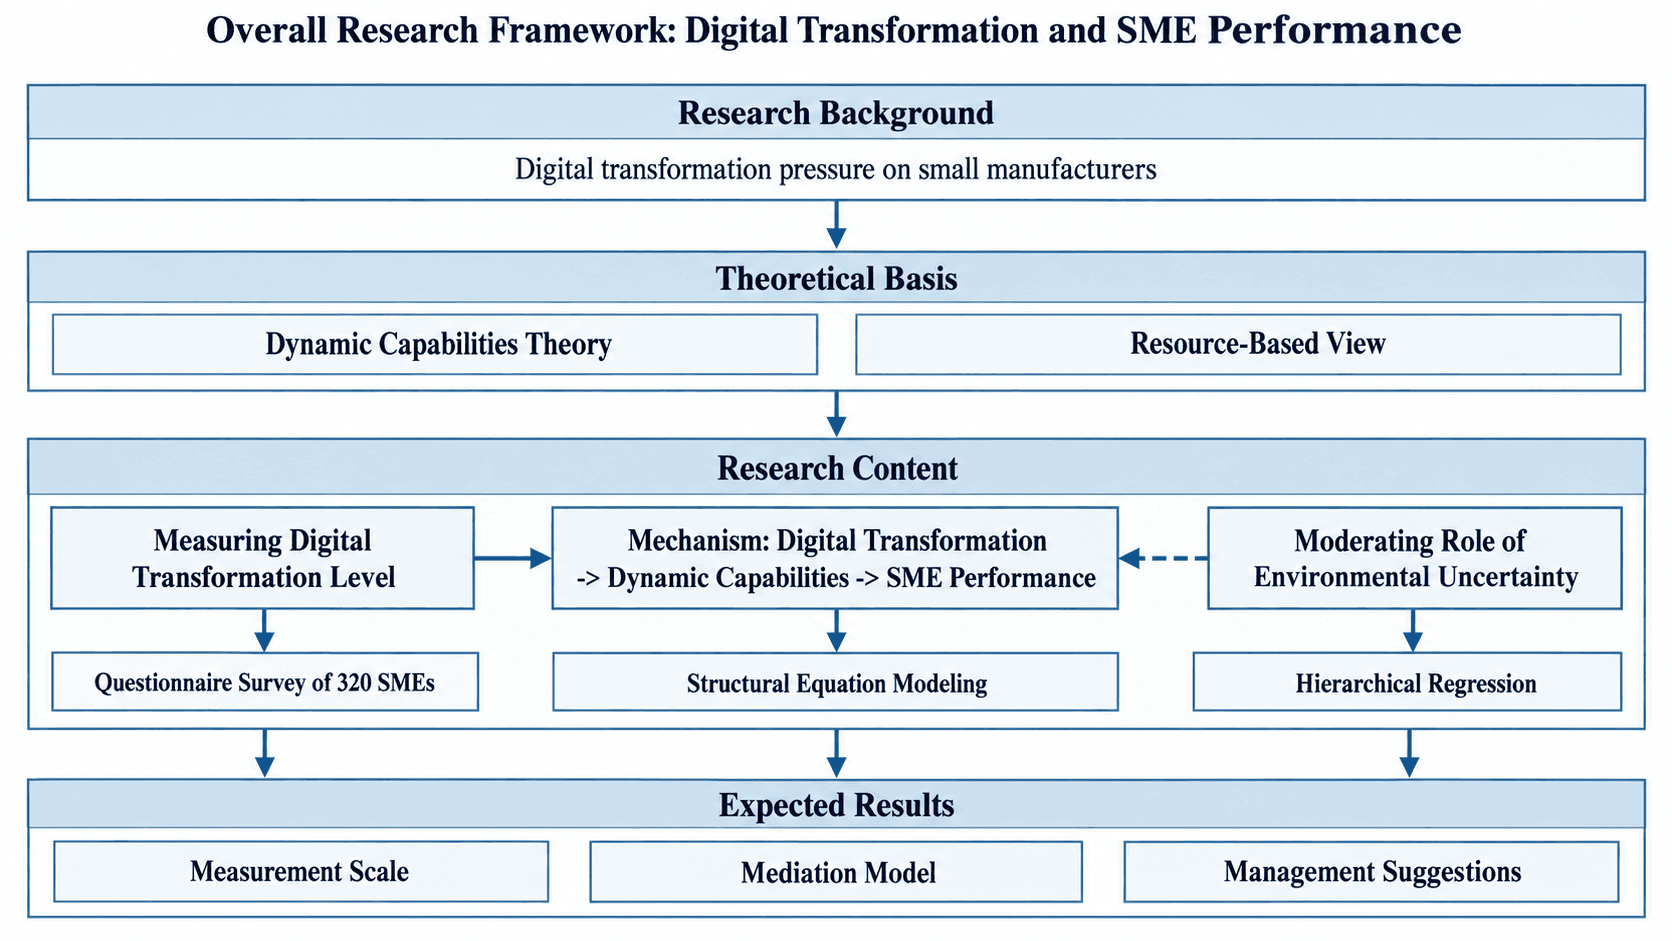
Come disegnare il framework concettuale della tesi: modello delle variabili, IPO e framework di ricerca complessivo (2026)
Tre modi per rappresentare il framework concettuale di una tesi o di un progetto di ricerca — modello delle variabili, framework IPO input-processo-output e framework di ricerca complessivo — con esempi svolti e gli errori che il relatore rimanda indietro.
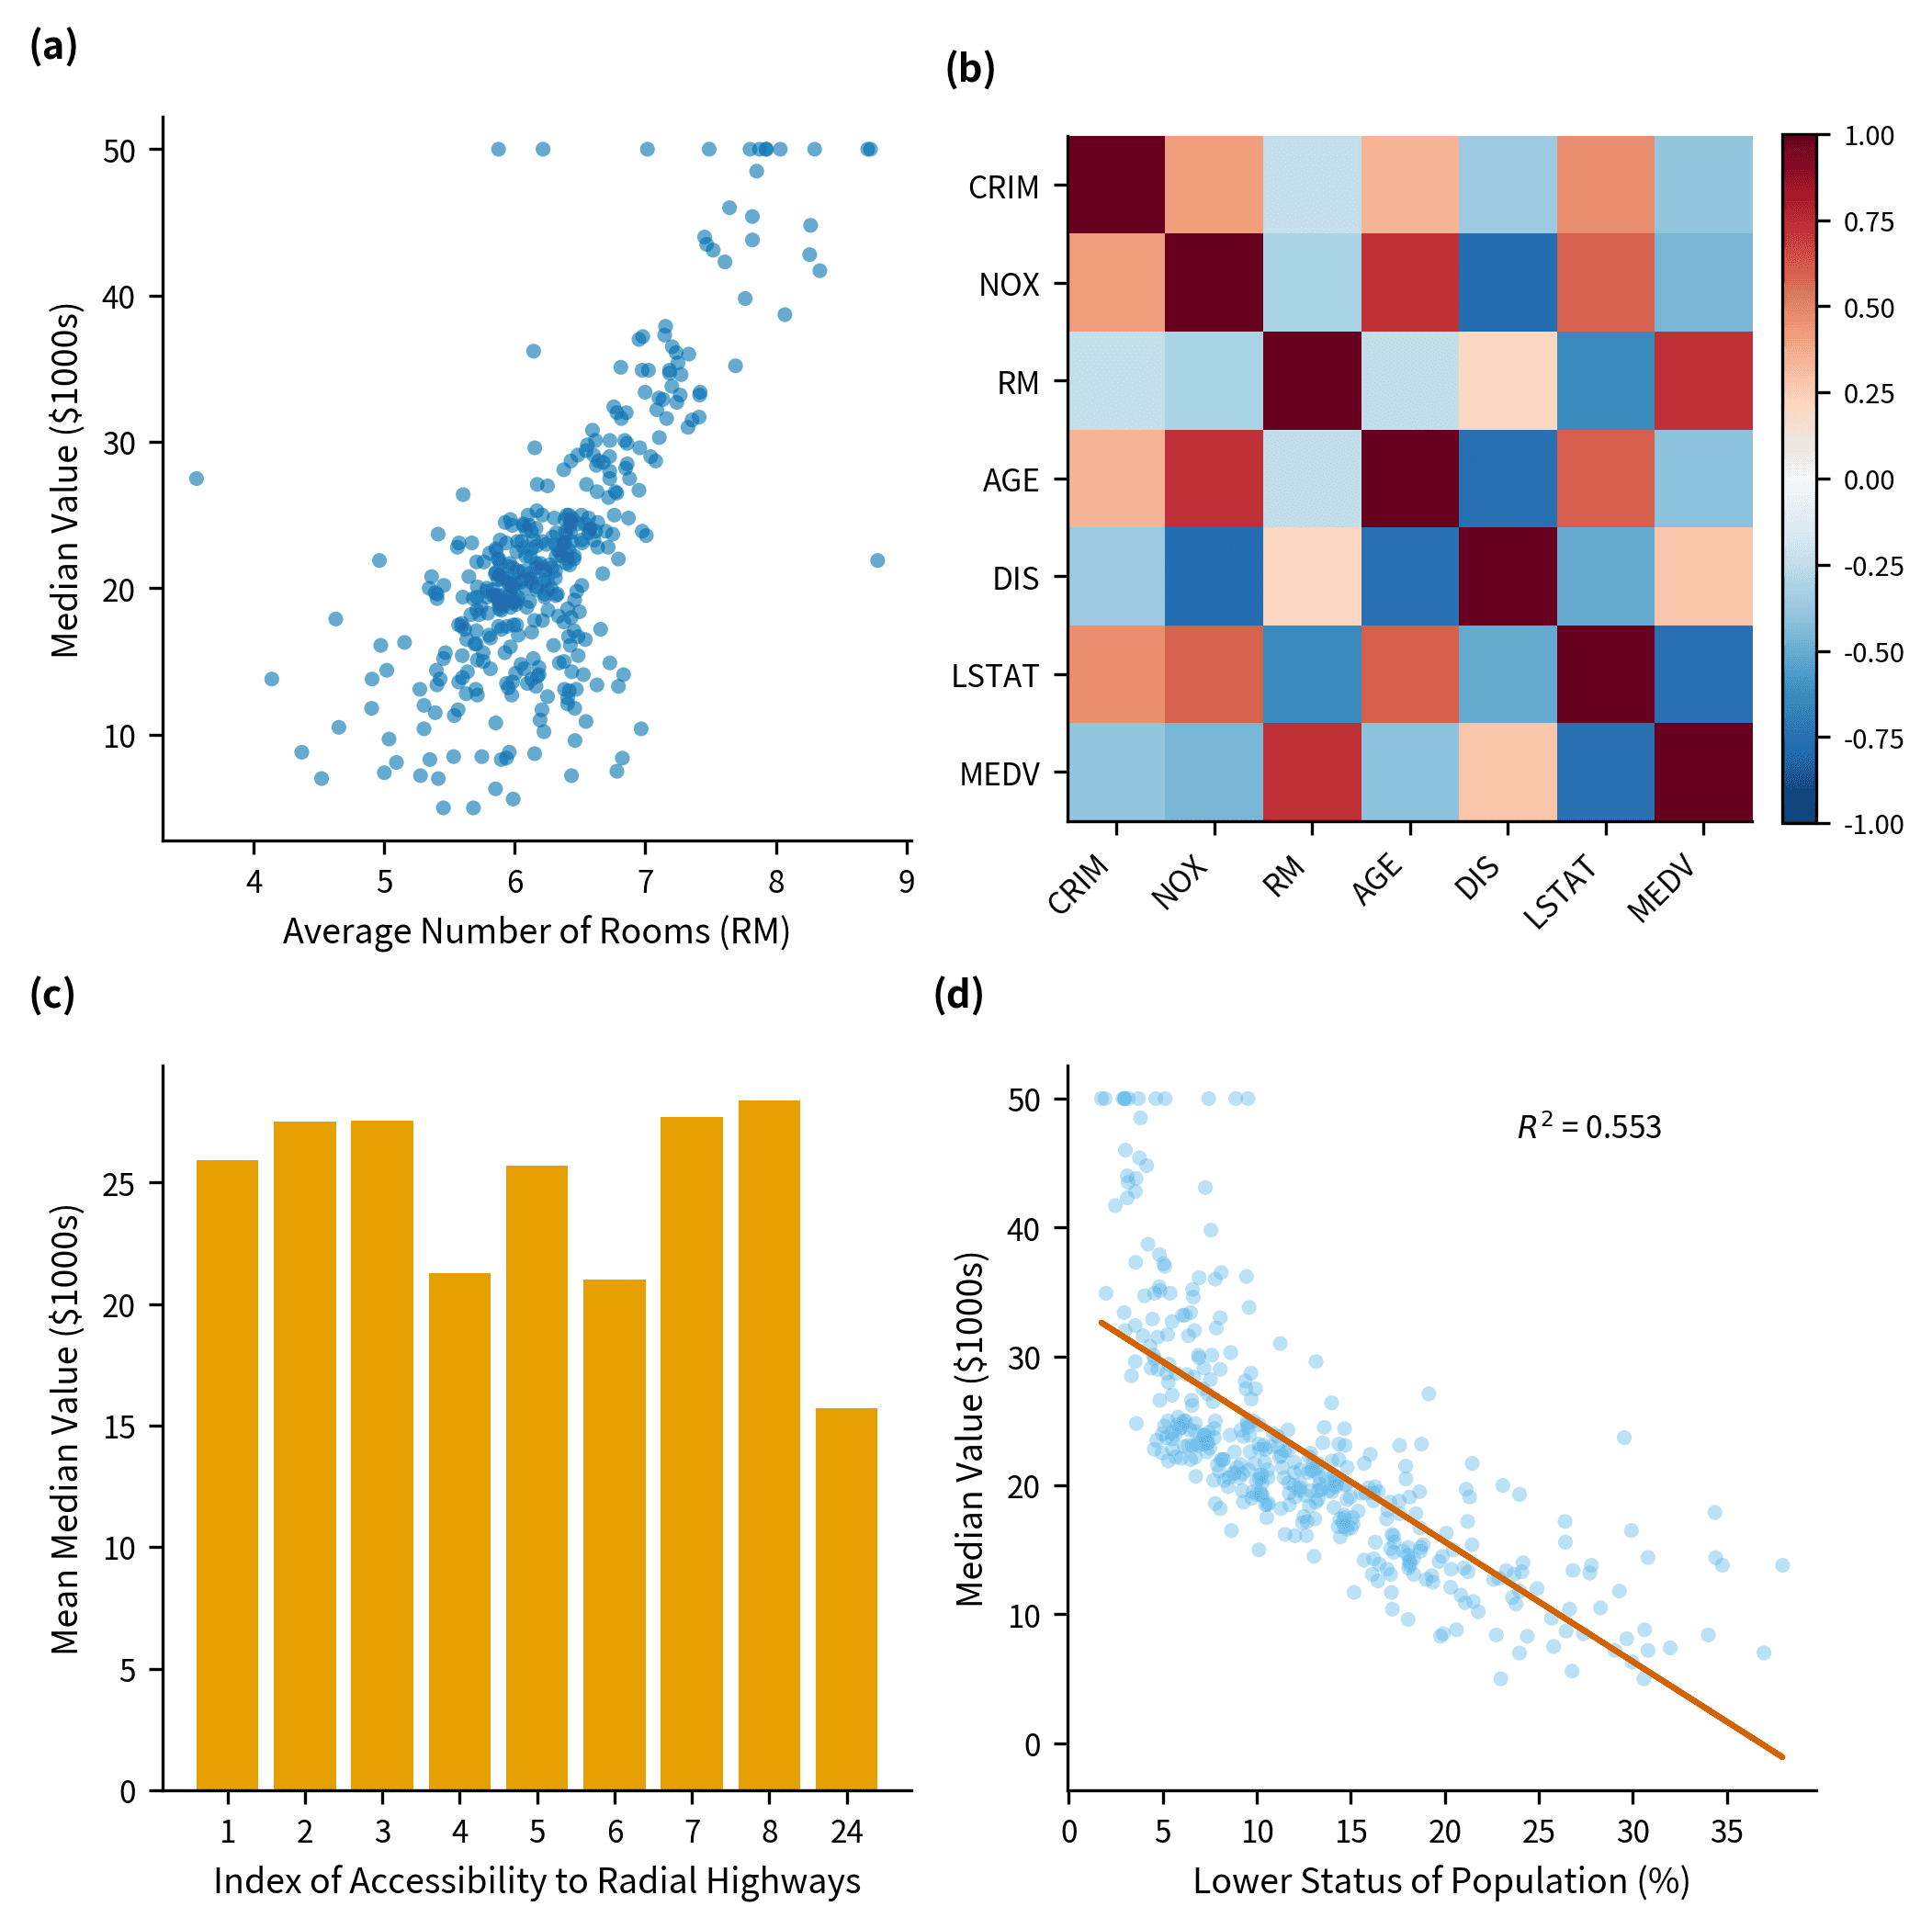
Visualizzazione dei Dati Scientifici: 46 Strumenti di Grafica per CSV ed Excel
Scegli il grafico scientifico più adatto, verifica le colonne di dati necessarie e genera 46 tipologie di plot pronti per la pubblicazione a partire da file CSV o Excel con SciDraw AI SciVis.