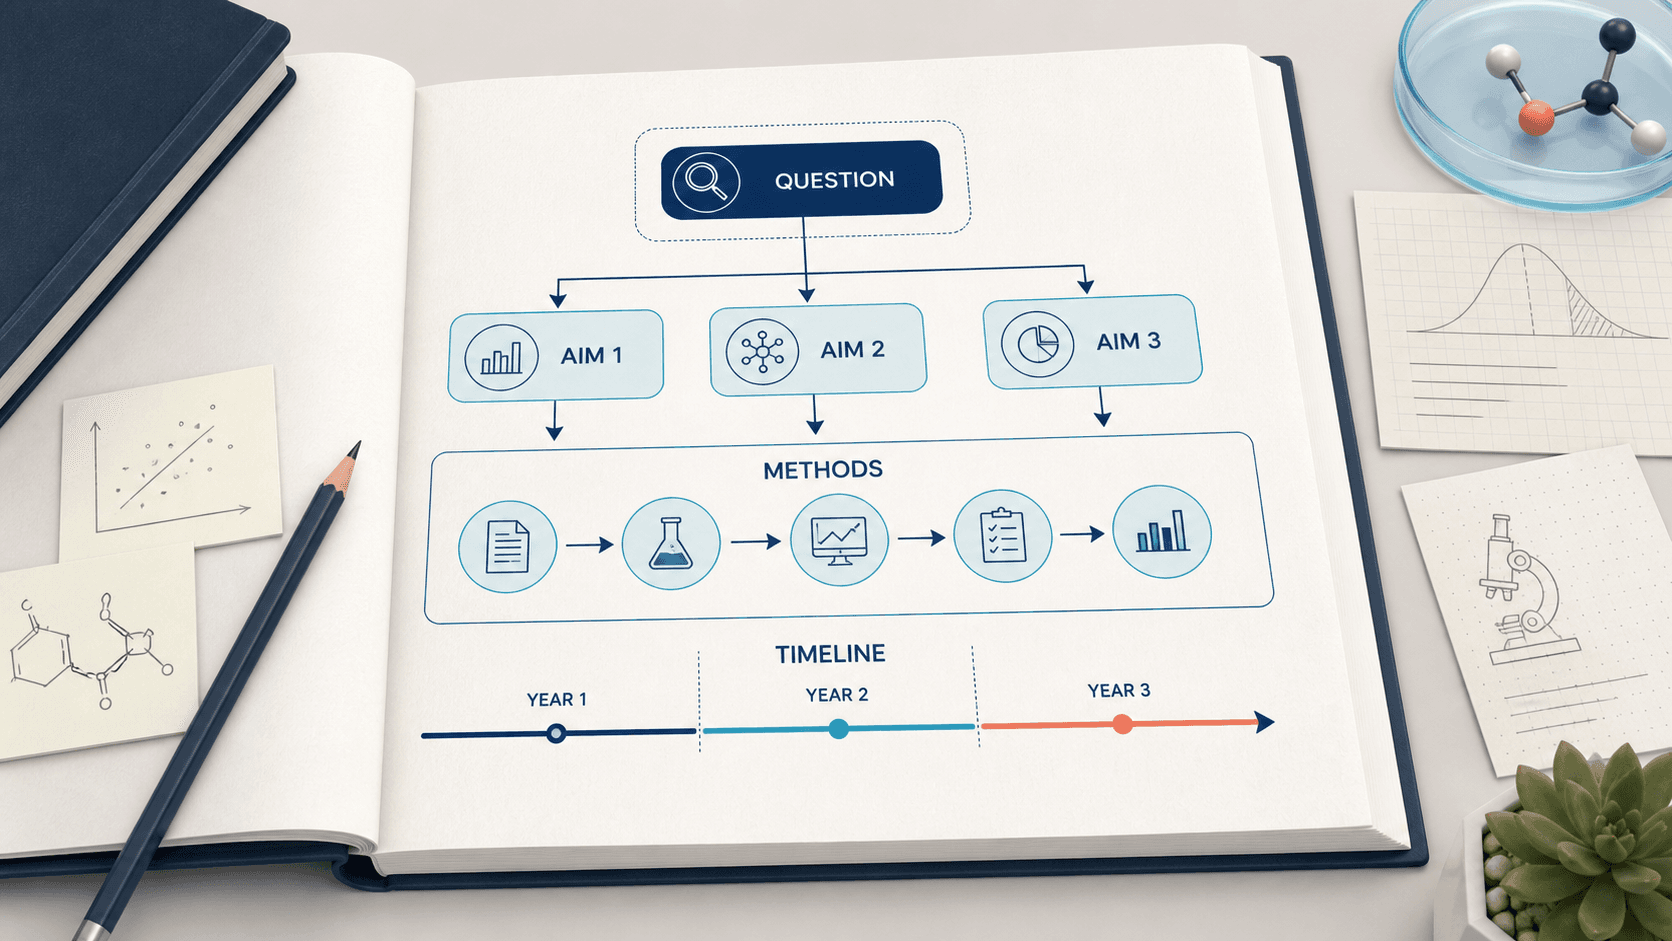
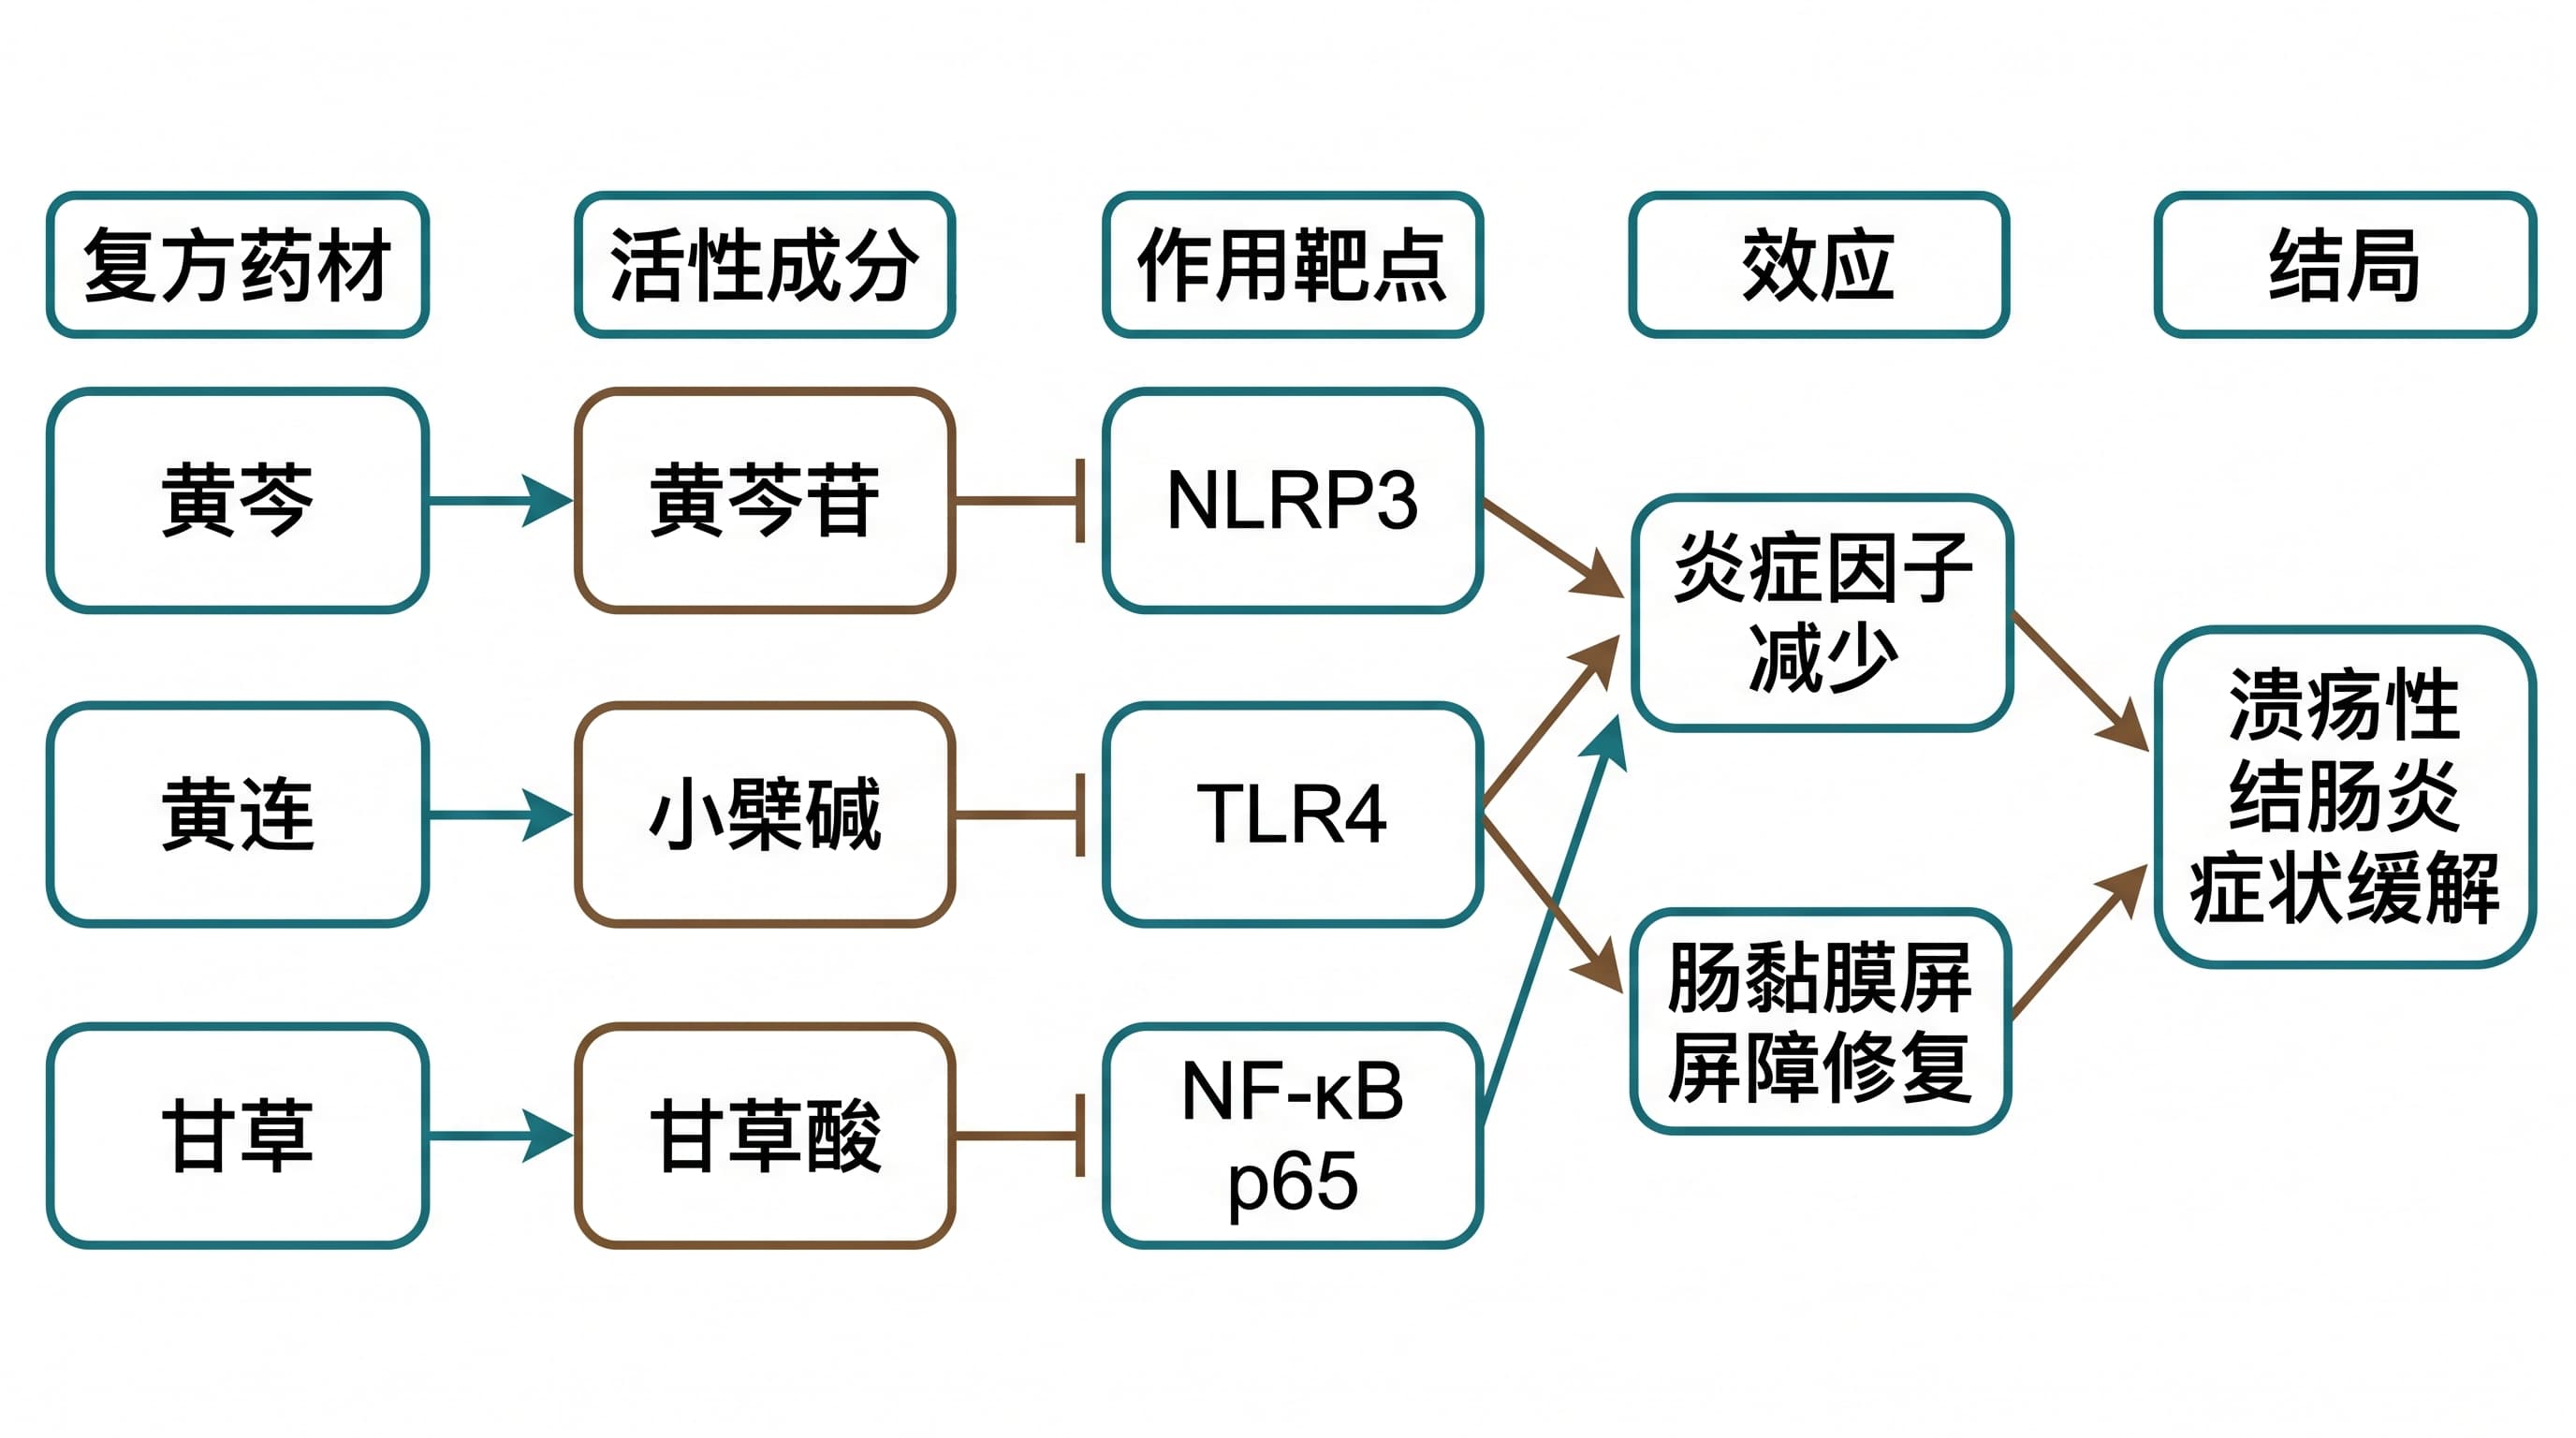
Searching for a research proposal example usually means you already know the textbook definition of a proposal, but you want to see how a real document fits together on the page. Advisors, admissions committees, and grant panels rarely reject a proposal over formatting trivia; instead, proposals stall when the background fails to narrow into a specific gap, the methods do not match the research questions, or the work plan looks unrealistic.
Seeing complete examples—alongside the visual diagrams that anchor each section—makes the structural logic clear. Below, you will find a section-by-section overview table, two full fictional research proposal examples (one in social sciences and education, and one in engineering and AI), a copy-paste research proposal template, and practical guidance on creating the figures that help reviewers grasp your research design in seconds.
💡 Want the figure right away? Describe your research stages in one paragraph and the Research Roadmap Maker drafts your overall proposal design in seconds; convert any draft to editable SVG or PPTX with Vectorize Image and keep editing in PowerPoint or Illustrator.
Research Proposal Structure at a Glance
Use the table below to see how a standard research proposal distributes its weight across sections and which visual diagram fits each part.
| Section | Core Question Answered | Length Share | Best Diagram Type |
|---|---|---|---|
| 1. Title & Working Summary | What is the exact scope, target population or system, and core method? | 5% | Compact graphical overview (if required) |
| 2. Background & Research Gap | What does prior literature establish, and what critical blind spot remains? | 20%–25% | Problem-to-gap funnel diagram |
| 3. Research Questions & Hypotheses | Which specific, testable questions or objectives will close that gap? | 10% | Conceptual framework diagram |
| 4. Research Design & Methodology | How will data be collected, modeled, analyzed, and validated? | 30%–35% | Overall proposal framework or workflow diagram |
| 5. Timeline & Milestones | In what sequence will stages unfold, and what are the deliverables? | 10% | Gantt chart or milestone timeline |
| 6. Expected Contributions & Feasibility | Why do findings matter, and why is this team equipped to succeed? | 10% | Feasibility & resource diagram |
| 7. Ethics, Limitations & Risks | What approvals are needed, and what contingencies exist for bottlenecks? | 5%–10% | Risk-contingency matrix |
Two Complete Research Proposal Examples (With Diagrams)
Note: Both examples below are entirely fictional samples written strictly to demonstrate proposal structure and figure placement. They do not contain real experimental results, scores, or performance numbers.
Example A: Social Sciences & Education (Conceptual Mediation Model)
1. Title
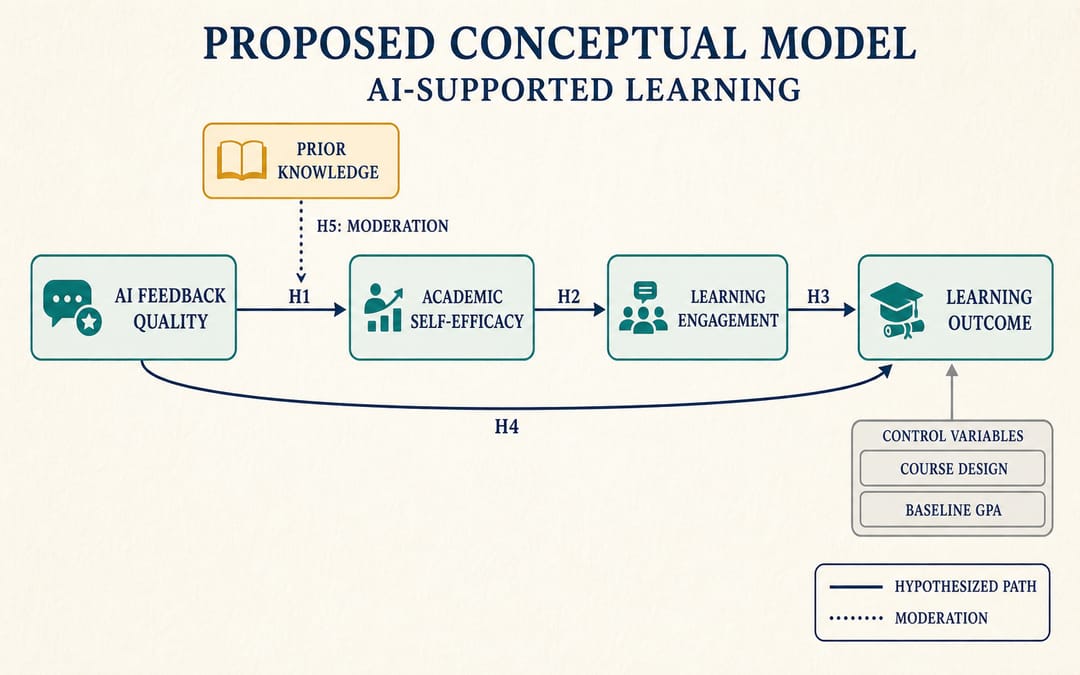
From Automated Corrections to Sustained Mastery: Examining How AI Feedback Quality Shapes Undergraduate Learning Outcomes Through Academic Self-Efficacy and Learning Engagement
2. Background & Research Gap
Generative AI writing assistants increasingly provide immediate formative feedback in university courses, yet most studies only test whether automated suggestions improve short-term draft revisions. Existing research largely treats student motivation and behavioral persistence as a black box. Specifically, little is known about whether the pedagogical quality of AI feedback—such as specificity and scaffolding—improves long-term learning outcomes by strengthening students' academic self-efficacy and learning engagement.
3. Research Questions & Hypotheses
This study asks how AI feedback quality influences semester-long undergraduate learning outcomes, and to what extent academic self-efficacy and learning engagement mediate this relationship. We hypothesize (H1) that higher AI feedback quality positively predicts students' academic self-efficacy, and (H2) that academic self-efficacy positively drives behavioral and cognitive learning engagement. Finally, we hypothesize a serial mediation pathway (H3) whereby AI feedback quality improves learning outcomes indirectly by sequentially strengthening academic self-efficacy and learning engagement.
4. Methodology
We will conduct a three-wave longitudinal survey and learning-analytics study across multi-section undergraduate courses over two consecutive terms. AI feedback quality will be evaluated through rubric-coded interaction logs and student perception scales, while academic self-efficacy and learning engagement will be measured at mid-term intervals using validated psychometric instruments. Final learning outcomes will be assessed via blind-graded capstone rubrics, and structural equation modeling (SEM) with bootstrapping will test direct and serial mediation paths while controlling for baseline GPA.
5. Timeline (Relative Schedule)
- Year 1, Term 1: Complete literature synthesis, finalize psychometric scales, secure ethics board approval, and pilot the log-coding rubric.
- Year 1, Term 2 – Year 2, Term 1: Run three-wave longitudinal data collection across undergraduate course sections and clean behavioral logs.
- Year 2, Term 2: Estimate SEM mediation models, perform multi-group robustness checks, and draft journal manuscripts.
6. Expected Contributions
Theoretically, this study bridges formative feedback theory and social cognitive theory by identifying the serial psychological mechanism linking AI feedback quality to durable learning gains. Methodologically, it pairs objective system logs with multi-wave longitudinal surveys rather than cross-sectional self-reports. Practically, the findings will guide instructional designers in configuring AI tutoring tools that foster independent student agency.
7. Ethics & Risk Mitigation
Informed consent will be collected from all participants, and course logs and grades will be de-identified before analysis under institutional review board (IRB) guidelines. To mitigate panel attrition across the three survey waves, questionnaires will be integrated into regular in-class reflection exercises, and multiple imputation will address missing data.
Diagrams to Include & How to Generate Them
For a social science or education proposal like Example A, include two visuals:
- Conceptual Framework Diagram: Place this right after your hypotheses to display independent variables, mediators, and outcomes with clear H1–H3 arrows. Draft it with the Conceptual Framework Maker and review layout patterns in our Humanities & Social Science Proposal Diagram Guide.
- Overall Proposal & Timeline Figures: Summarize your research questions, theory, methods, and outputs on one page using the Research Roadmap Maker (Proposal Mode), and map your multi-term schedule in the Research Roadmap Maker (Timeline Mode).
Example B: Engineering & AI (Separated Model Development and External Validation)
1. Title
Physics-Informed Cross-Regime Battery State-of-Health Prediction: Decoupling Lab-Scale Model Development from Multi-Chemistry External Validation
2. Background & Research Gap
Accurate State-of-Health (SoH) estimation is essential for electric vehicle battery safety and predictive maintenance. While deep learning models achieve low error on single-source laboratory cycling data, their accuracy drops sharply under unseen fast-charging protocols, temperatures, and cathode chemistries. Moreover, many studies rely on random train-test splits from the same experimental batch, conflating internal curve-fitting with cross-domain generalization. A rigorous framework is needed that embeds electrochemical degradation laws during training and strictly separates model development from external validation.
3. Research Questions & Hypotheses
This project examines how combining physics-informed degradation constraints with domain-invariant representation learning improves SoH prediction across heterogeneous cycling regimes. We ask (RQ1) which differential voltage and thermal-electrochemical features remain stable under varying fast-charging rates, and (RQ2) how effectively a physics-constrained architecture generalizes to unseen cell chemistries without full retraining. We hypothesize that enforcing monotonic capacity-fade and impedance-growth constraints in the loss function will prevent physically implausible trajectories during out-of-distribution external validation.
4. Methodology
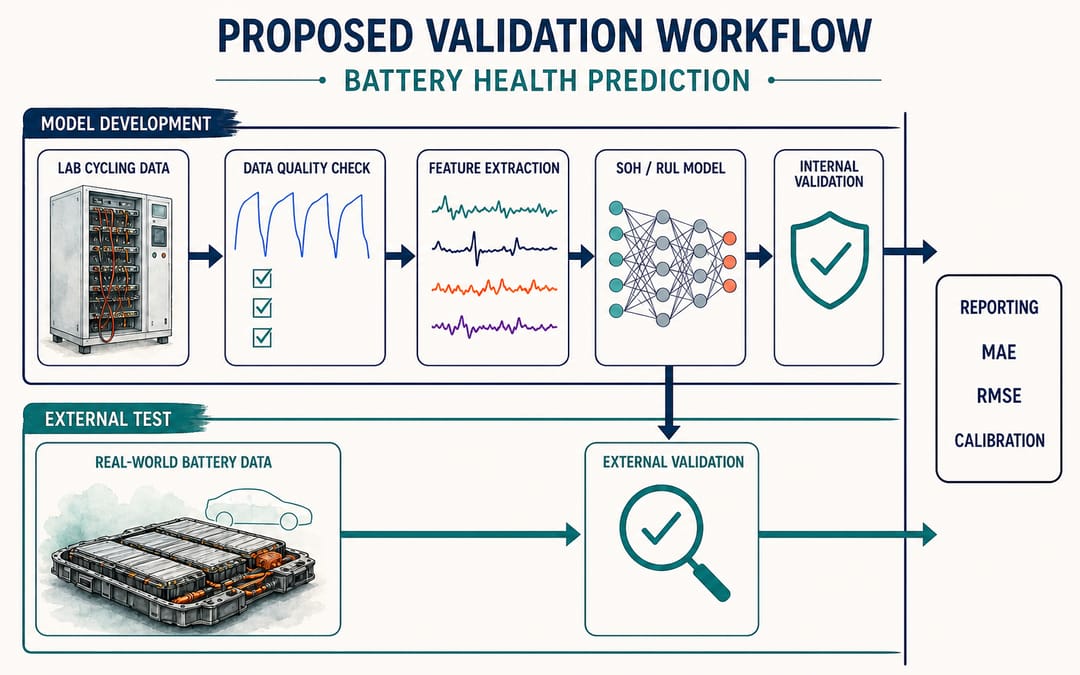
The workflow is divided into two strictly isolated stages: Stage 1 (Model Development & Internal Cross-Validation) and Stage 2 (Locked-Model External Validation). In Stage 1, voltage, current, and temperature curves from a single benchmark chemistry undergo denoising, incremental capacity feature extraction, and physics-informed neural network training using cell-grouped cross-validation. In Stage 2, model weights and preprocessing parameters are frozen and tested on independent external datasets covering distinct cathode chemistries and dynamic drive cycles, alongside few-shot adaptation benchmarks and ablation checks.
5. Timeline (Relative Schedule)
- Year 1: Curate cycling datasets, build the signal preprocessing pipeline, and implement baseline electrochemical and deep learning benchmarks.
- Year 2: Train the physics-informed architecture, complete cell-grouped internal cross-validation, and run loss-function ablation studies.
- Year 3: Conduct locked-model external validation across unseen chemistries, benchmark edge-inference latency, and write dissertation chapters.
6. Expected Contributions
This project provides a reproducible physics-informed prognostics pipeline that unites sequence modeling with electrochemical degradation constraints. By enforcing a hard boundary between internal development cohorts and external validation cohorts, it establishes a leakage-free evaluation protocol for battery health forecasting and delivers a lightweight module suitable for battery management systems.
7. Ethics & Risk Mitigation
This study involves no human subjects or personal data; all laboratory cell tests will follow certified high-energy battery safety and thermal containment standards. Because partial-charge field segments may contain severe sensor noise that obscures incremental capacity peaks, our contingency plan incorporates a multi-scale wavelet branch operating directly on raw voltage segments.
Diagrams to Include & How to Generate Them
For an engineering or AI proposal like Example B, reviewers look for leakage-free pipeline schematics:
- System Workflow Diagram: Use the Workflow Diagram Generator to visually separate Stage 1 (internal model development) from Stage 2 (external validation).
- Method Roadmap & Timeline: Connect research questions to work packages and validation steps without calendar clutter in the Research Roadmap Maker (Method Mode), and pair it with a schedule from the Research Roadmap Maker (Timeline Mode). For physical or biological mechanisms, you can also use the Mechanism Figure Generator or Scientific Figure Maker.
Copy-Paste Research Proposal Template
Copy the plain-text outline below into your editor and fill in the bracketed prompts for your project.
# [WORKING TITLE: Mechanism/Method + Target Variable/System + Context/Population]

## 1. Background and Research Gap
- Broad Context: [2–3 sentences on why this problem matters in your discipline or industry.]
- What Is Known: [Summarize 2–3 key literature streams and what prior work has established.]
- The Critical Gap: [State the exact unresolved mechanism, validation flaw, or boundary condition.]

## 2. Research Questions, Hypotheses, and Objectives
- Overarching Aim: [This study aims to examine/develop/validate...]
- RQ1 & Hypothesis/Objective 1: [State question and expected directional path or technical target.]
- RQ2 & Hypothesis/Objective 2: [State mediation, moderation, or cross-domain generalization target.]
- [INSERT FIGURE 1: Conceptual Framework or Overall Proposal Design Diagram]

## 3. Research Design and Methodology
- Study Design & Data: [Specify longitudinal, experimental, or computational design + cohort separation.]
- Module 1 (Data & Preprocessing): [Sampling, instruments, or signal/feature engineering.]
- Module 2 (Modeling & Intervention): [Core empirical protocol or model architecture.]
- Module 3 (Validation & Robustness): [Statistical tests, ablation studies, or external validation.]
- [INSERT FIGURE 2: Methodology Workflow or Method Roadmap]

## 4. Work Plan and Relative Timeline
- Year 1 (or Term 1–2): [Literature review, ethics approval, data/pipeline setup, pilot baseline.]
- Year 2 (or Term 3–4): [Main data collection or model development, internal validation.]
- Year 3 (or Term 5–6): [External validation, robustness checks, thesis/manuscript writing.]
- [INSERT FIGURE 3: Project Timeline / Gantt Chart]

## 5. Expected Contributions and Feasibility
- Scholarly & Practical Value: [How findings advance theory, methods, or real-world systems.]
- Feasibility: [Available datasets, lab equipment, computing resources, and supervisor expertise.]

## 6. Ethics, Limitations, and Risk Mitigation
- Ethics & Safety: [IRB approval, anonymization, informed consent, or lab safety protocols.]
- Primary Risk & Contingency: [Most likely technical/empirical bottleneck + concrete fallback plan.]
The 4 Most Common Diagrams in a Research Proposal
Visual figures turn dense prose into an inspectable blueprint. For deeper design guidance, see our Research Proposal Figures Guide and Thesis Proposal Roadmap Guide.
1. Research Framework Diagram
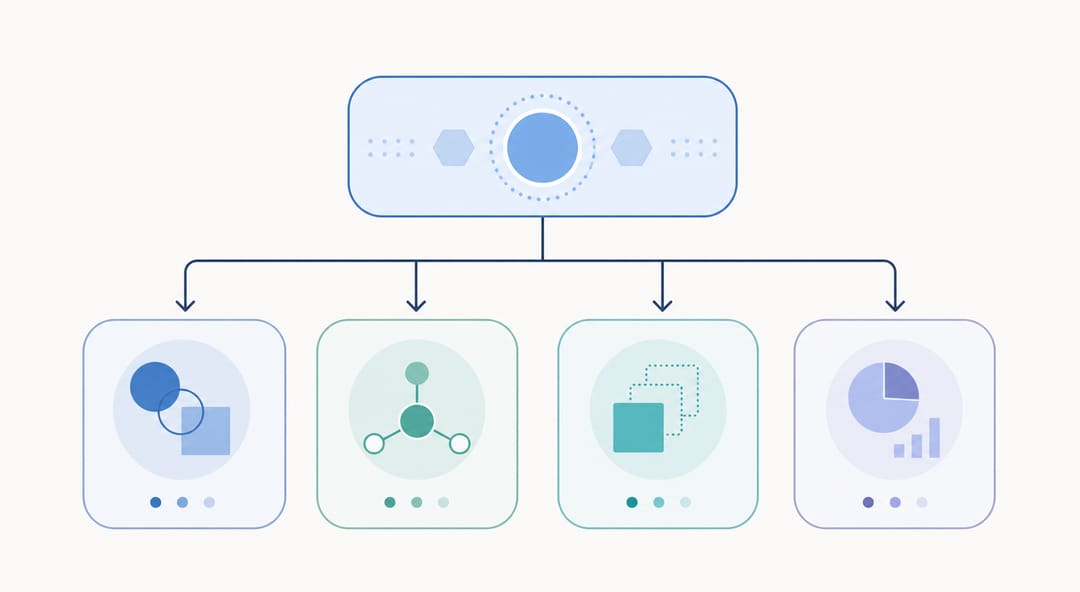
- When to use it: Place at the transition between your research questions and methods when a central goal branches into interconnected sub-modules. Draft a one-page overview in the Research Roadmap Maker (Proposal Mode).
- Common mistakes: Cramming full sentences into tiny boxes, mismatching variable names between text and figure, or drawing decorative arrows without logical meaning.
2. Methodology Roadmap (Technical Route Diagram)
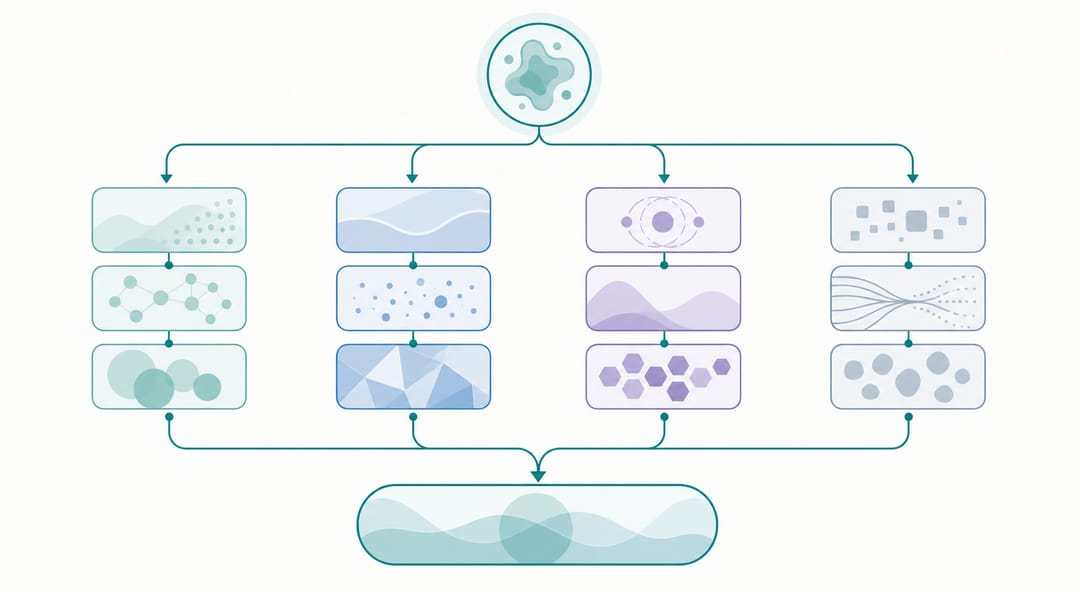
- When to use it: Place inside the methodology section to trace how the problem flows through research contents, methods, data, and verification toward final outputs—without mixing in dates—using the Research Roadmap Maker (Method Mode).
- Common mistakes: Writing vague labels like "Data Analysis" without naming specific baselines or validation criteria, or failing to show how parallel modules converge.
3. Project Timeline (Gantt Chart)
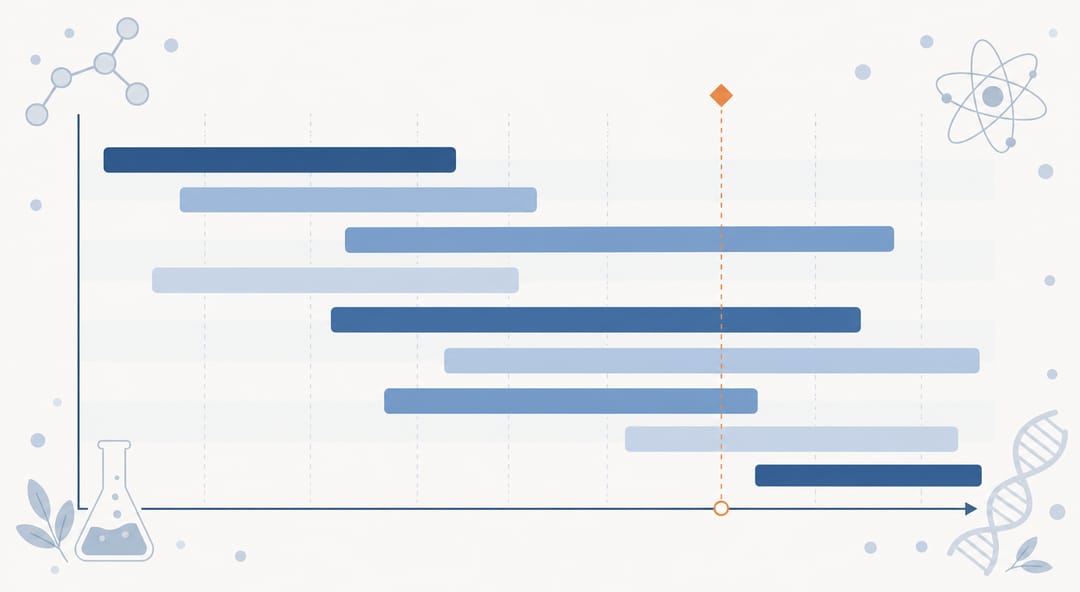
- When to use it: Place in your work plan section so reviewers see realistic overlap across stages. Generate it with the Research Roadmap Maker (Timeline Mode) or Research Roadmap Maker (General Mode).
- Common mistakes: Listing tasks with zero overlap, leaving all writing to the last month, or inventing exact calendar dates when relative terms (Year 1–Year 3) are more appropriate.
4. Feasibility & Resource Diagram
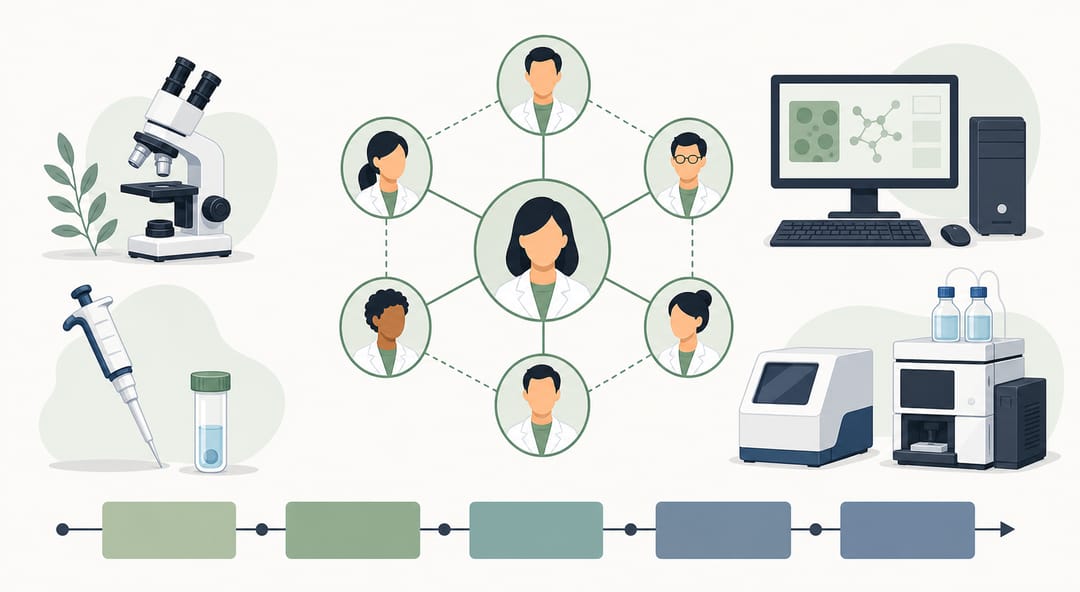
- When to use it: Include in grant applications or ambitious doctoral proposals to link prior work, equipment, and team expertise directly to your work packages.
- Common mistakes: Listing generic biography bullets instead of tying specific datasets or instruments to the proposal's technical bottlenecks.
Prompt Examples for Generating Proposal Figures with AI
When drafting figures in SciDraw AI, specific prompts yield structured academic diagrams, whereas vague prompts produce generic boxes.
- ❌ Weak Prompt:
"Make a research proposal diagram for my study on AI feedback and university student learning."(Missing variables, hypothesis directions, methods, and outputs.) - ✅ Strong Prompt:
"Create a methodology roadmap for an undergraduate education proposal. Research Question: How does AI feedback quality shape learning outcomes via academic self-efficacy (H1) and learning engagement (H2, H3 serial mediation)? Module 1: Rubric coding of AI logs + baseline survey. Module 2: 3-wave longitudinal psychometric survey across two terms. Module 3: SEM with bootstrapping and multi-group invariance checks. Output: Validated mediation model and AI tutor design guidelines."
Important reminder: Every AI-generated figure is a first draft. Applicants must personally verify all arrow directions, labels, and biological or technical accuracy against their text, and must never include fabricated experimental results, scores, or performance numbers. To customize fonts, colors, or layout in PowerPoint or Illustrator, convert your image into an editable SVG or PPTX file using Vectorize Image.
Pre-Submission Research Proposal Checklist
- Gap-to-Question Alignment: Every research question directly targets a gap established in the background section.
- Testable Hypotheses/Objectives: Hypotheses specify directional relationships, or engineering aims specify clear validation criteria.
- Methodological Traceability: Every question maps to a concrete dataset, instrument, and analytical procedure.
- Validation Separation: Modeling and engineering proposals strictly separate internal development cohorts from external validation cohorts.
- Text-to-Figure Consistency: Construct names, module labels, and H1/RQ1 tags in diagrams match the manuscript text word-for-word.
- Manual Accuracy Check: All AI-drafted arrows, feedback loops, and technical terms have been verified by the author.
- No Fabricated Numbers: Neither text nor figures contain invented pilot results, p-values, or performance metrics.
- Realistic Relative Schedule: The timeline uses relative phases (e.g., Year 1–3) with buffer time for ethics clearance and writing.
- Actionable Contingency Plan: Each major empirical or technical risk is paired with a specific fallback method.
Related Proposal Writing & Figure Guides
- How to Write a PhD Research Proposal: Complete guide to framing doctoral research questions and aligning with supervisors.
- Research Proposal Figures Guide: How to plan and design visual figures for grant and degree proposals.
- Thesis Proposal Roadmap Guide: Step-by-step instructions for thesis opening report technical route diagrams.
- Humanities & Social Science Proposal Diagram Guide: Visual frameworks for mediation models, theoretical structures, and qualitative designs.
Frequently Asked Questions (FAQ)
1. How long should a research proposal be?
There is no universal length. Programmes, funders, and departments set their own limits, and they range from a one-page concept note for a prospective supervisor to a full grant or candidacy document. Follow the official word or page limit, and when no section limits are given, let the methodology take the largest share, since that is where reviewers test feasibility.
2. Should a research proposal include diagrams or figures?
Only when the instructions allow it and a figure does real work. One to three clear figures—a conceptual framework, a methodology workflow, or a timeline—help reviewers see how your modules connect. A figure that only decorates the page wastes space you could spend on the argument.
3. Can I copy a research proposal example or template directly?
You can reuse the section structure, headings, and outline flow from a template, but you must never copy the topic framing, literature synthesis, or hypotheses from an example. Every proposal is screened for originality and must reflect your own scholarly gap and research plan.
4. What is the difference between a research proposal and a personal statement?
A personal statement focuses on you—your academic preparation, past projects, and motivation for applying. A research proposal focuses on the study itself—the research gap, questions, methodology, timeline, and scholarly contribution.
5. Where can I find guidance specifically for a PhD application research proposal?
Doctoral admissions panels evaluate multi-year feasibility, theoretical depth, and supervisor fit. Read our dedicated guide on How to Write a PhD Research Proposal and browse our Tools for PhD Students page for doctoral workflow utilities.
Draft Your Research Proposal Figures in Minutes
Ready to turn your outline into clear academic visuals? Open the Research Roadmap Maker on SciDraw AI to generate a proposal framework, methodology roadmap, or timeline diagram from your text, and export editable SVG or PPTX files with Vectorize Image. You can get started right away with the free trial quota—new users receive 10 credits at sign-up plus 5 daily credits (valid for that day), and a standard 2K figure costs 5 credits, making it easy to draft and refine your proposal diagrams.