„Und wo ist Ihr Konzeptrahmen?“ – An dieser Frage scheitern mehr Exposé-Besprechungen als an jeder methodischen Schwäche. Im Fließtext lässt sich vieles offenhalten, in einer Abbildung nicht. Ein Forschungsrahmen-Diagramm bringt Ihre Variablen, Ihre Argumentationslogik und Ihre erwarteten Ergebnisse auf eine Seite, und ob diese Logik trägt, sieht man nach etwa zehn Sekunden.
Das Problem: Hinter dem Wort „Forschungsrahmen“ verbergen sich mindestens drei verschiedene Abbildungen. Die meisten Entwürfe kommen nicht deshalb mit Anmerkungen zurück, weil jemand nicht zeichnen kann, sondern weil der falsche Typ für die eigene Studie gewählt wurde.
Dieser Leitfaden behandelt die drei, die Betreuerinnen und Betreuer tatsächlich verlangen – das Variablenmodell, das IPO-Modell und den Gesamtforschungsrahmen: wann welcher passt, was Gutachter bemängeln und wie Sie aus einer Beschreibung in Textform einen ersten Entwurf erhalten.
Das lernen Sie:
- Welchen der drei Rahmentypen Ihre Studie braucht
- Welche Fehler Betreuer regelmäßig anstreichen
- Ein ausgearbeitetes Beispiel für jeden Typ
- Wie Sie aus einem Absatz Text einen ersten Entwurf erzeugen
Bevor Sie Beziehungen zwischen Variablen zeichnen, legen Sie fest, was jeder Begriff bedeutet und woran er beobachtet wird. Unser Leitfaden zur Operationalisierung mit Beispielen und Tabellenvorlage hilft, den Rahmen mit Ihrem Methodenteil in Einklang zu halten.
Drei Rahmentypen, drei verschiedene Aufgaben
| Rahmentyp | Beantwortet | Typische Fächer |
|---|---|---|
| Variablenmodell | Welche Variablen wirken auf welche, und über welchen Pfad? | BWL und Management, Psychologie, Bildungswissenschaft, Public Health |
| IPO-Modell | Was geht hinein, welcher Prozess läuft ab, was kommt heraus? | Wirtschaftsinformatik, Informatik, Abschluss- und Entwicklungsprojekte |
| Gesamtforschungsrahmen | Wie hängen Problem, Theorie, Inhalte, Methoden und Ergebnisse zusammen? | Fast jede Abschlussarbeit, besonders in der Exposé-Phase |
Die Entscheidung ist einfach. Wenn Ihre Studie Variablen misst und Hypothesen prüft, brauchen Sie ein Variablenmodell. Wenn sie etwas entwickelt, brauchen Sie IPO. Wenn Sie Betreuer oder Prüfungsausschuss zeigen müssen, wie die ganze Arbeit zusammenhängt, brauchen Sie einen Gesamtrahmen. Viele Arbeiten enthalten zwei davon: den Gesamtrahmen im Exposé, das Variablenmodell im Methodenkapitel.
Typ 1: Das Variablenmodell
Diesen Rahmen braucht die Mehrzahl der quantitativen Arbeiten. Er zeigt die unabhängigen Variablen, die abhängige Variable und die Pfade dazwischen – einschließlich allem, was auf diesen Pfaden liegt oder sie verändert.
Was hineingehört:
- Unabhängige Variablen (UV) links, jede in einem eigenen Kasten
- Abhängige Variable (AV) rechts
- Mediatoren auf dem Pfad selbst, zwischen UV und AV
- Moderatoren darüber oder darunter, mit einem Pfeil, der auf den moderierten Pfad zeigt, nicht auf eine Variable
- Kontrollvariablen in einem eigenen Kasten, meist unten links, ohne Verbindung
- Hypothesenbezeichnungen (H1, H2, H3) an den Pfeilen, sofern Ihr Text die Hypothesen nummeriert
Beispiel – Technologieakzeptanz:
Unabhängige Variablen: wahrgenommener Nutzen, wahrgenommene Benutzerfreundlichkeit. Mediator: Einstellung zur Nutzung. Abhängige Variable: Verhaltensabsicht. Moderator: Vertrauen, das auf den Pfad Einstellung → Verhaltensabsicht wirkt. Die Hypothesen H1 bis H4 stehen an den vier Pfeilen.
Richtig gezeichnet, kann eine Leserin Ihre Hypothesen allein aus der Abbildung wiedergeben. Genau daran wird das Modell gemessen.
Was zurückkommt:
- Ein Moderator, der wie eine weitere unabhängige Variable gezeichnet ist. Ein Moderator verändert die Stärke eines Zusammenhangs. Sein Pfeil muss auf einem Pfeil landen, nicht auf einem Kasten.
- Methoden als Variablen. „Fragebogenerhebung“ und „Regressionsanalyse“ sind keine Konstrukte. Sie gehören in die Darstellung Ihrer technischen Route, nicht hierher.
- Pfeile ohne Richtung oder Bedeutung. Jeder Pfeil ist eine Hypothese. Wenn Sie nicht sagen können, für welche Hypothese ein Pfeil steht, löschen Sie ihn.
- Keine theoretische Herleitung. Wenn Ihr Modell nicht erkennbar aus einer Theorie oder aus bisherigen Befunden hervorgeht, werden Sie gefragt, woher es kommt.
Typ 2: Das IPO-Modell
Input-Prozess-Output-Modelle sind Standard in der Informatik, in ingenieurwissenschaftlichen Abschlussprojekten und in Arbeiten, die ein System entwickeln; besonders verbreitet sind sie an Hochschulen auf den Philippinen und in Südostasien. Wer aus der Wirtschaftsinformatik kommt, kennt das Prinzip als EVA (Eingabe – Verarbeitung – Ausgabe). Die Abbildung besteht aus drei Kästen in einer Reihe, manchmal ergänzt um eine Evaluationsschleife.
Was wohin gehört:
- Input – was Sie vor der Entwicklung zusammentragen: Wissensanforderungen (die fachlichen Regeln, die Normen und die Rechtsvorschriften, die das System erfüllen muss), Software-Anforderungen, Hardware-Anforderungen, Daten der Befragten
- Prozess – das Vorgehensmodell und seine Phasen: Anforderungserhebung, Entwurf, Implementierung, Test, Inbetriebnahme, benannt nach dem Modell, das Sie tatsächlich verwendet haben (agil, Wasserfall, RAD)
- Output – das Ergebnis selbst, konkret benannt
- Evaluation – ein Pfeil vom Output zurück zum Input, sofern Sie das System evaluiert und die Ergebnisse zurückgespielt haben
Beispiel – ein Gesundheitsaktensystem für ein Barangay:
Ein Barangay ist die kleinste Verwaltungseinheit der Philippinen. Input: Wissensanforderungen (Führung von Gesundheitsakten, Datenschutzrecht); Software-Anforderungen (PHP, MySQL, Bootstrap); Hardware-Anforderungen (Arbeitsplatzrechner, Drucker). Prozess: Anforderungserhebung, Systementwurf, Implementierung, Test und Inbetriebnahme nach agilem Vorgehen. Output: ein webbasiertes Gesundheitsaktensystem für das Barangay. Ein Evaluationspfeil führt vom Output zurück zum Input.
Was zurückkommt:
- Ein Prozesskasten, in dem nur „Entwicklung“ steht. Nennen Sie die Phasen und das Vorgehensmodell.
- Ein Output, der eine Hoffnung ist und kein Ergebnis. „Höhere Effizienz“ ist eine Wirkung, kein Output. Der Output ist das System.
- IPO und Variablenmodell vermischt. Sobald Sie einen Mediator in den Prozesskasten setzen, haben Sie den falschen Rahmentyp gewählt.
Typ 3: Der Gesamtforschungsrahmen
Das ist die einseitige Abbildung, die beantwortet, wie Ihre gesamte Arbeit zusammenpasst. Gerade in der Exposé-Phase wollen Betreuer und Prüfungsausschüsse sie oft vor allem anderen sehen.
Aufbau, von oben nach unten:
- Hintergrund oder Problemstellung – eine Zeile, als Problem formuliert, nicht als Thema
- Theoretische Grundlage – die Theorien oder Modelle, auf denen Ihre Arbeit aufbaut, nebeneinander
- Forschungsinhalte – zwei bis vier Blöcke, jeder eine Teilfrage, die Sie tatsächlich beantworten
- Methoden und Daten – unter jedem Inhaltsblock die konkrete Methode und Datenquelle für genau diesen Block
- Erwartete Ergebnisse und Beiträge – was jeder Block hervorbringt
Der Wert dieser Abbildung liegt darin, dass sie eine Eins-zu-eins-Zuordnung erzwingt. Jeder Inhaltsblock braucht eine Methode darunter und darunter wiederum ein Ergebnis. Ein Block ohne Methode ist genau die Lücke, die Ihr Prüfungsausschuss finden wird.
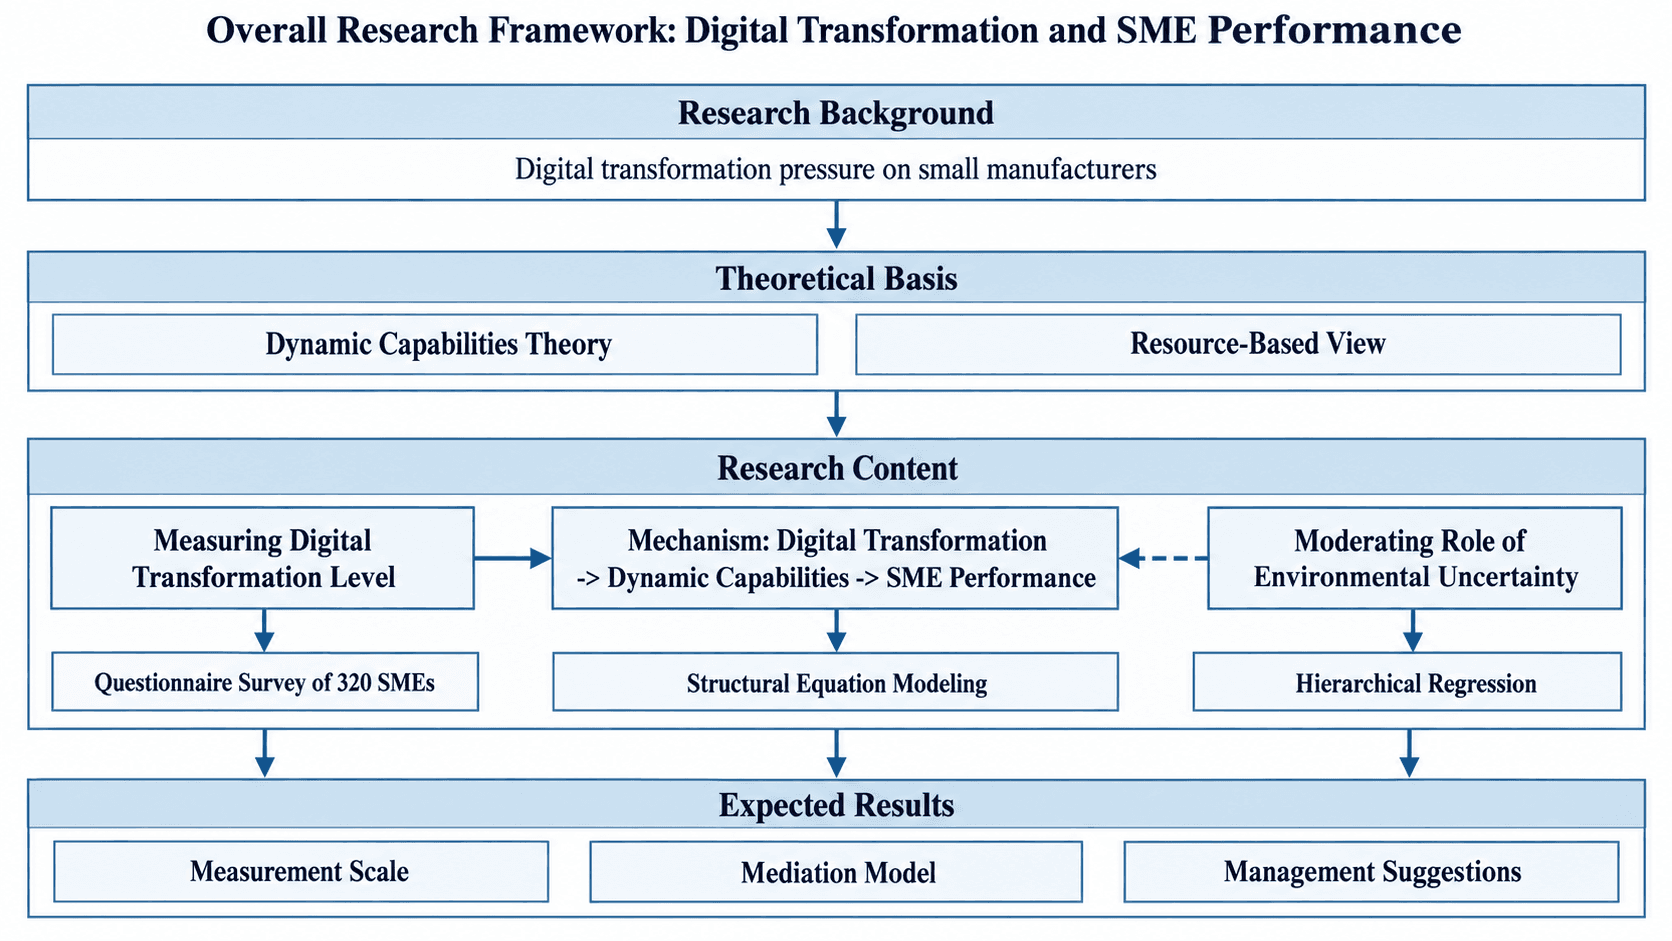
Beispiel – digitale Transformation und Unternehmenserfolg von KMU:
Hintergrund: Kleine Fertigungsbetriebe stehen unter Druck, sich digital zu transformieren, obwohl der Nutzen unklar ist. Theoretische Grundlage: Dynamic-Capabilities-Ansatz, ressourcenbasierter Ansatz (RBV). Inhalte: (1) Messung des Digitalisierungsgrads, (2) der Wirkmechanismus von der Transformation zum Unternehmenserfolg über dynamische Fähigkeiten, (3) die moderierende Rolle der Umweltunsicherheit. Methoden: Befragung von 320 KMU, Strukturgleichungsmodellierung, hierarchische Regression. Erwartete Ergebnisse: eine Messskala, ein Mediationsmodell, Handlungsempfehlungen für das Management.
Was zurückkommt:
- Inhaltsblöcke, die in Wahrheit Kapitelüberschriften sind. „Literaturüberblick“ ist kein Forschungsinhalt. Ein Forschungsinhalt ist eine Frage, die Sie mit Daten beantworten.
- Eine Theorieebene, die nie wieder auftaucht. Steht der Dynamic-Capabilities-Ansatz oben, berührt aber keinen Inhaltsblock, wird die Gutachterin fragen, was er dort soll.
- Vier Methoden für drei Inhaltsblöcke – oder keine für einen davon. Die Zuordnung ist der ganze Zweck der Abbildung.
Ersten Entwurf aus Text erzeugen
Kästen in PowerPoint verschieben und nach jeder Anmerkung des Betreuers die Pfeile neu verlegen – das ist der langsame Weg. Schneller geht es, wenn Sie den Rahmen als Absatz formulieren, einen Entwurf erzeugen und ihn dann überarbeiten.
Der Konzeptrahmen-Generator trennt die drei Typen inzwischen in eigene Modi, die Sie über dem Eingabefeld umschalten:
- Variablenmodell – nennen Sie UV, AV, Mediatoren, Moderatoren und Hypothesennummern, und er setzt sie auf die richtigen Pfade
- IPO-Modell – nennen Sie, was in jede der drei Spalten gehört, und er hält sie sauber getrennt
- Gesamtforschungsrahmen – geben Sie Hintergrund, Theorie, Inhaltsblöcke, Methoden und erwartete Ergebnisse an, und er ordnet sie so untereinander an, dass die Zuordnung sichtbar bleibt
Wählen Sie zuerst den Modus. Die Vorgaben für den Prompt unterscheiden sich je nach Modus – deshalb sieht ein Variablenmodell, das im Modus Gesamtforschungsrahmen erzeugt wurde, wie eine Gliederung aus und nicht wie ein Pfaddiagramm.
Zwei Dinge sollten Sie wissen. Der Generator zeichnet nur die Variablen und Beziehungen, die Sie angeben – er erfindet keinen Mediator, damit Ihr Modell eleganter wirkt, und genau das wollen Sie bei einer Abbildung für die Abschlussarbeit. Und wenn Sie eigentlich die Abfolge der Methoden brauchen statt der Variablenstruktur, ist das eine andere Abbildung: Nutzen Sie dafür den Modus Technische Route.
Für die übrigen Abbildungen Ihrer Arbeit können Sie Abbildungen für Abschlussarbeiten nach Fachrichtung durchsuchen und die passende Vorlage direkt öffnen.
Häufige Fragen
Welchen Rahmentyp braucht meine Arbeit? Wenn Sie Hypothesen über Variablen prüfen, das Variablenmodell. Wenn Sie ein System oder Produkt entwickeln, das IPO-Modell. Wenn Sie sich auf die Exposé-Besprechung vorbereiten und die gesamte Studie zeigen müssen, den Gesamtforschungsrahmen. Eine Arbeit kann durchaus zwei davon in verschiedenen Kapiteln enthalten.
Ist ein Konzeptrahmen dasselbe wie ein theoretischer Rahmen? Die beiden überschneiden sich, sind aber nicht identisch. Der theoretische Rahmen ist die Theorie, auf die Sie sich stützen; der Konzeptrahmen ist Ihre eigene Abbildung davon, wie die Konstrukte in Ihrer Studie zusammenhängen. Die meisten Studiengänge erwarten die Theorie im Fließtext und den Rahmen als Abbildung.
Wie viele Variablen sollte ein Rahmendiagramm enthalten? So viele, wie Sie zum Formulieren Ihrer Hypothesen brauchen, und keine mehr. Ab etwa acht Kästen hören Leser auf, Pfade nachzuverfolgen. Ist Ihr Modell tatsächlich größer, teilen Sie es auf: eine Abbildung des Gesamtrahmens plus ein detailliertes Variablenmodell pro Teilstudie.
Kann ich den Rahmen aus dem Exposé in der fertigen Arbeit wiederverwenden? Ja, und das sollten Sie auch – ein Rahmen, der sich zwischen Exposé und Kolloquium stillschweigend ändert, provoziert Nachfragen. Bewahren Sie eine bearbeitbare Version auf, aktualisieren Sie sie, wenn sich Ihr Modell ändert, und weisen Sie im Text auf die Änderung hin, statt die Abbildung einfach heimlich neu zu zeichnen.