LogoLogoSciDraw AI
  • Start Creating
  • Tools
  • Blog
  • Pricing
  • API
  • Education Discount
LogoLogoSciDraw AI

AI-powered scientific figure platform for researchers, students, educators, and science communicators. Create publication- and classroom-ready figures, graphical abstracts, TOC graphics, posters, and teaching illustrations in minutes. No design skills required.

EmailYouTubeXGitHubLinkedInInstagramStripe ClimateStripe Climate Contribution
Tools
  • AI Drawing
  • Scientific Data Visualization
  • Graphical Abstract Maker
  • Scientific Figure Maker
  • Image Converter
  • Vectorize Image
  • All Tools
Popular tools
  • Scientific Diagram Maker
  • Scientific Poster Maker
  • Research Poster Template
  • Plant Cell Diagram
  • Lewis Dot Structure Generator
  • Molecular Orbital Diagram Generator
  • PRISMA Flow Diagram Generator
  • Conceptual Framework Maker
Use Cases
  • For PhD Students
  • For Educators
  • For Journal Submission
  • BioRender Alternative
Resources
  • Blog
  • Scientific Chart Guide
  • Gallery
  • Published references
  • Media Kit
  • Developers
Company
  • About
  • Pricing
  • Affiliate
  • Academic Support Program
  • Institutional invoicing
  • Privacy Policy
  • Terms of Service
© 2026 SciDraw AI All Rights Reserved.
How to Make a Receptor Signaling Diagram with AI: GPCR & RTK (2026)
2026/06/18

How to Make a Receptor Signaling Diagram with AI: GPCR & RTK (2026)

Draw clean, labeled receptor signaling diagrams with AI — GPCR cAMP signaling, RTK activation, and the MAPK/ERK and PI3K-AKT-mTOR cascades — using a reusable prompt template, real examples, and publication-ready export. No design software required.

Receptor signaling is the backbone of cell biology figures — and the most error-prone to draw. A single receptor signaling diagram can chain a ligand, a transmembrane receptor, an adaptor, a kinase cascade, and a nuclear transcription event, with branch points where one receptor feeds two pathways. Whether you are showing GPCR signaling, an RTK firing the MAPK/ERK cascade, or the PI3K-AKT-mTOR survival axis, this guide shows you how to generate a clean, accurate, publication-ready receptor signaling diagram with AI from a single sentence — then refine it by talking to the editor.
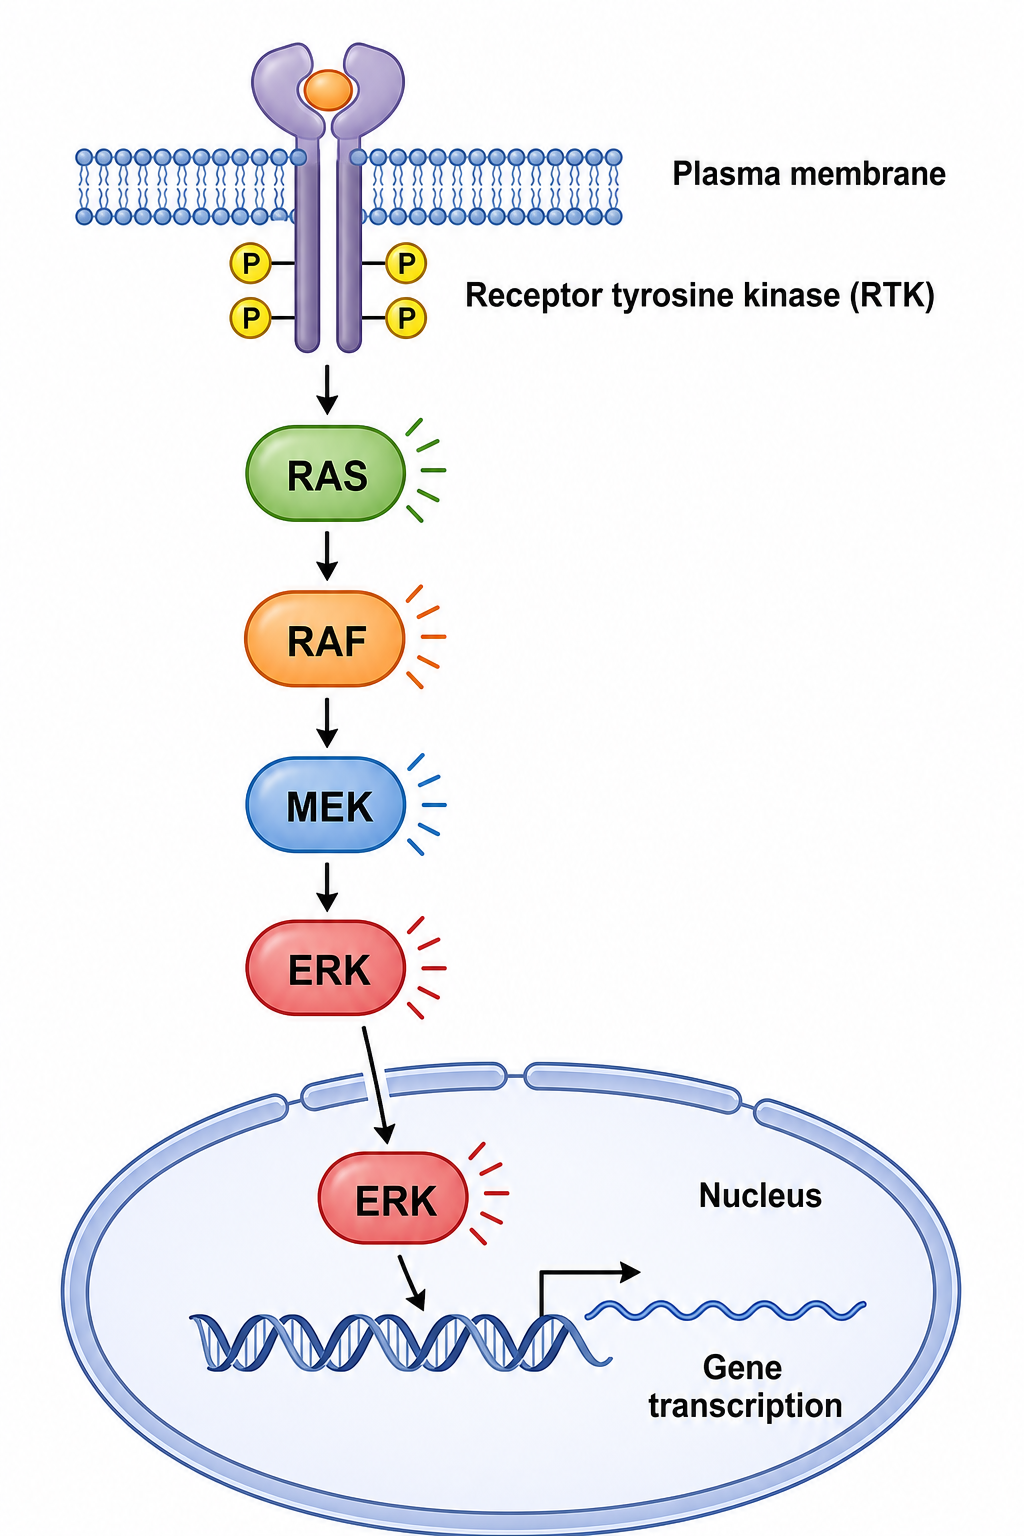
MAPK ERK receptor signaling diagram showing RTK activation, RAS, RAF, MEK, ERK cascade and nuclear translocation to transcription factors

By the end of this guide you'll be able to:

  • Generate GPCR and RTK receptor signaling diagrams from one prompt.
  • Draw the MAPK/ERK cascade (RAS → RAF → MEK → ERK) and the PI3K-AKT-mTOR pathway with correct order and labels.
  • Show ligand binding, receptor dimerization, second messengers, and nuclear translocation cleanly.
  • Mark branch points and cross-talk where one receptor activates two cascades.
  • Export an editable figure for your manuscript, slides, or poster.

Paste any prompt below into the Signaling Pathway Diagram Generator, then refine the result in the SciDraw AI editor.

A reusable prompt template for receptor signaling

Strong receptor signaling prompts have four parts:

  1. Subject — the receptor type and downstream pathway(s): GPCR, RTK → MAPK, RTK → PI3K-AKT.
  2. Steps and interactions — ligand binding, activation, the kinase cascade, the endpoint.
  3. Labels — name the ligand, receptor, each kinase, the second messenger, and the transcription factor.
  4. — "flat vector, publication-ready, top-to-bottom flow with a labeled cell membrane and nuclear membrane, activation arrows and inhibition bars."

All Posts

Author

avatar for Davie Chen / SciDraw AI
Davie Chen / SciDraw AI

Researcher

Davie Chen is a researcher at the Faculty of Animation and Intermedia, University of Arts in Poznan, studying generative AI for scientific figure creation, patent illustration, and manuscript drafting. SciDraw AI is one of the research-to-product tools built from this work.

Author profile

Categories

A reusable prompt template for receptor signalingCopy-paste receptor signaling promptsGPCR signalingRTK → MAPK/ERK cascadeRTK → PI3K-AKT-mTOR pathwayBranching and cross-talkHow to get clean, accurate receptor signaling diagramsCommon mistakes (and how to fix them)Export and use your receptor signaling figureFrequently asked questionsStart creating

More Posts

Create your scientific figures with AI

Thousands of researchers use SciDraw AI to make publication-ready figures for papers, grants, and journal submissions — in minutes, with no design skills.

Start for free
Style & layout

Template: "Draw the [receptor type] signaling pathway showing [ligand binding → cascade → endpoint]. Label [ligand, receptor, kinases, second messengers, transcription factors]. Use a clean flat-vector style with a labeled cell membrane and nuclear membrane, activation arrows, top-to-bottom layout."

Copy-paste receptor signaling prompts

GPCR signaling

  1. Draw the GPCR cAMP signaling pathway: a ligand binding a G-protein-coupled receptor at the membrane, activation of the heterotrimeric G protein (Gαs), dissociation of Gα-GTP, activation of adenylyl cyclase, conversion of ATP to the second messenger cAMP, activation of protein kinase A (PKA), and PKA phosphorylating CREB in the nucleus to drive transcription. Label GPCR, ligand, Gαs, adenylyl cyclase, cAMP, PKA, CREB.
  2. Show GPCR signaling through the Gq–PLC–IP3/DAG arm: receptor activation of Gαq, phospholipase C cleaving PIP2 into IP3 and DAG, IP3 releasing Ca²⁺ from the ER, and DAG activating PKC. Label each second messenger.

RTK → MAPK/ERK cascade

  1. Draw the receptor tyrosine kinase (RTK) MAPK/ERK pathway: growth factor binding, RTK dimerization and autophosphorylation, recruitment of GRB2 and SOS, RAS-GDP to RAS-GTP exchange, and the RAF → MEK → ERK phosphorylation cascade, with ERK translocating to the nucleus to activate transcription factors and drive proliferation. Label EGF/growth factor, RTK, GRB2, SOS, RAS, RAF, MEK, ERK, and the nucleus.

RTK → PI3K-AKT-mTOR pathway

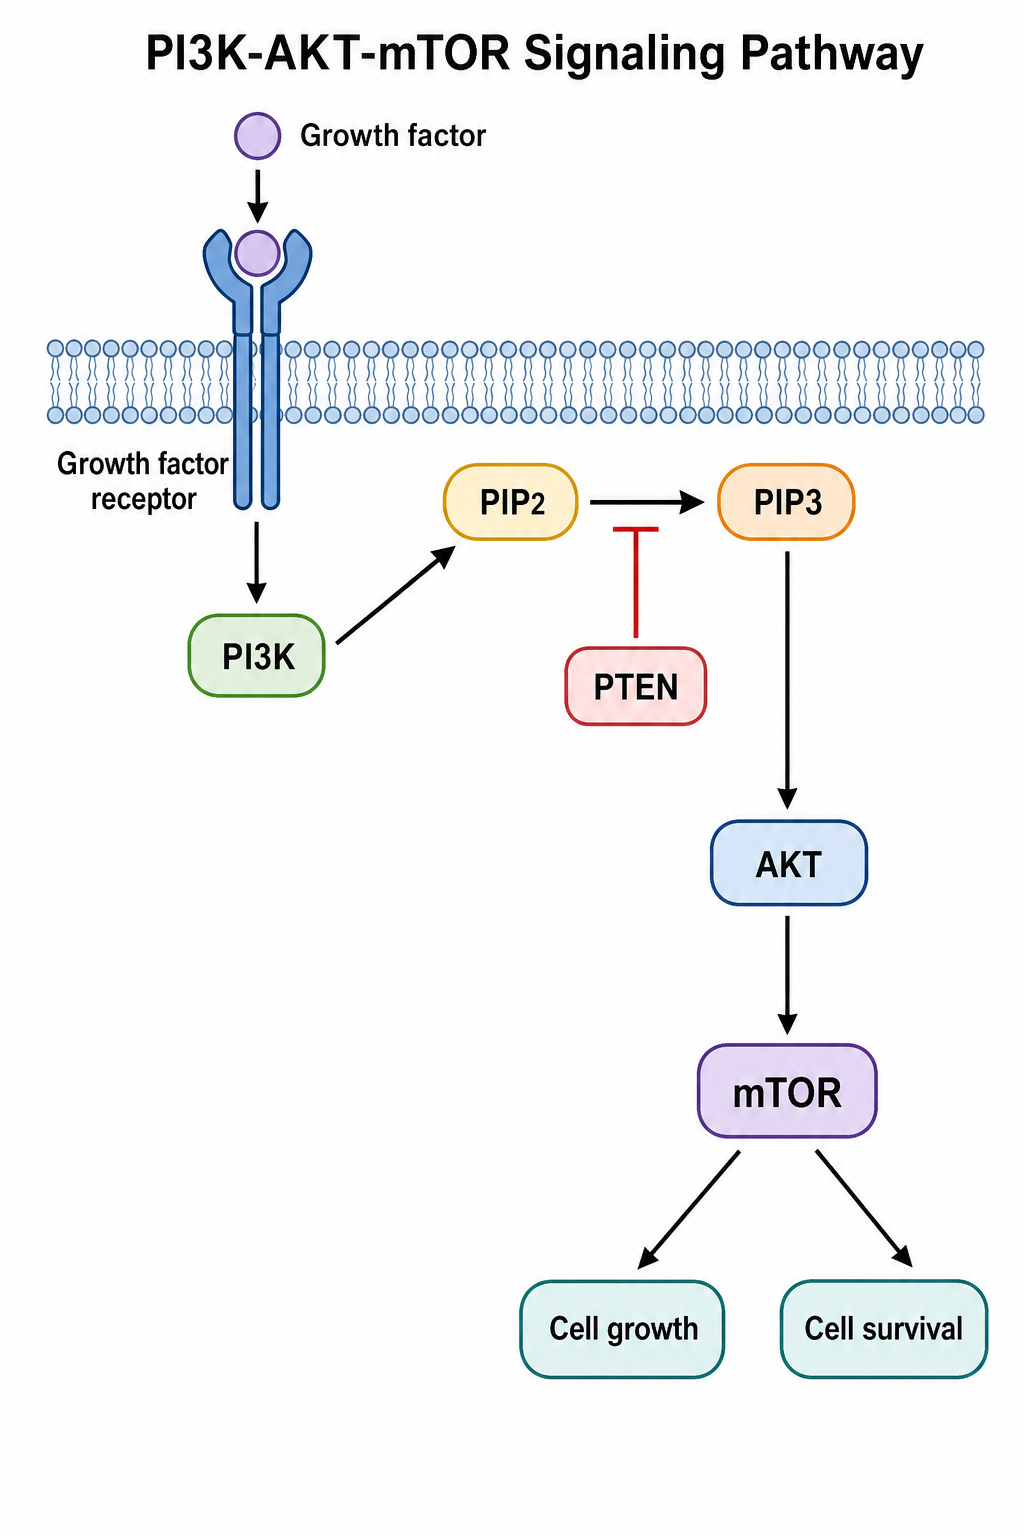
  1. Draw the PI3K-AKT-mTOR survival pathway: an activated RTK recruiting PI3K, PI3K converting PIP2 to PIP3, PIP3 recruiting AKT to the membrane, PDK1 and mTORC2 activating AKT, and AKT promoting cell survival and growth via mTORC1, with PTEN shown as a negative regulator (inhibition bar) opposing PI3K. Label PI3K, PIP2, PIP3, PDK1, AKT, mTORC1, mTORC2, PTEN.

PI3K-AKT-mTOR receptor signaling pathway diagram showing PIP2 to PIP3 conversion, AKT activation, mTOR, and PTEN inhibition

Branching and cross-talk

  1. Draw an RTK activating two pathways at once: the MAPK/ERK cascade (proliferation) and the PI3K-AKT pathway (survival) branching from the same activated receptor, as two parallel downward arms from one membrane node.

How to get clean, accurate receptor signaling diagrams

  • Name every kinase in order. For MAPK, list "RAS → RAF → MEK → ERK"; the AI keeps the cascade in sequence.
  • Distinguish membrane events from nuclear events. Ask for "a labeled cell membrane and a labeled nuclear membrane" so receptor activation and transcription are visually separated.
  • Show second messengers explicitly. Name "cAMP," "IP3/DAG," or "PIP3" so the figure reflects the real signaling intermediate.
  • Mark negative regulators. Draw PTEN or a phosphatase with a flat-end inhibition bar so the brake reads correctly.
  • Iterate, don't restart. Refine with "make ERK the largest node" or "recolor the survival arm blue" instead of rewriting the prompt.

Common mistakes (and how to fix them)

  • Kinase cascade out of order. Fix: spell out the sequence — "RAS, then RAF, then MEK, then ERK" — in the prompt.
  • No receptor dimerization for RTKs. Fix: add "RTK dimerizes and autophosphorylates on ligand binding."
  • Second messenger omitted. Fix: name it explicitly ("adenylyl cyclase converts ATP to cAMP").
  • Branch points merged. Fix: ask for "two parallel arms from the same receptor node" so MAPK and PI3K-AKT read as distinct.
  • Garbled text (typical of generic image AI). Fix: SciDraw AI renders clean sans-serif labels — re-prompt the exact wording if needed.

Export and use your receptor signaling figure

Once the pathway looks right, export it to editable SVG or PowerPoint (PPTX), or download a high-resolution image for your manuscript, slides, or poster. Want more pathway prompts to adapt? See our signaling pathway diagram prompts. Need to fix a label or translate it? See how to edit text and labels in an AI figure.

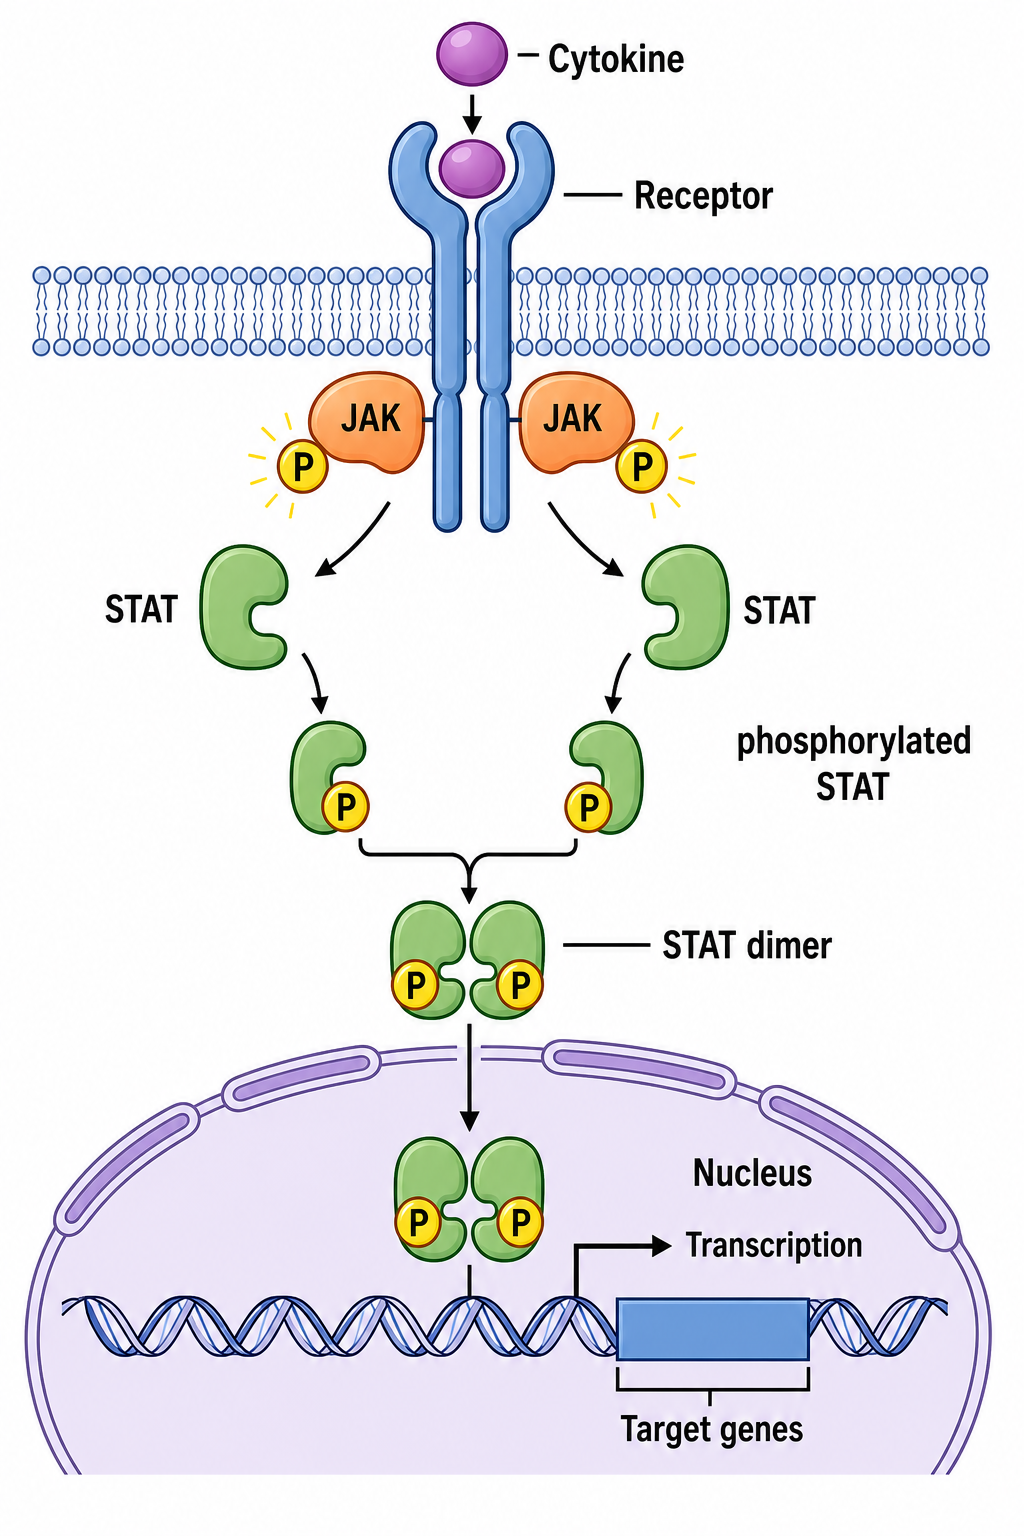
JAK-STAT receptor signaling diagram showing cytokine receptor activation, JAK phosphorylation, and STAT dimer nuclear translocation

Frequently asked questions

What is the best AI tool to draw a receptor signaling diagram? SciDraw AI's Signaling Pathway Diagram Generator produces publication-ready receptor signaling figures — GPCR cAMP signaling, RTK activation, MAPK/ERK, and PI3K-AKT-mTOR — with clean, accurate labels and editable export.

How do I draw the MAPK/ERK pathway correctly? Spell out the cascade in order — RTK → GRB2/SOS → RAS → RAF → MEK → ERK → nucleus — so the AI keeps the kinases in sequence. Use prompt #3 above as a starting point.

How do I show a GPCR second messenger like cAMP? Name the enzyme and the messenger explicitly: "adenylyl cyclase converts ATP to cAMP, which activates PKA." The AI will place and label the second messenger. Prompt #1 above does this.

Can I make a receptor signaling diagram for free? Yes — you can start generating GPCR and RTK signaling diagrams for free, then upgrade for more credits and editable SVG/PPTX export.

Is the receptor signaling figure accurate enough for publication? It is designed for publication-ready output, but always review the biology for your system — kinase order, second messengers, and inhibition arrows — and correct any labels before submitting.

Start creating

Pick any prompt above, paste it into the Signaling Pathway Diagram Generator, and refine it in the SciDraw AI editor until it matches your study. From GPCR cAMP signaling to the PI3K-AKT survival axis, your next receptor signaling figure is one sentence away.

AI Prompts
24 Signaling Pathway Diagram Prompts for Publication-Ready Figures (2026)
AI Prompts

24 Signaling Pathway Diagram Prompts for Publication-Ready Figures (2026)

Copy-paste AI prompts for cell signaling pathway diagrams — MAPK/ERK, PI3K-AKT-mTOR, Wnt, NF-κB, JAK-STAT, TGF-β, GPCR/cAMP, insulin, and p53 — plus a reusable prompt template, real examples, and tips for correct activation arrows, inhibition bars, and publication-ready results.

avatar for Davie Chen / SciDraw AI
Davie Chen / SciDraw AI
2026/06/17
Prompts for Sensor Schematics and Microfluidic Chip Diagrams
AI Prompts

Prompts for Sensor Schematics and Microfluidic Chip Diagrams

Copy-paste AI prompts and layout structure for drawing sensor schematics — electrochemical, fluorescent probe, electrode — and microfluidic chip diagrams like lab-on-a-chip, droplet, and organ-on-a-chip.

avatar for Davie Chen / SciDraw AI
Davie Chen / SciDraw AI
2026/07/05
How to Make an Apoptosis Pathway Diagram with AI (2026 Guide)
AI Prompts

How to Make an Apoptosis Pathway Diagram with AI (2026 Guide)

Draw a clean, labeled apoptosis pathway diagram with AI — intrinsic and extrinsic pathways, caspases, BCL-2 family, cytochrome c, and the apoptosome — using a reusable prompt template, real examples, and publication-ready export. No design software required.

avatar for Davie Chen / SciDraw AI
Davie Chen / SciDraw AI
2026/06/18
Explore Our Tools
Cell Illustration Generator·Biological Pathway Diagram Generator·Scientific Diagram Maker·Scientific Figure Maker