Créer une figure d'immunologie avec l'IA : guide pas à pas (2026)
Un guide pratique pour réaliser des figures d'immunologie prêtes à publier avec l'IA — du premier prompt à l'export. Workflow en quatre étapes, exemples concrets par domaine (vaccinologie, oncologie, auto-immunité) et conseils pour les figures de thèse et d'article.
Vous avez besoin d'une figure d'immunologie pour un chapitre de thèse, une demande de financement ou un manuscrit — et il faut qu'elle soit nette, légendée et juste. Ce guide est le mode d'emploi pas à pas : non pas une liste de prompts à copier, mais le workflow concret que vous suivez de la page blanche au fichier prêt à exporter. Vous apprendrez à planifier une figure, à la générer, à l'affiner par le dialogue, puis à la livrer — avec des exemples concrets tirés de vrais sous-domaines. Si vous voulez seulement des prompts à copier, voyez notre article complémentaire, 25 prompts de schémas d'immunologie ; ce guide-ci vous enseigne la méthode qui se cache derrière.
À la fin de ce guide, vous saurez :
Créer une figure d'immunologie avec l'IA en quatre étapes répétables — planifier, générer, affiner, exporter.
Adapter le workflow à votre propre domaine, qu'il s'agisse de vaccinologie, d'immunologie tumorale ou d'auto-immunité.
Produire des figures prêtes pour une thèse ou un article avec des légendes justes, des flèches cohérentes et une mise en page nette.
Corriger ce qui rend les illustrations d'immunologie générées par IA fausses, avant qu'elles n'arrivent sous les yeux d'un relecteur.
Tout le workflow se déroule dans l'éditeur SciDraw AI, l'espace de travail AI-native où votre figure est la toile et le langage courant est l'outil.
Toute bonne figure d'immunologie — anticorps, synapse, point de contrôle ou cascade — naît des mêmes quatre étapes. Apprenez-les une fois et vous pourrez tout dessiner dans ce domaine.
Planifiez la scène. Décidez du sujet, des protagonistes (cellules, récepteurs, molécules) et des relations (qui active ou inhibe qui). Notez-les avant de toucher à l'éditeur.
Davie Chen is a researcher at the Faculty of Animation and Intermedia, University of Arts in Poznan, studying generative AI for scientific figure creation, patent illustration, and manuscript drafting. SciDraw AI is one of the research-to-product tools built from this work.
Des milliers de chercheurs utilisent SciDraw AI pour créer en quelques minutes des figures prêtes à publier pour leurs articles, demandes de financement et soumissions — sans compétences en design.
Générez un premier jet. Transformez votre plan en une phrase descriptive qui nomme le sujet, les interactions, les légendes et le style.
Affinez par le dialogue. Ne recommencez pas — demandez à l'IA de recolorer, relégender, simplifier ou réorganiser l'image existante.
Exportez et placez. Téléchargez une image haute résolution ou un SVG/PPTX modifiable et déposez-la dans votre manuscrit, vos diapositives ou votre poster.
Modèle pour l'étape 2 : « Dessine [sujet] montrant [interactions]. Légende [cellules/récepteurs/molécules]. Utilise un style vectoriel plat et net, avec des flèches d'activation et des barres d'inhibition. »
La plus grande différence entre une figure qui fonctionne et une qui gaspille des crédits, c'est la planification. Avant de prompter, répondez à trois questions :
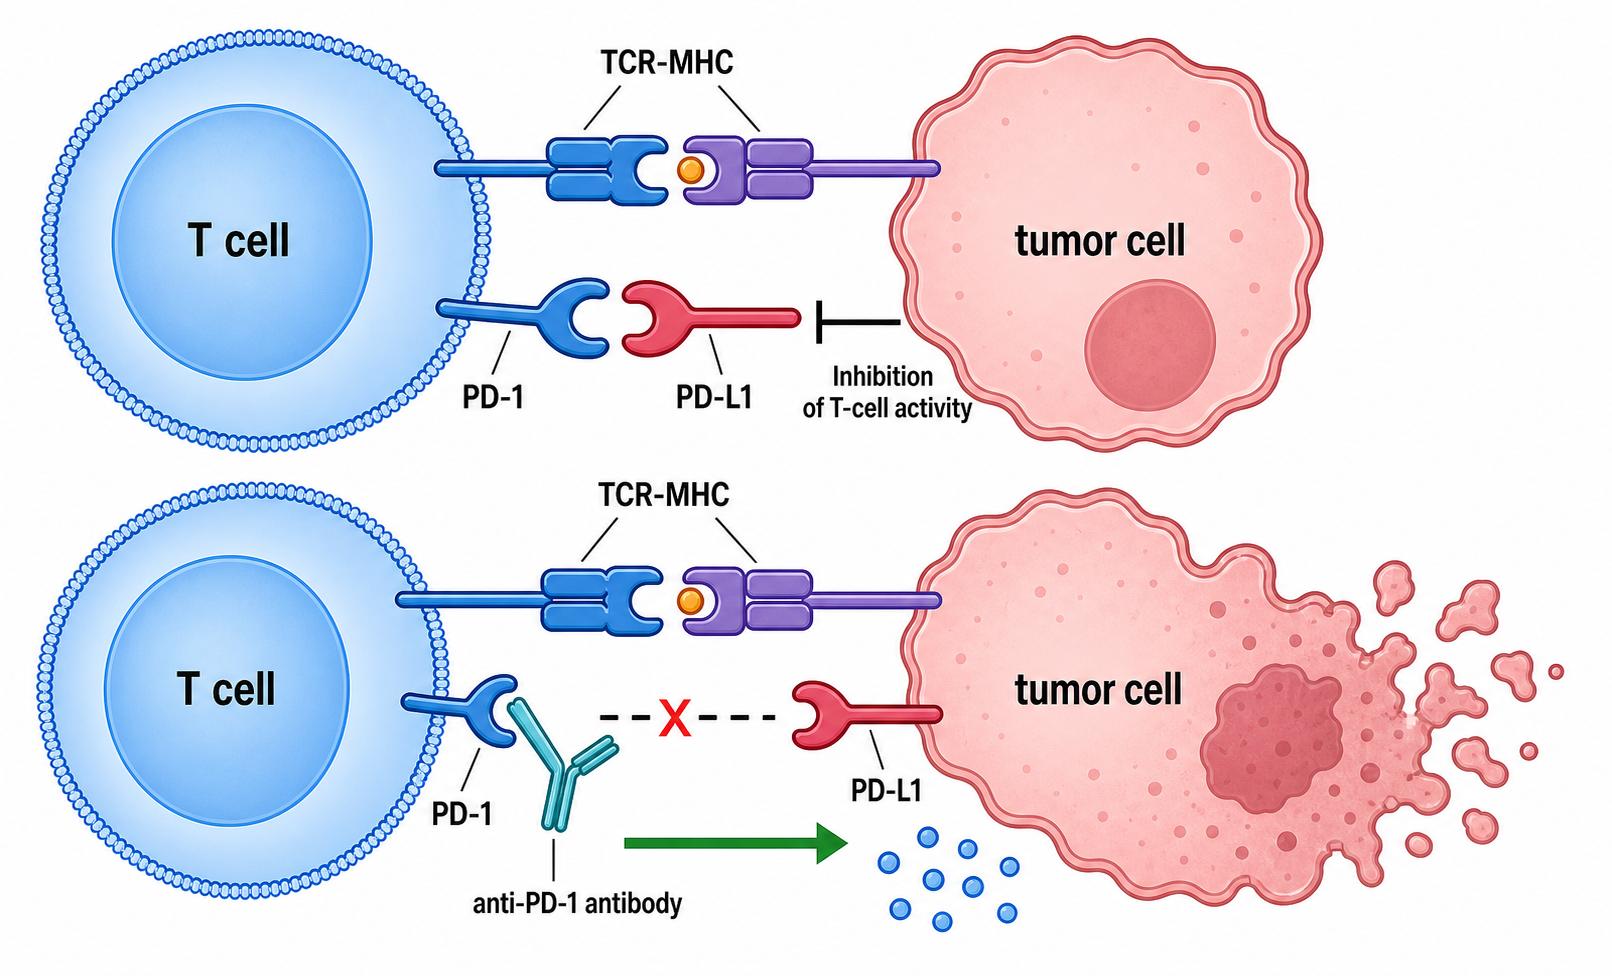
Quel est le message unique ? Une figure doit faire passer un seul point. « Le blocage de PD-1 restaure le pouvoir cytotoxique des lymphocytes T » est un message ; « tout sur les points de contrôle » n'en est pas un.
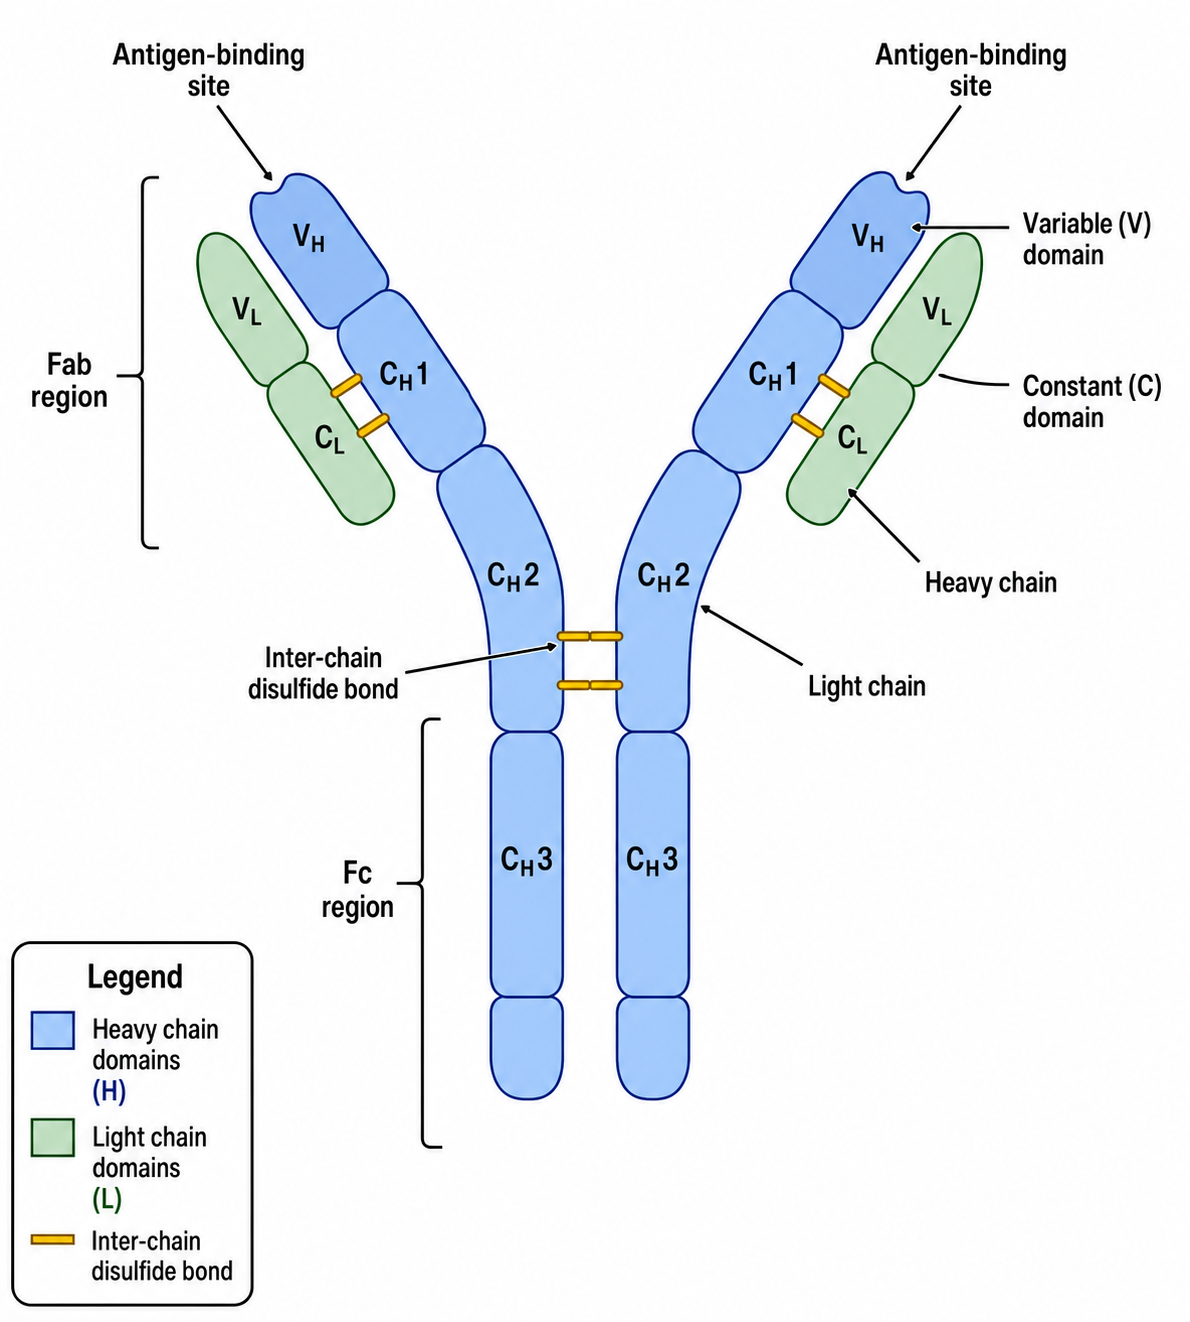
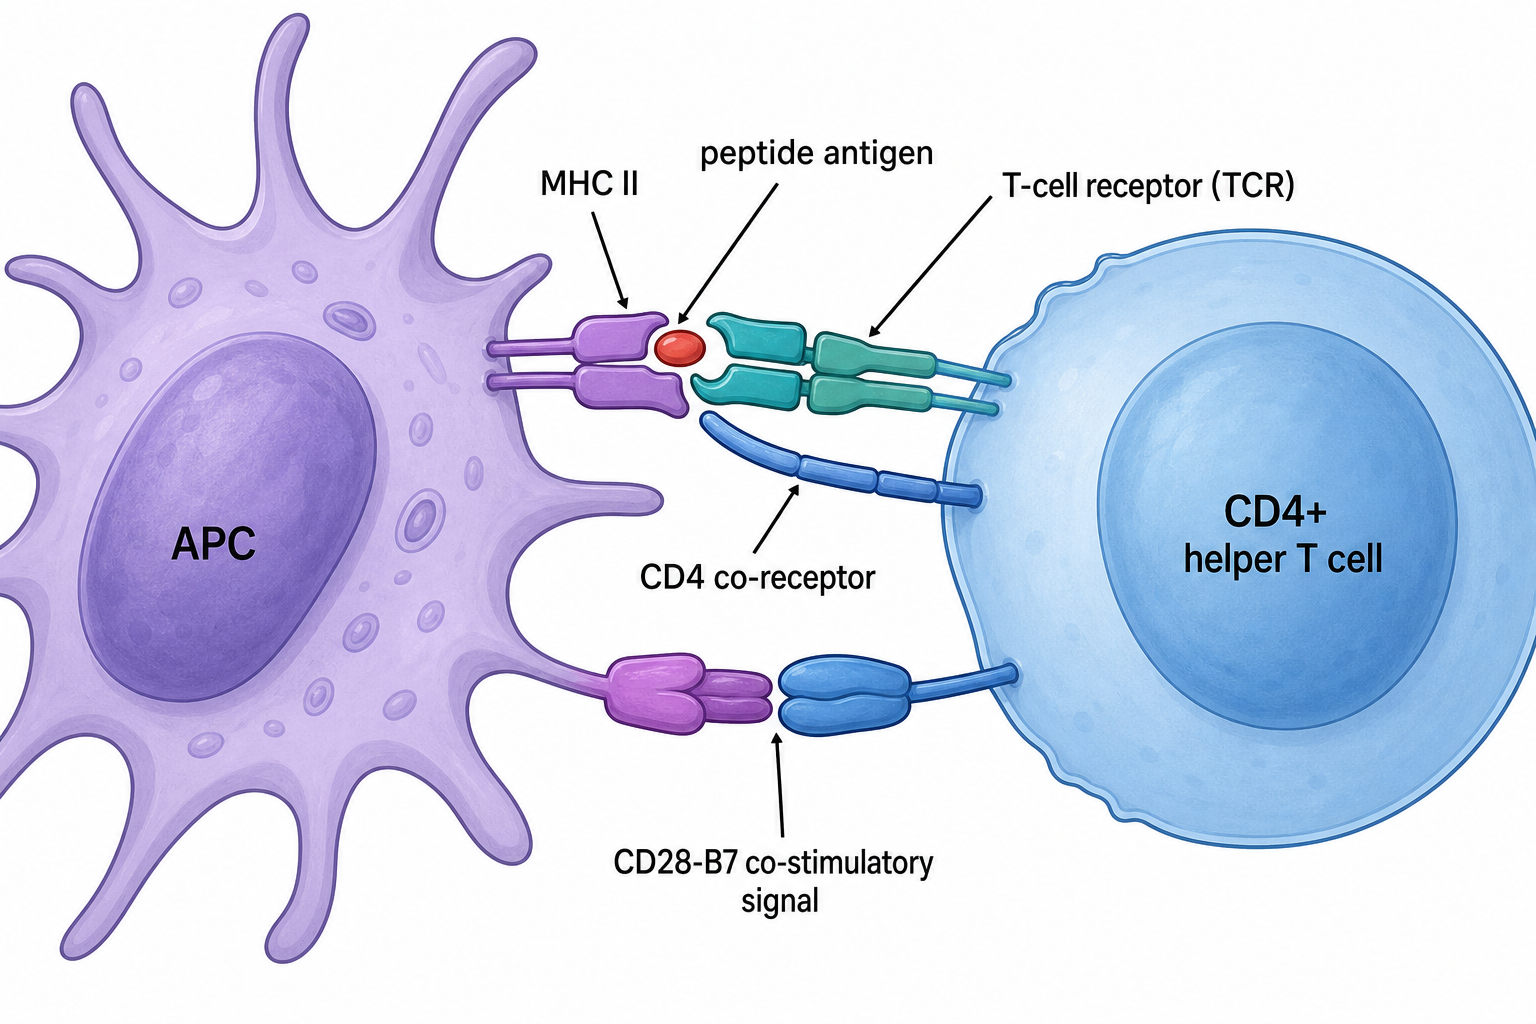
Qui est dans la scène ? Listez les cellules (cellule dendritique, lymphocyte T CD4+, cellule tumorale), les récepteurs (TCR, MHC II, PD-1, PD-L1) et les molécules (peptide, cytokines).
Quelles sont les relations ? Marquez chacune comme activation (flèche) ou inhibition (barre à extrémité plate), et notez le sens du flux.
Ce plan en trois parties devient le squelette de votre prompt. Nommer chaque élément est ce qui indique précisément à l'IA quoi légender — l'habitude la plus importante pour des figures d'immunologie exactes.
Transformez le plan en une phrase. Pour une figure de présentation antigénique, le plan (« une cellule dendritique présente un peptide sur le MHC II à un lymphocyte T CD4+ ; légender APC, MHC II, peptide, TCR, CD4, CD28-B7 ») devient un prompt net et un résultat net.
Les astuces qui font réussir le premier jet :
Nommez chaque élément à légender. L'IA légende ce que vous nommez.
Précisez le sens. Employez « flèche d'activation » et « barre d'inhibition » pour que la signalisation immunitaire se lise correctement.
Demandez une mise en page. « Vue de synapse à deux cellules » ou « flux de gauche à droite » garde les scènes denses organisées.
Gardez le texte dans la figure court. Mettez le détail dans la légende, pas dans le schéma.
Un premier jet est rarement définitif, et c'est très bien. L'avantage AI-native est que vous modifiez en décrivant le changement au lieu de redessiner. Affinements courants :
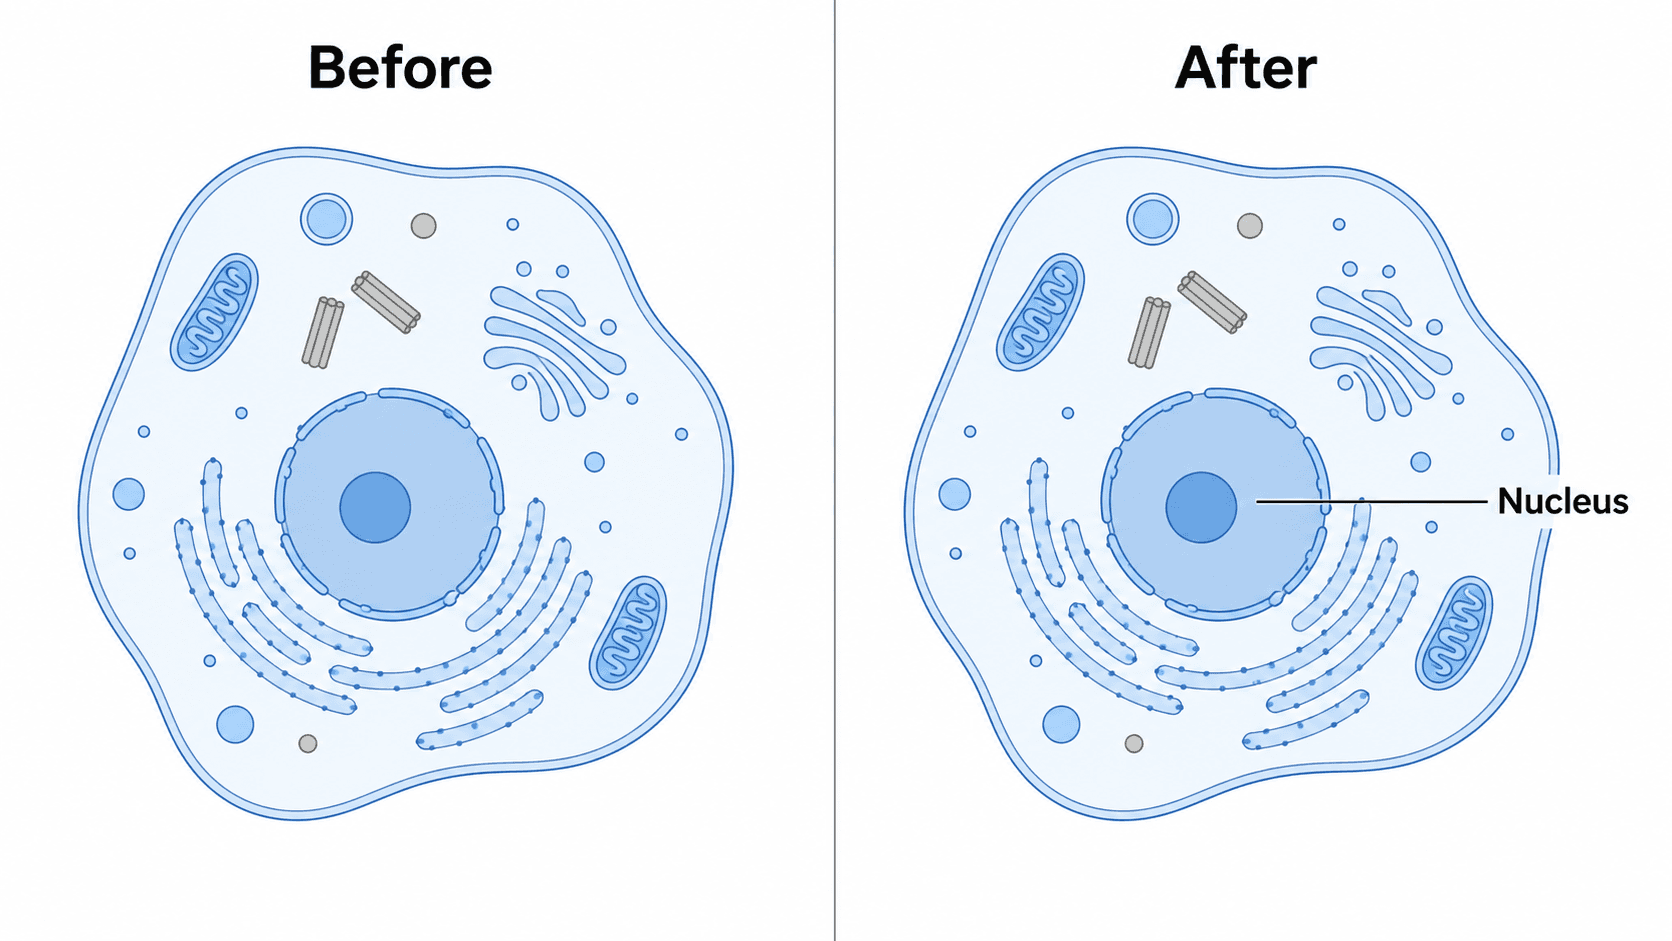
« Recolore le lymphocyte T CD4+ en bleu et la cellule tumorale en gris. »
« La légende "PDL1" doit dire "PD-L1". »
« Ajoute un anticorps anti-PD-1 bloquant l'interaction PD-1/PD-L1. »
« Simplifie aux trois étapes principales et supprime la légende. »
Chaque instruction modifie la figure existante sur place, vous ne perdez donc jamais les parties que vous aimez déjà. Pour aller plus loin sur les modifications de légendes seules, voyez comment modifier le texte et les légendes d'une figure IA.
Message : comment l'immunité se forme après une vaccination. Protagonistes : antigène, APC, lymphocyte T auxiliaire, lymphocyte B, anticorps, cellules mémoire. Flux : de gauche à droite. Promptez la capture de l'antigène, l'activation des lymphocytes T et B, la production d'anticorps et la formation de la mémoire — puis affinez pour mettre en valeur l'étape mémoire si c'est votre point. Pour les vaccins à ARNm, ajoutez au plan « livraison par nanoparticule lipidique et traduction de l'antigène spike ».
Message : comment un traitement lève le frein immunitaire. Protagonistes : lymphocyte T, cellule tumorale, PD-1, PD-L1, anticorps anti-PD-1. Relations : inhibition PD-1–PD-L1 (barre), blocage restaurant la cytotoxicité (flèche). C'est la figure de point de contrôle ci-dessus ; pour les CAR-T, replanifiez les protagonistes en un lymphocyte T modifié, un récepteur antigénique chimérique et un antigène tumoral dans un flux de gauche à droite.
Message : comment une cascade de cytokines entraîne l'inflammation tissulaire. Protagonistes : macrophage, TLR, agent pathogène ou auto-antigène, TNF-α, IL-6, IL-1β, neutrophiles recrutés. Planifiez l'étape de reconnaissance, la libération de cytokines et le recrutement, puis affinez les couleurs pour regrouper les médiateurs pro-inflammatoires.
Les figures de thèse et de revue ont des contraintes supplémentaires. Intégrez-les :
Respectez la largeur de colonne de la revue. Planifiez une figure sur une colonne comme une mise en page haute et simple ; une figure sur deux colonnes peut être une vue multi-panneaux synapse-plus-cascade. Générez en haute résolution.
Utilisez des lettres de panneau. Demandez à l'IA d'« ajouter une lettre de panneau "A" en haut à gauche » pour que la figure s'insère dans une figure composite.
Gardez les légendes dans la figure au minimum. Les relecteurs veulent le détail dans la légende. Pour aider à la rédiger, notre article de prompts complémentaire liste les éléments à nommer.
Restez cohérent entre les chapitres. Réutilisez le même code couleur et le même style de flèche pour chaque figure d'immunologie du document, afin que la thèse parle d'une seule voix.
Sauter le plan et trop prompter. Solution : écrivez d'abord le plan en trois parties ; un prompt ciblé bat un paragraphe.
Récepteurs non légendés ou mal légendés. Solution : nommez les termes exacts (« légender PD-1, PD-L1, TCR, MHC I ») et re-promptez des corrections comme « change "PDL1" en "PD-L1" ».
Activation et inhibition peu claires. Solution : demandez explicitement « des flèches d'activation et des barres d'inhibition à extrémité plate ».
Figure surchargée. Solution : demandez de « simplifier aux étapes principales » ou découpez en panneaux — un message par figure.
Recommencer au lieu d'affiner. Solution : modifiez l'image existante avec des instructions ciblées pour que les parties que vous aimez restent en place.
Texte illisible des IA d'images génériques. Solution : SciDraw AI rend des légendes sans-serif nettes ; re-promptez le libellé exact si un terme paraît bancal.
Quand la figure est juste, exportez-la en SVG modifiable ou en PowerPoint (PPTX), ou téléchargez une image haute résolution pour votre manuscrit, vos diapositives ou votre poster. Besoin d'une palette adaptée au daltonisme pour la version publiée ? Voyez comment recolorer un schéma scientifique. Vous voulez une bibliothèque de points de départ prêts à l'emploi plutôt que de partir de zéro ? Parcourez les 25 prompts de schémas d'immunologie et déposez n'importe lequel dans l'éditeur.
Comment créer une figure d'immunologie avec l'IA ?
Planifiez la scène (sujet, cellules, relations), décrivez-la en une phrase dans le générateur de schémas d'immunologie, affinez le résultat par le dialogue, puis exportez. Ce workflow en quatre étapes produit des figures prêtes à publier sans logiciel de conception.
Quelle est la meilleure façon de dessiner un schéma d'immunologie pour une thèse ?
Planifiez un message unique par figure, générez en haute résolution pour correspondre à la largeur de colonne de votre revue, ajoutez des lettres de panneau pour les composites, et réutilisez un seul code couleur et un seul style de flèche dans tous les chapitres pour que la thèse soit cohérente.
Puis-je créer des figures d'immunologie pour un article gratuitement ?
Oui — vous pouvez commencer à générer des figures d'immunologie gratuitement dans l'éditeur SciDraw AI, puis passer à une offre supérieure pour plus de crédits et l'export SVG/PPTX modifiable pour votre manuscrit.
Comment corriger une légende erronée dans une figure d'immunologie IA ?
Ne redessinez pas — citez le texte actuel et la correction, comme « change "PDL1" en "PD-L1" », et l'IA ne modifie que cette légende en conservant la mise en page, les couleurs et les flèches intactes.
Un générateur de figures d'immunologie par IA est-il une bonne alternative à BioRender ?
Si vous préférez décrire une figure plutôt que glisser des icônes sur une toile, un générateur IA est une alternative rapide et économique pour les schémas d'anticorps, de présentation antigénique, de lymphocytes T, de points de contrôle et de vaccins, avec un export modifiable pour vos collaborateurs.
Ouvrez le générateur de schémas d'immunologie, écrivez votre plan en trois parties, et transformez-le en figure dans l'éditeur SciDraw AI. Des structures d'anticorps au blocage des points de contrôle, votre prochaine figure de thèse ou d'article n'est qu'à un workflow de distance.