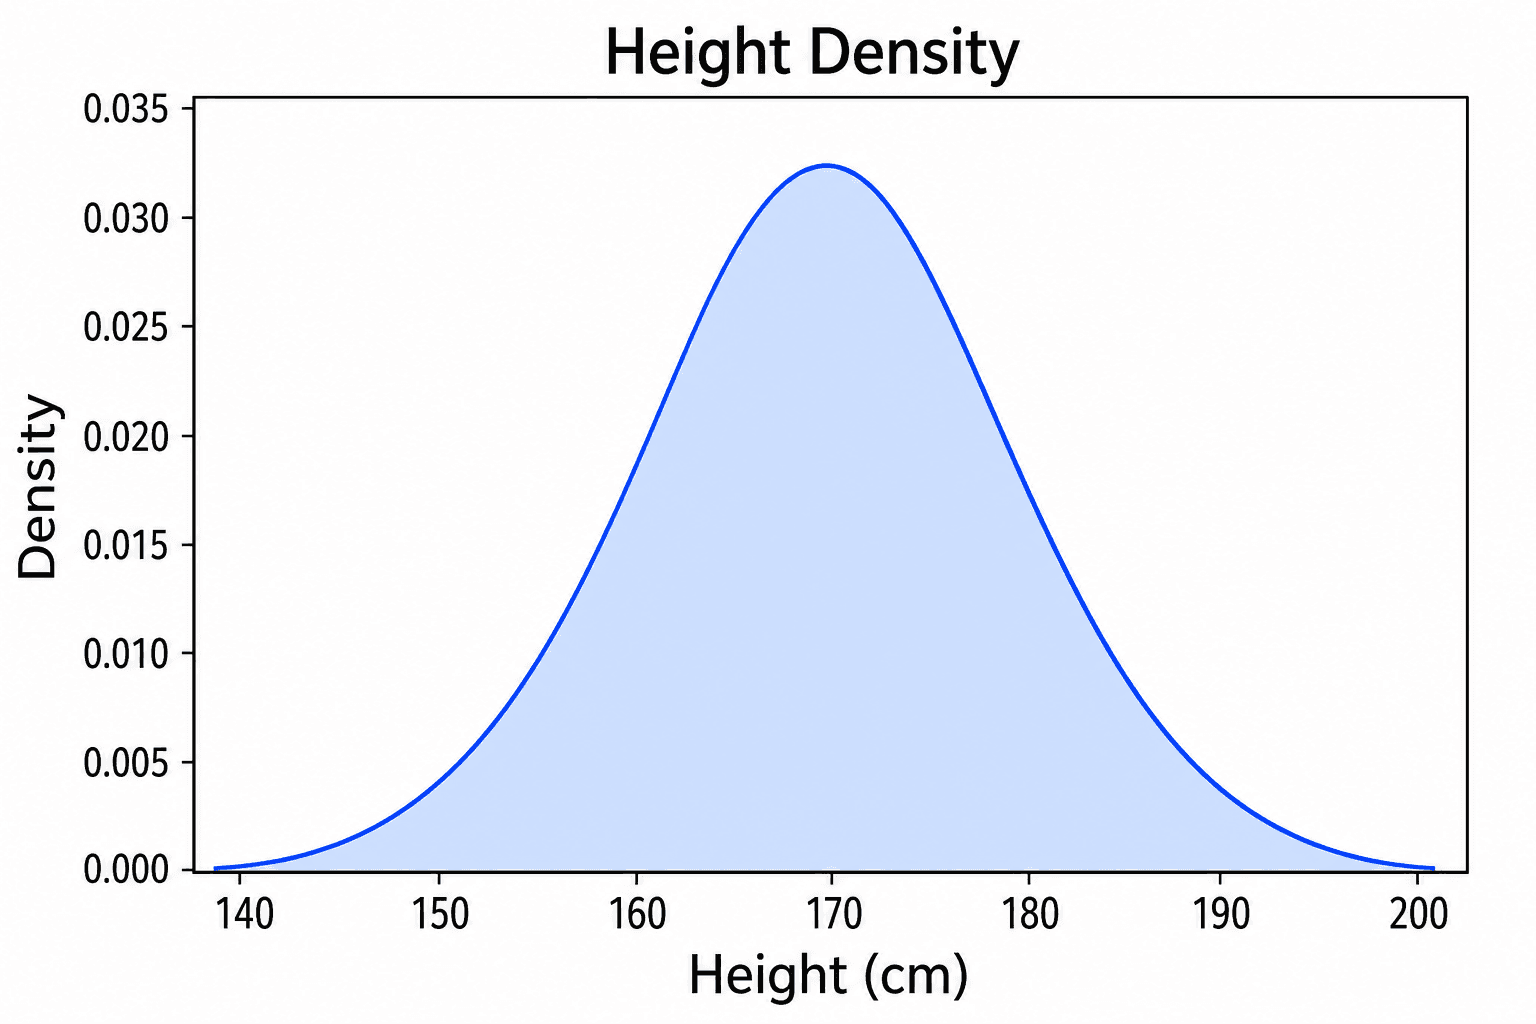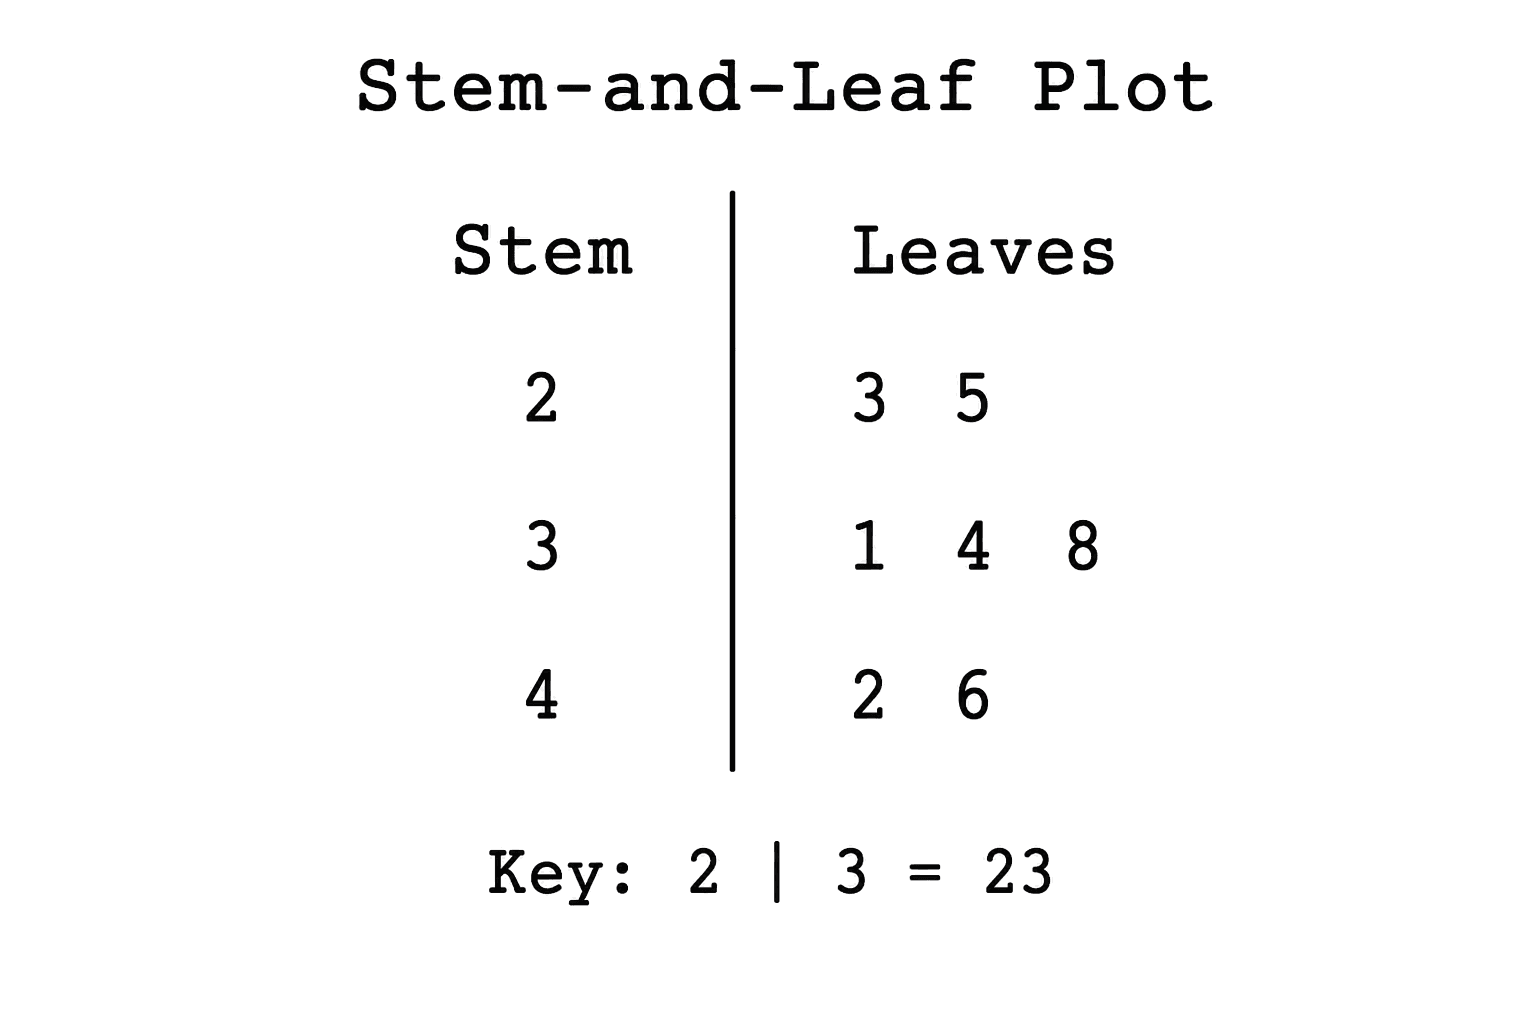
Le diagramme en tiges et feuilles (ou stem-and-leaf plot) présente l'avantage de conserver chaque valeur individuelle, contrairement à un histogramme qui regroupe les données par classes. Cette force constitue également sa principale limite : la représentation devient rapidement illisible sur de grands ensembles de données, et une unité de tige mal définie peut multiplier ou diviser par dix la perception des valeurs réelles. Il convient donc de fixer l'échelle et de cibler son public avant de finaliser cette figure scientifique.
Le générateur de diagramme en tiges et feuilles de SciDraw convertit un fichier de données structurées en un affichage ordonné, puis l'ouvre dans SciVis pour en affiner l'aspect visuel. Les modèles intégrés proposent des configurations de base, décimales, groupées, dos à dos (back-to-back), à double chiffre ou avec légende explicite.
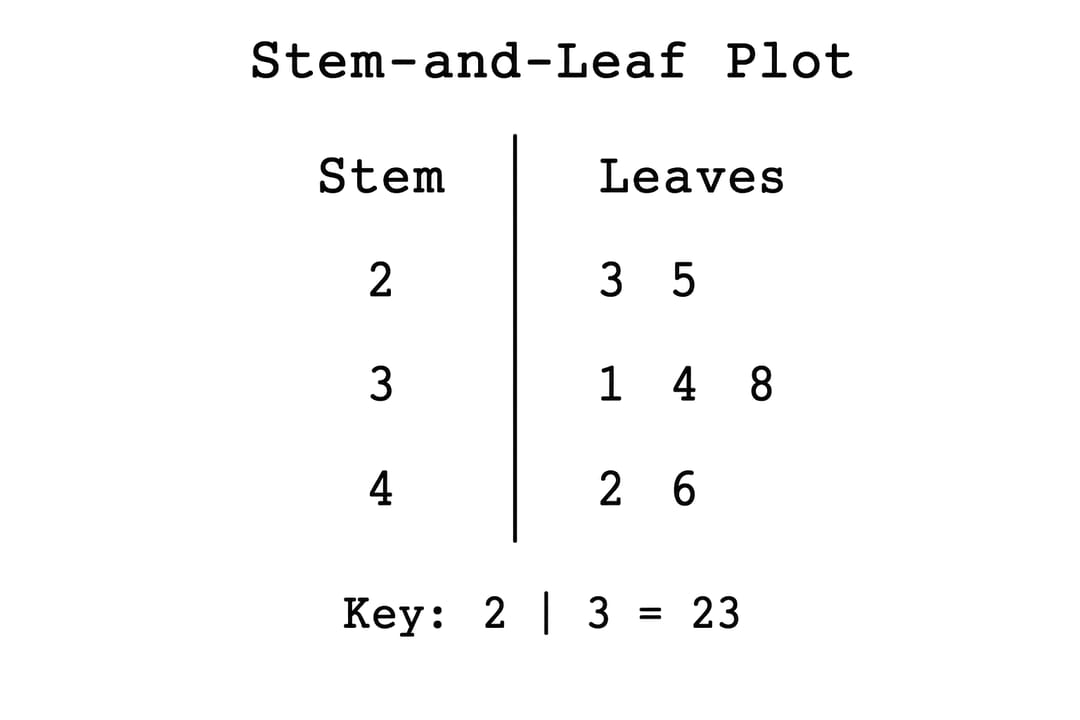
Erreurs fréquentes lors de la construction
- Omettre la légende (clé de lecture) : le lecteur doit impérativement disposer d'une indication claire telle que
4 | 7 = 47ou4 | 7 = 4.7. - Choisir une unité de tige inadaptée : un nombre trop restreint de tiges masque la structure de la distribution ; un nombre excessif crée un affichage vide et illisible.
- Ignorer les feuilles répétées : les valeurs identiques doivent apparaître autant de fois qu'elles ont été observées, chaque feuille représentant une mesure unique.
- Mélanger des unités incompatibles : l'ensemble des données doit partager la même unité de mesure et la même convention décimale.
- Utiliser un volume de données trop important : un histogramme, un diagramme de densité ou une fonction de répartition empirique (ECDF) s'avèrent bien plus lisibles dès que l'échantillon atteint des centaines ou des milliers d'observations.
Structure des données requise
Le fichier doit comporter une ligne par observation :
| Colonne | Rôle | Exemple |
|---|---|---|
observation_id | Identifiant unique de la ligne | 1-01 |
value | Mesure numérique | 48 |
group | Groupe de comparaison (facultatif) | All observations |
Vous pouvez consulter notre exemple CSV de base ou notre exemple CSV dos à dos. Veillez à exclure les symboles d'unités et les annotations textuelles de la colonne contenant les valeurs numériques.
Étape 1 : Évaluer la taille du jeu de données
Ce type de diagramme est idéal pour les échantillons de taille petite à modérée, lorsqu'il est scientifiquement pertinent de donner à voir chaque mesure brute. Il convient parfaitement aux démonstrations pédagogiques, au suivi de lots en contrôle qualité, aux séries de mesures cliniques restreintes ou aux analyses exploratoires rapides. Si le nombre de lignes compromet la mise en page de la figure, privilégiez notre générateur d'histogramme ou notre générateur de courbe ECDF.
Étape 2 : Importer les données CSV ou Excel
Accédez au générateur de diagramme en tiges et feuilles, sélectionnez un exemple ou importez votre fichier au format CSV, TSV, TXT, XLSX ou XLS. L'importateur Excel traite la première feuille de calcul. Veillez à supprimer les totaux, les cellules fusionnées, les notes de bas de page et tout texte parasite de la colonne de mesure numérique.
Étape 3 : Configurer l'unité de la tige et valider la légende
Générez le graphique et procédez à la reconstruction manuelle de quelques valeurs de test. Si la légende indique 12 | 4 = 12.4, la feuille 4 représente alors le chiffre des dixièmes. Portez une attention particulière aux valeurs négatives, aux décimales et aux mesures s'étendant sur plusieurs ordres de grandeur.
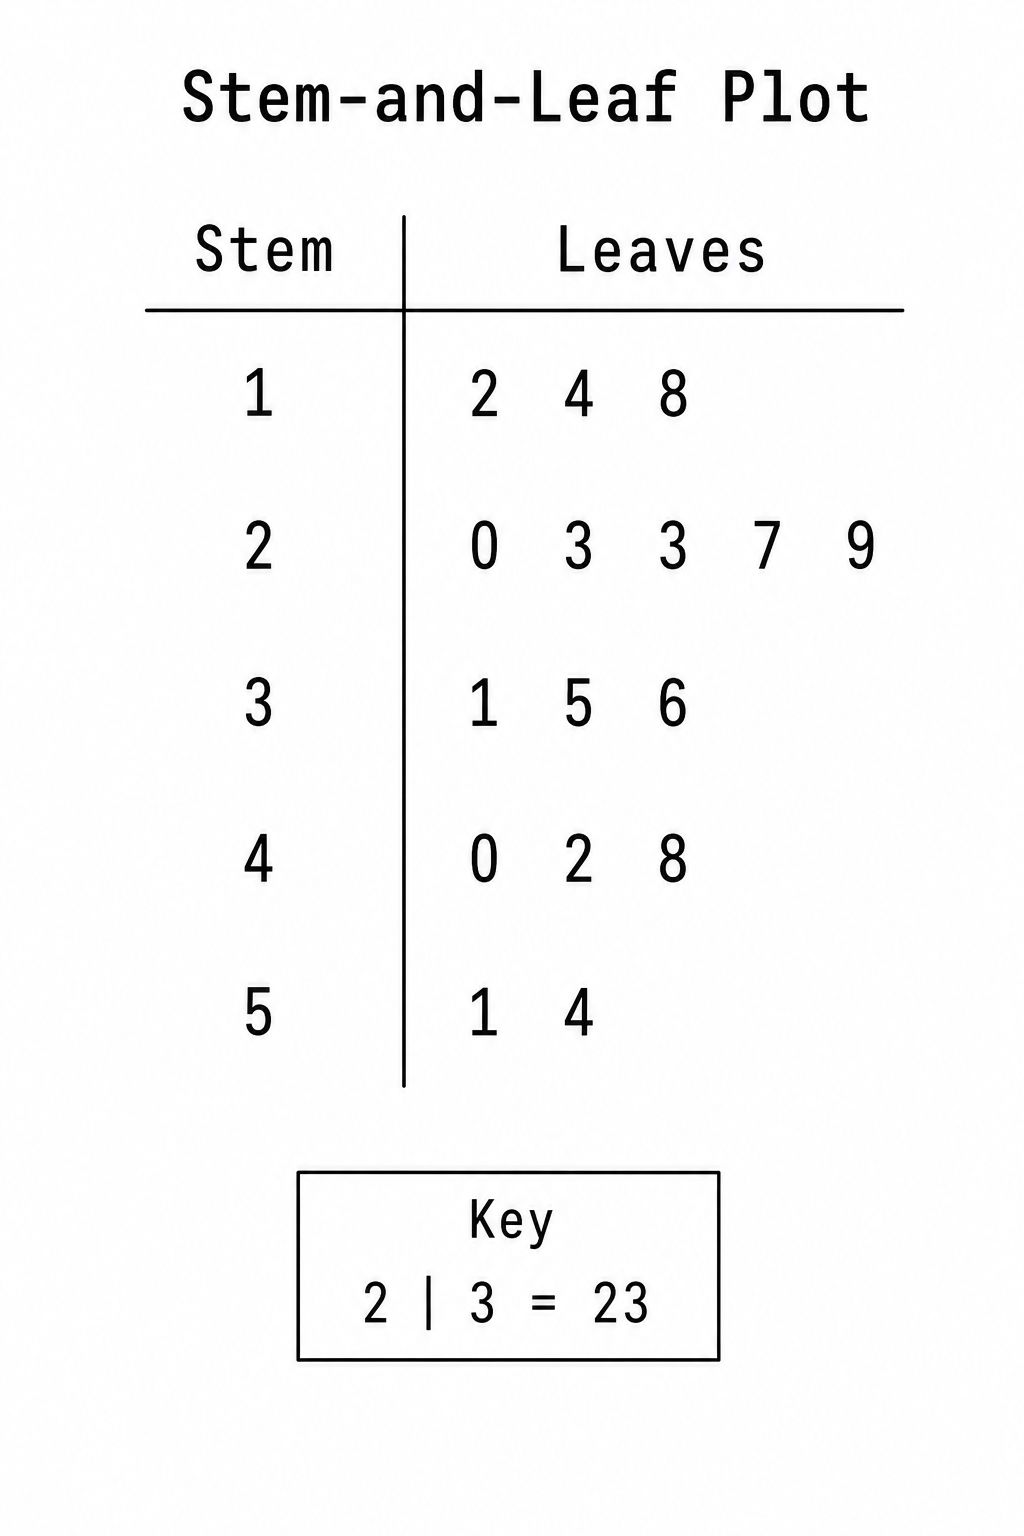
Les feuilles doivent normalement être triées par ordre croissant au sein de chaque tige. La répétition de feuilles identiques est normale et indispensable pour refléter la fréquence des observations. Les tiges vides peuvent être conservées si elles mettent en évidence un vide significatif dans la distribution, mais un excès de lignes vides nuit à la compacité de la figure.
Étape 4 : Comparer les groupes avec rigueur
Un diagramme en tiges et feuilles dos à dos (back-to-back) positionne deux groupes de part et d'autre d'un tronc commun de tiges. Cette disposition permet de comparer visuellement la tendance centrale, la dispersion et les écarts tout en conservant l'accès direct aux données brutes.
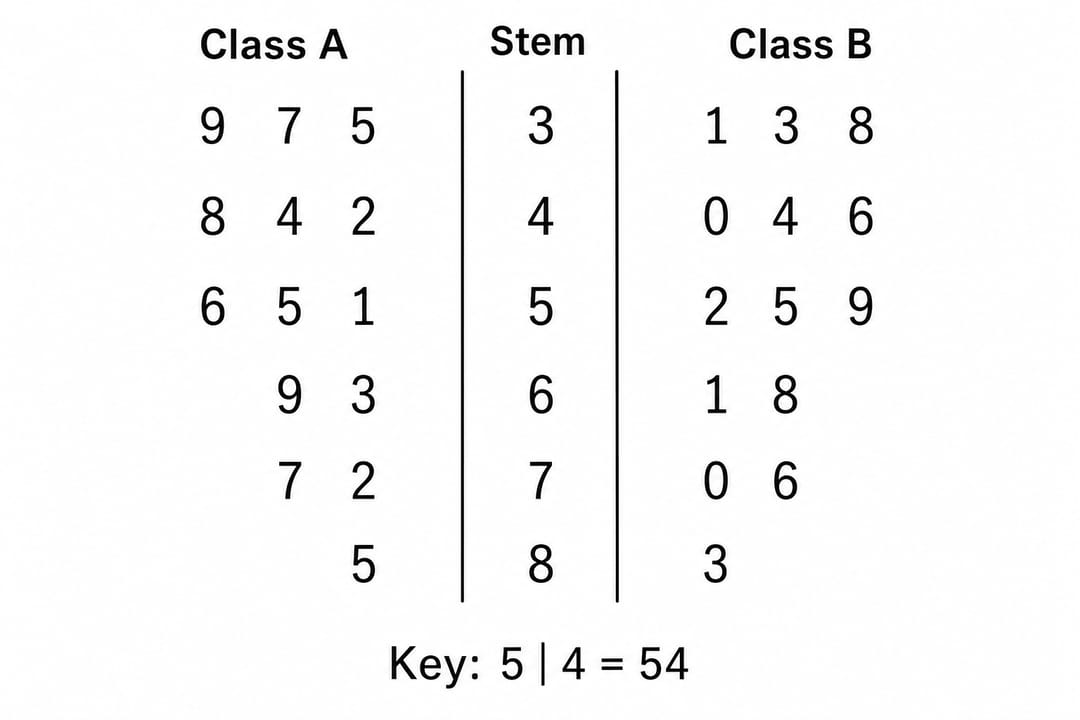
Utilisez impérativement la même unité de tige pour les deux côtés et explicitez le sens de lecture de chaque groupe. Basculez ensuite dans SciVis pour ajuster les espacements, les titres, la légende et les annotations sans altérer les données d'origine.
Comment interpréter ce diagramme ?
La tige regroupe le ou les premiers chiffres significatifs (les chiffres de poids fort) ; chaque feuille fournit le chiffre suivant selon l'échelle définie par la légende. L'analyse visuelle de la distribution repose sur les points suivants :
- Identifier la zone de concentration principale des feuilles.
- Évaluer l'étendue des valeurs, des plus petites aux plus grandes.
- Observer la symétrie ou l'asymétrie de la distribution.
- Repérer d'éventuels vides, regroupements ou valeurs atypiques isolées.
- Vérifier si les écarts entre les groupes se maintiennent sur une même échelle.
Cette représentation décrit l'échantillon de manière exploratoire. Elle ne permet pas de prouver la normalité d'une distribution, de qualifier formellement une donnée d'aberrante ou de tester statistiquement une différence entre des groupes.
Diagramme en tiges et feuilles ou histogramme ?
- Privilégiez le diagramme en tiges et feuilles pour les petits volumes de données lorsque le lecteur doit pouvoir extraire la valeur exacte de chaque point.
- Utilisez un histogramme lorsque l'effectif des classes et la forme générale de la distribution importent plus que les valeurs individuelles.
- Choisissez une boîte à moustaches (box plot) pour comparer de manière synthétique la médiane, les quartiles et les valeurs aberrantes potentielles.
- Optez pour un diagramme en essaim d'abeilles (beeswarm plot) si vous souhaitez que chaque point reste visible au sein d'une mise en page plus moderne et flexible pour la publication.
Questions fréquentes
Est-il possible de générer ce diagramme sans faire les calculs à la main ?
Oui. Il vous suffit de charger votre fichier de données dans le générateur de diagramme en tiges et feuilles, de vérifier l'échelle ainsi que la légende, puis de personnaliser le rendu visuel dans SciVis.
Comment traiter les valeurs décimales ?
Définissez une échelle de tige et de feuille qui préserve la précision requise par vos mesures, puis explicitez-la clairement dans la légende. Évitez d'arrondir les décimales de manière arbitraire si elles présentent un intérêt scientifique.
Le diagramme accepte-t-il les valeurs négatives ?
Oui, à condition que le signe, l'ordre des feuilles et la légende de lecture soient parfaitement univoques. Reconstituez manuellement quelques valeurs négatives à partir du graphique final avant de l'exporter.
À partir de quelle taille d'échantillon le diagramme devient-il inadapté ?
Il n'existe pas de seuil absolu. Dès que les lignes de feuilles deviennent trop denses, qu'elles se replient sur elles-mêmes ou qu'elles empêchent une comparaison rapide des tiges, il est recommandé de passer à un histogramme, une courbe ECDF ou un diagramme de densité.
Créer la figure
Commencez par importer vos données dans le générateur de diagramme en tiges et feuilles, validez la reconstruction de quelques valeurs de test, et consultez notre guide de visualisation des données scientifiques si votre jeu de données nécessite un graphique plus adapté aux grands volumes.