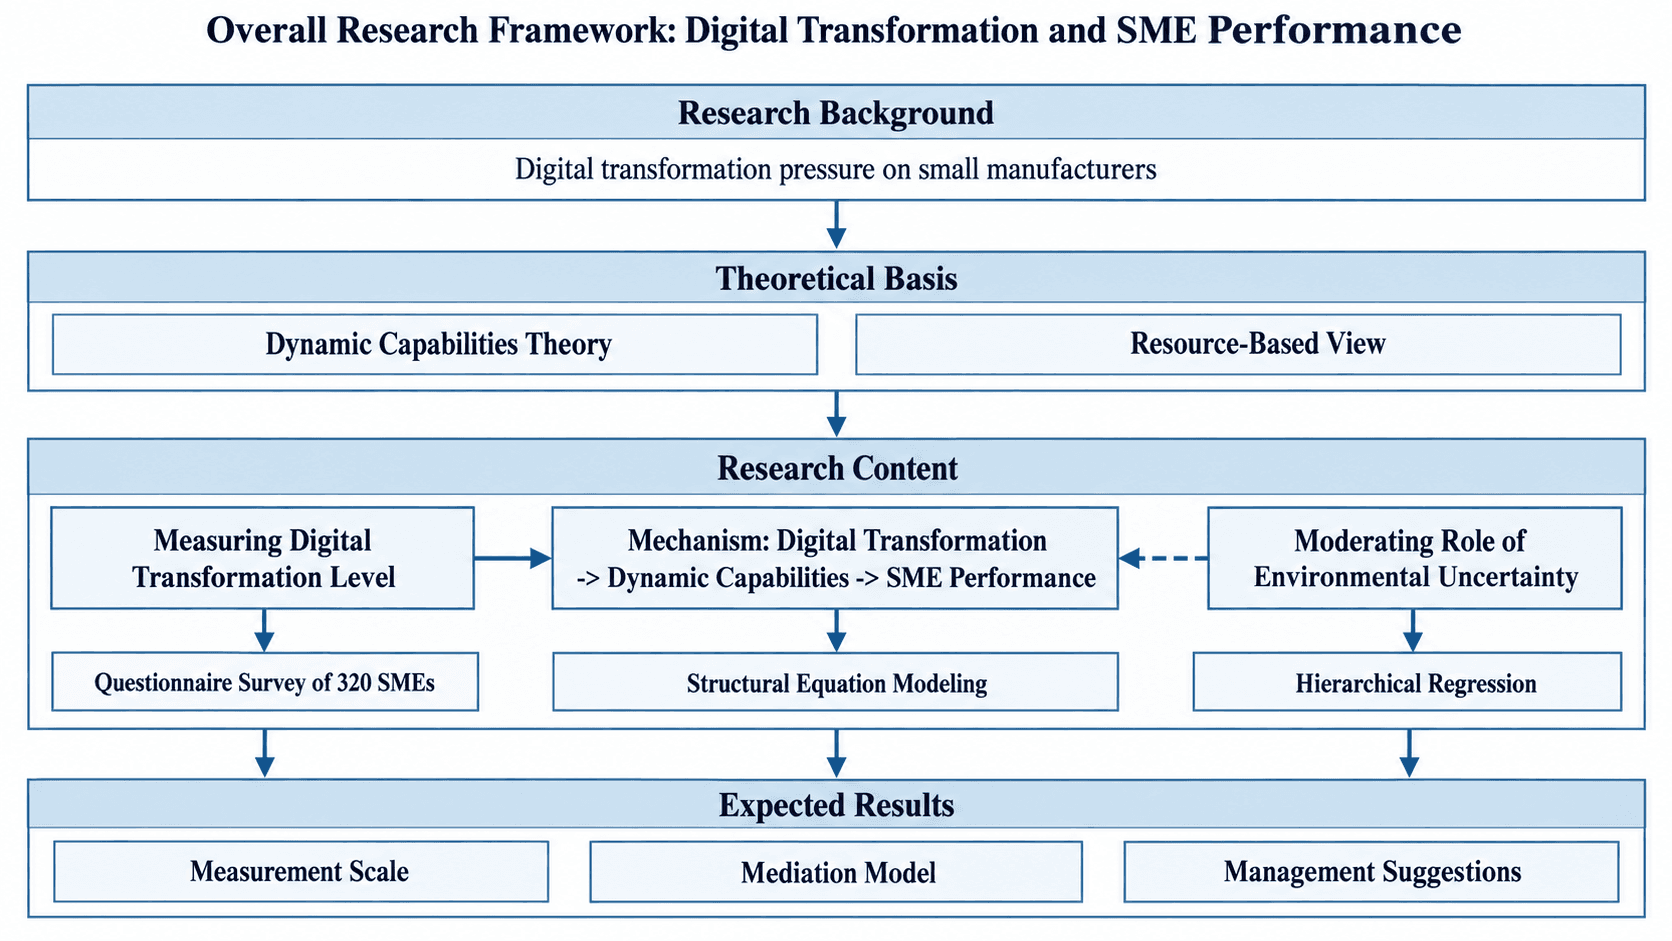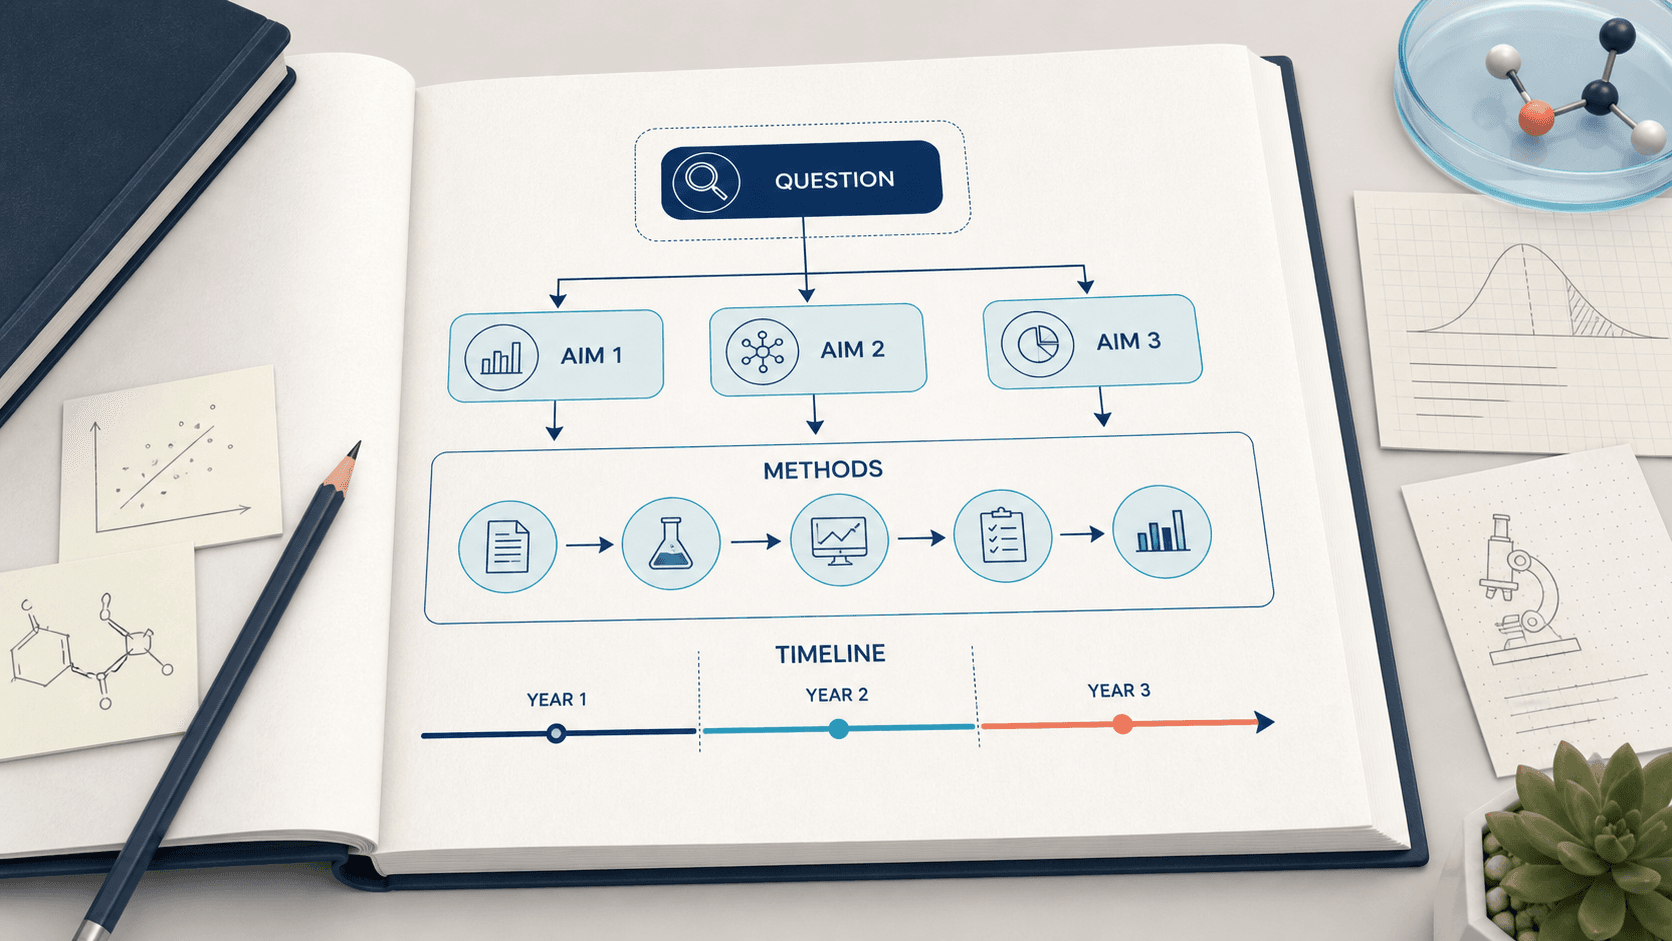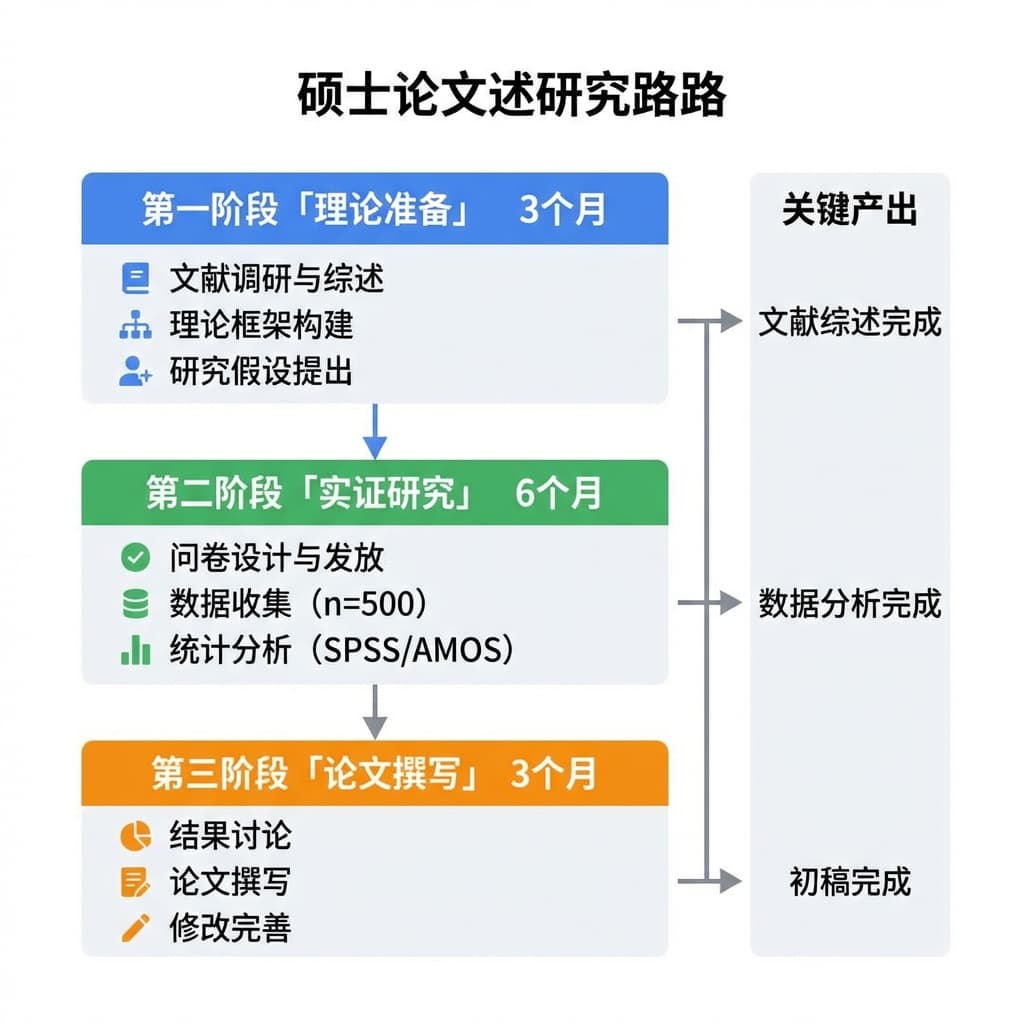
Your proposal says “plant growth.” Your spreadsheet contains a single height measurement. Your figure is labelled “growth rate.” Those three expressions describe different things, and a polished diagram cannot make them interchangeable.
A definition of terms in research explains what the important words mean in your study. For anything you measure or classify, it also states the rule you actually use. The aim is to let a reader follow the same meaning from the research question through the methods to the table or figure.
This guide includes an original worked example, a definition-of-terms template, and a way to check your figure labels against your methods. The numerical settings below are hypothetical teaching choices, not experimental findings or recommended protocols.
A definition of terms example you can understand immediately
Suppose a project compares seedlings grown under different daily lighting schedules. “Growth” might mean taller stems, more leaves, or greater dry mass. Choose the outcome that answers your question, then name it accurately.
| Term | Meaning in the project | How it is recorded | Suitable figure label |
|---|---|---|---|
| Daily light duration | Time that the study lamp is on each day | Timer log, expressed in hours per 24-hour cycle | Light duration (h/day) |
| Seedling height | Vertical distance from the substrate surface to the shoot apex | Ruler measurement in millimetres, using the stated protocol on day 14 | Seedling height on day 14 (mm) |
| Change in seedling height | Difference between two height measurements on the same seedling | Day 14 height minus day 0 height, in millimetres | Height change, day 0–14 (mm) |
The second row is an endpoint. The third is a change. Neither should silently become “growth rate”: a rate needs a time denominator and an explanation of how it was calculated. Height is also only one aspect of growth; it does not establish overall plant health.
You can write one entry as a paragraph:
Change in seedling height. In this study, change in seedling height refers to the increase or decrease in vertical height between the two specified observations. It is calculated for each seedling as height on day 14 minus height on day 0, measured in millimetres from the substrate surface to the shoot apex. Both measurements follow the same measurement protocol.
For a real study, give the protocol, timing, sampling rules and any relevant methodological source. Do not adopt these example settings simply because they appear in a template.
Fix these mistakes before writing more definitions
- Using the term to explain itself. “Engagement means being engaged” does not tell a reader what you observed.
- Treating an easy measurement as the whole concept. Attendance can be one indicator of participation; it does not automatically capture attention, motivation or learning.
- Inventing a cut-off. A label such as “high stress” needs a justified instrument and classification rule. Do not ask an AI tool to invent one.
- Changing terminology between text and graphics. A day-14 measurement must remain a day-14 measurement in the axis label and caption.
- Adding a dictionary for the entire paper. Explain terms whose interpretation affects the question, sample, measurement, coding or conclusions. Ordinary words do not need entries just to make the section longer.
Conceptual vs operational definitions
A conceptual definition describes the idea you are studying. An operational definition describes how that idea is measured or identified in this particular project. This distinction is explained in the open textbook Research Methods in Psychology.
| Question | Conceptual definition | Operational definition |
|---|---|---|
| What does it establish? | The meaning and boundaries of the concept | The observation, instrument, calculation or classification rule |
| What supports it? | Relevant theory and literature | Your protocol, data source and measurement decisions |
| Original example | Repeated use of a scientific drawing tool | Number of distinct days with at least one completed export during a specified 28-day period |
| What remains to justify? | Why this meaning fits the research question | Why that indicator adequately represents the concept |
The product-use example is illustrative, not a report of SciDraw AI user behaviour. A precise export count could still miss useful activity, such as editing without exporting. Precision makes a measurement explicit; it does not by itself prove validity.
For established concepts, locate an appropriate disciplinary source rather than copying a general dictionary entry. When you adapt a published scale or procedure, identify the version and explain the adaptation.
How to write a definition of terms section
1. Select the terms that affect interpretation
Read your research question, inclusion criteria and planned analysis. Mark concepts that could reasonably be understood in more than one way. Include a specialised population label or technical term when a different interpretation would change who or what enters the study.
There is no universal number of terms. A short project may need a few carefully chosen entries; a complex study may need more. Let the research and your institution's requirements determine the list.
2. Establish the meaning before choosing a convenient measure
Write one sentence explaining each concept and its boundaries. Find a scholarly source where appropriate. If two authors use different meanings, state which interpretation your study adopts and why.
Do not quietly redefine a broad construct to match the only column available in your spreadsheet. If your data measure attendance, call the outcome attendance unless you can justify a broader claim.
3. Specify the observation rule
For a measured variable, record the instrument or source, unit, observation period and calculation. For a category, record inclusion and exclusion criteria. For a derived score, specify how its components are combined.
Keep handling of missing observations explicit in the methods. A missing day-14 measurement is not automatically zero height change. If a rule is still undecided at proposal stage, mark it as a decision to resolve rather than writing it as an established method.
4. Write an entry another researcher can apply
Use the following sentence pattern as a drafting aid:
[Term] refers to [meaning and boundaries, with source where needed].
In this study, it is [measured / classified / identified] using [source
or procedure], for [population or material], during [time window].
Values are reported as [unit or categories], calculated using [rule].
Delete fields that do not fit your design. A qualitative theme does not need a numerical unit merely to fit the pattern.
5. Check the terminology against the finished figure
Compare each definition with the corresponding dataset column, table heading, diagram node, axis and caption. Spell out unfamiliar abbreviations where readers first encounter them. If the figure needs a shorter label, retain the exact measurement details in its caption.
Copyable definition-of-terms template
Use this table in your proposal notes before converting it to the format your supervisor requests. It is a working template, not a universal university format.
| Field | What to enter |
|---|---|
| Term | The name used consistently in the question and results |
| Conceptual meaning | What the concept includes and excludes |
| Supporting source | Relevant theory, instrument or protocol; leave a research note if not yet verified |
| Operational rule | What is measured, observed, classified or coded |
| Unit or categories | Millimetres, count, named categories, or another appropriate representation |
| Time and population | When the observation occurs and what cases it covers |
| Figure label | A concise label that preserves the same meaning |
For a thesis or dissertation, follow the programme's handbook when deciding whether to use a separate section and where to place it. For a journal article, check the journal's instructions; definitions may be integrated into the introduction and methods. A heading called “Definition of Terms” is not a universal requirement.
What changes in qualitative research?
A definition of terms in qualitative research can clarify who a term refers to, what an activity includes, or how a coding category is applied. It should not force participants' experiences into an invented numerical score.
For an illustrative interview study about research collaboration, define “cross-laboratory collaboration” by the activities and organisational boundaries relevant to the project. If you use a structured codebook, an entry might record the code name, meaning, inclusion rule, exclusion rule and an anonymised example. If your analytic approach develops meanings iteratively, explain how and why those interpretations were revised.
Distinguish the researcher's analytic term from the participant's own wording. The appropriate degree of advance definition depends on the qualitative methodology; a fixed coding rule is not required by every approach.
Turn agreed definitions into clear research figures
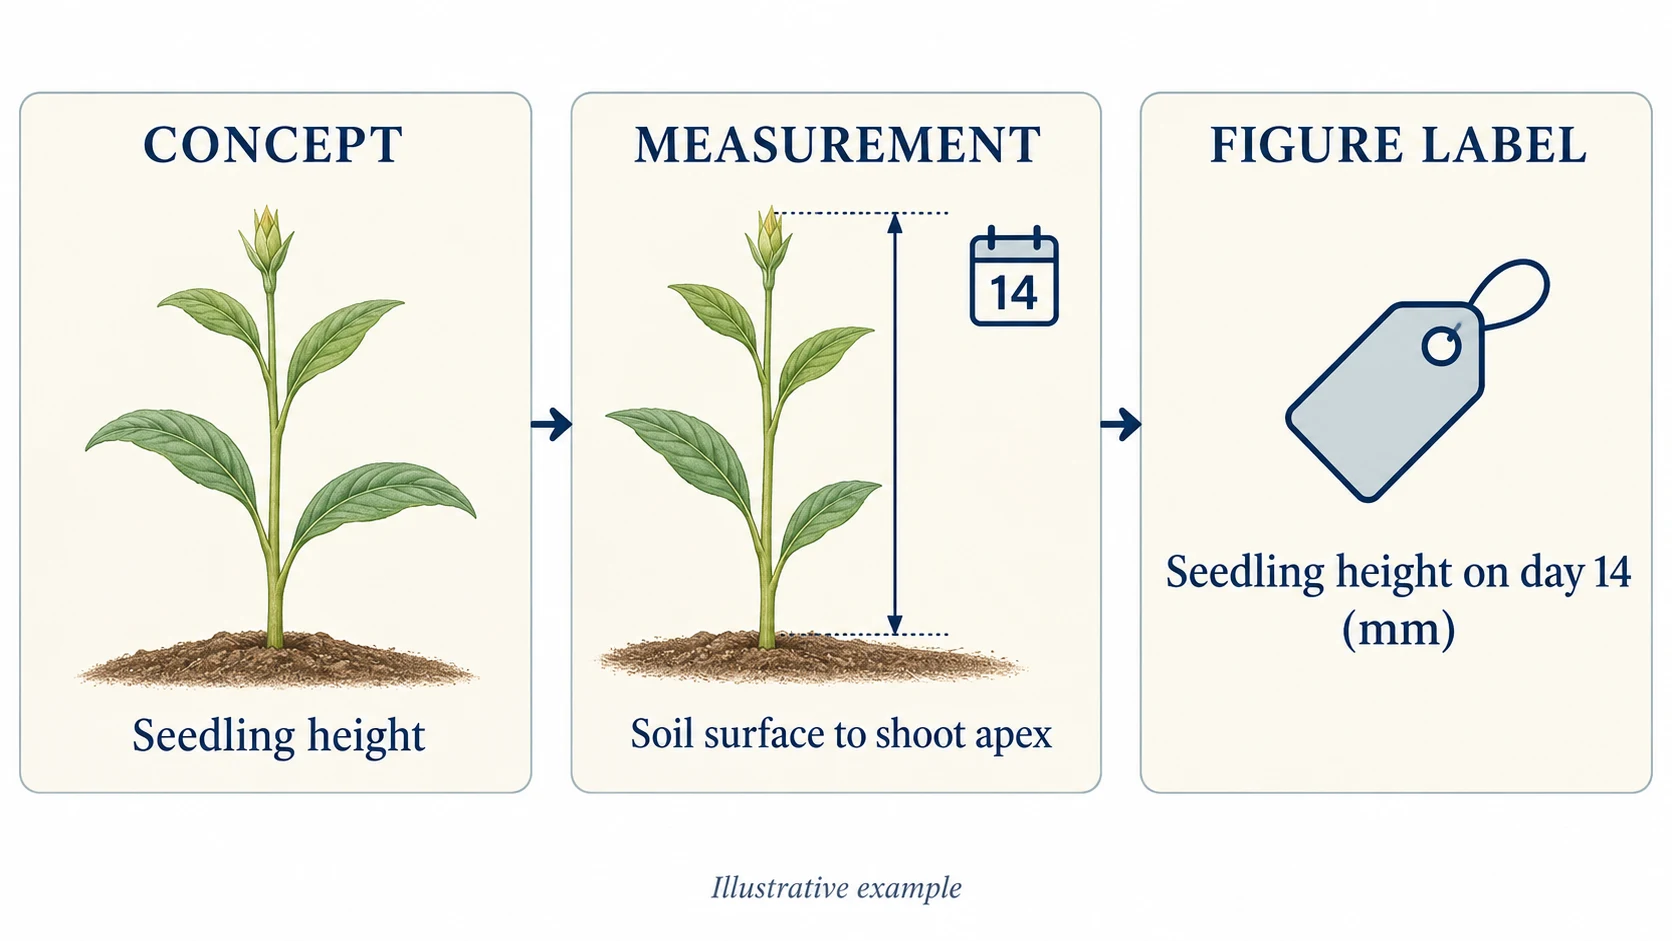
AI-generated teaching illustration. It shows a measurement workflow, not observed data or a validated experimental protocol.
Once the definitions are settled, a diagram can show how the selected variables relate. A conceptual framework draft is useful for comparing layouts. For the difference between a variable model and a methods workflow, see our research framework diagram guide.
Poor prompt:
Draw a scientific diagram showing that more light makes plants grow better.This asks the image model to supply both an undefined outcome and an unsupported conclusion.
Better prompt:
Create a clean diagram for a hypothetical seedling study.
Show two named variables: “Daily light duration (h/day)” and
“Seedling height on day 14 (mm)”. Connect them with a dashed line
labelled “Relationship to be tested”.
Below height, add: “Measured from substrate surface to shoot apex”.
Use a white background, restrained blue and green, and readable labels.
Do not add result values, significance symbols, an improvement claim,
or extra variables. This is a study plan, not a results figure.
SciDraw AI can help create the diagram draft from your description. It does not select valid measures or verify your hypotheses for you. Check the rendered text, relationships and units against your protocol before using the figure. For a measured result, plot the actual data rather than asking an image model to invent a plausible graph.
FAQ
What is the definition of terms in research?
It explains how a study uses its important concepts and technical expressions. For measured or classified variables, it also makes the practical observation rule clear, so the reader knows what the reported values represent.
What is the difference between conceptual and operational definitions?
The conceptual definition states what you mean by an idea. The operational definition states how you recognise, measure or classify it in your study. A single concept can have more than one possible operationalisation.
Should definition of terms be alphabetical?
Use the order required by your institution. If no order is specified, alphabetical order helps readers look up a long list; a short table can follow the order in which variables appear in the study. Consistency matters more than a universal ordering rule.
Do I need citations for every definition?
Cite borrowed concepts, published instruments and established protocols as appropriate. Make your own study-specific decisions explicit without inventing a source for them. Follow the citation style required by your programme or journal.
Can AI write the definitions for my thesis?
It can help you identify unclear wording or draft a table from methods you provide. You remain responsible for checking sources, measurement rules and institutional requirements. Do not use generated references or thresholds without verifying them.
Continue from definitions to the proposal
Use the PhD research proposal guide to connect the question, methods and evidence. When the terminology is stable, bring the agreed variable names to SciDraw AI's conceptual framework maker and review the draft against your methods table.
Methodological reading: BCcampus on psychological measurement and OpenStax on analysing findings.