環境科学の研究には、生態学的プロセス、汚染経路、持続可能性の枠組みを明確に視覚化することが不可欠です。このガイドでは、実際の環境研究で使用された30の実証済みAIプロンプトを紹介し、ジャーナル、レポート、プレゼンテーション向けの出版品質の図表作成をサポートします。
本ガイドの内容:
- 生態学的プロセスおよび生物地球化学的サイクルの図
- 汚染源と経路のイラスト
- 持続可能な設計と最適化のフレームワーク
- 環境研究のための技術ロードマップ
1. 持続可能な設計と最適化
1.1 パッシブソーラーデザイン
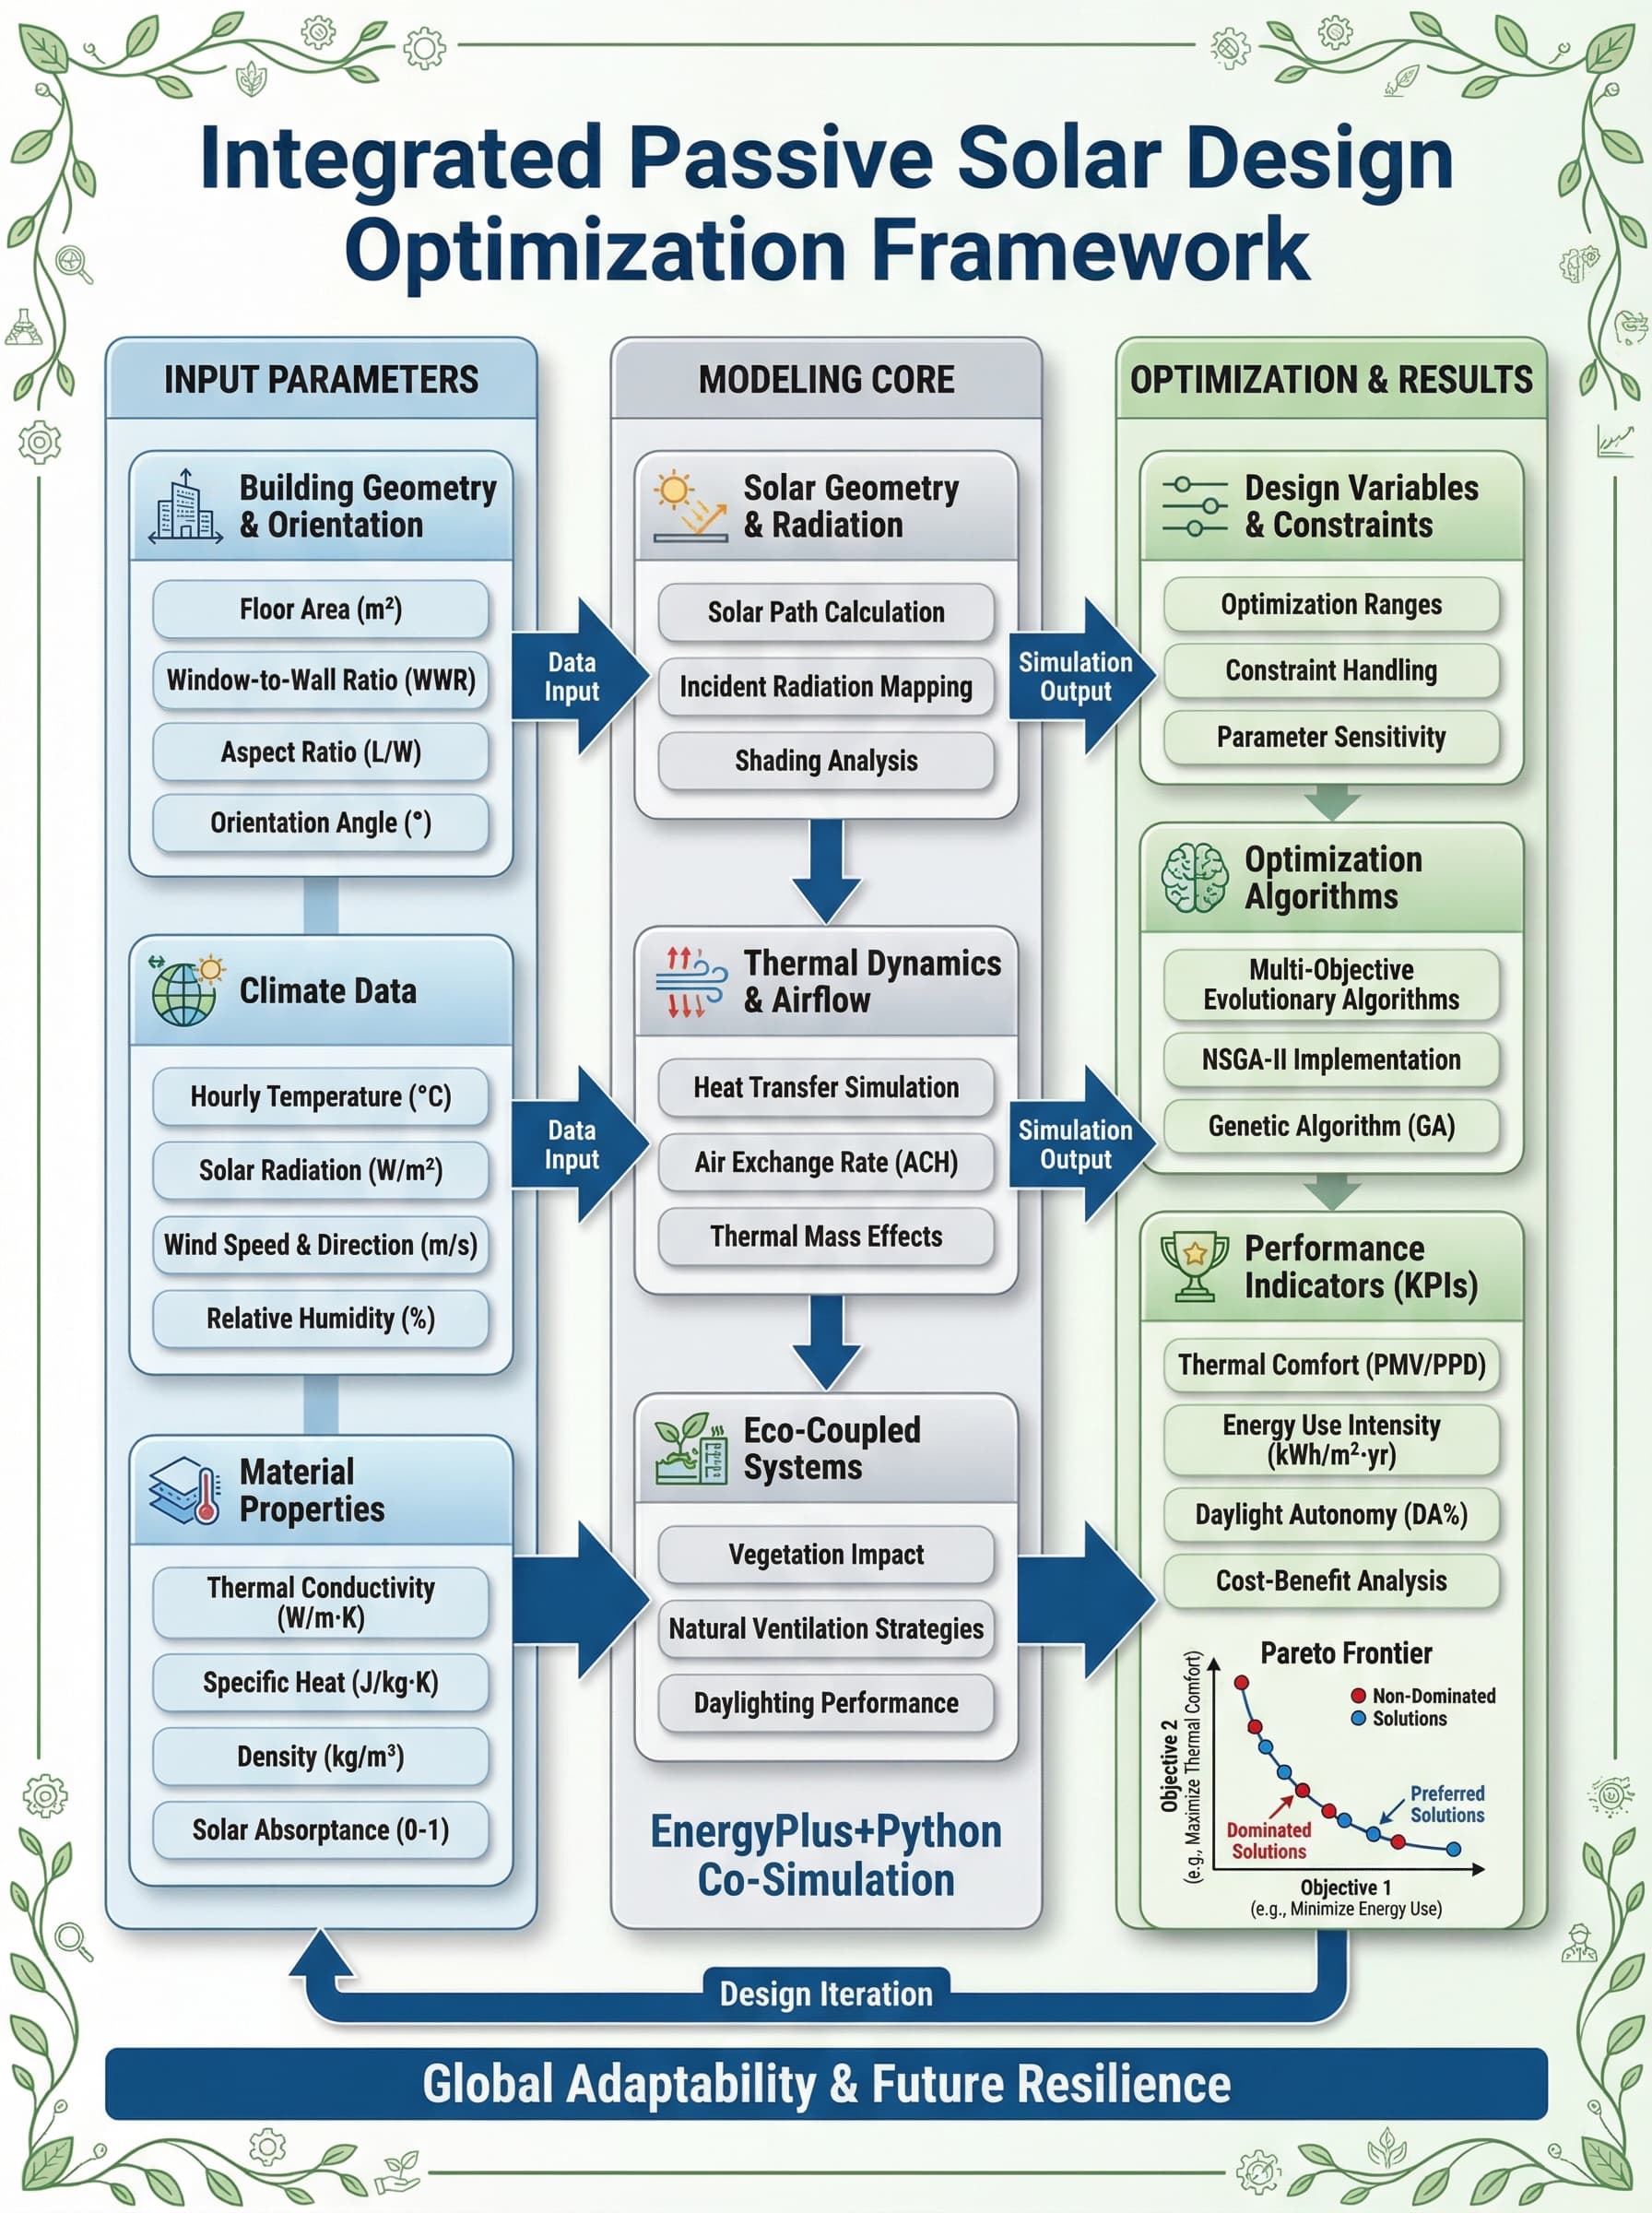
プロンプト:統合パッシブソーラーデザイン・フレームワーク
Generate a landscape-oriented scientific framework diagram in English, titled
"Integrated Passive Solar Design Optimization Framework". Show:
- Building orientation and solar geometry
- Thermal mass placement strategies
- Natural ventilation pathways
- Daylighting optimization zones
- Energy performance indicators
- Integration with active systems
Use a professional scientific diagram style with clear hierarchical structure.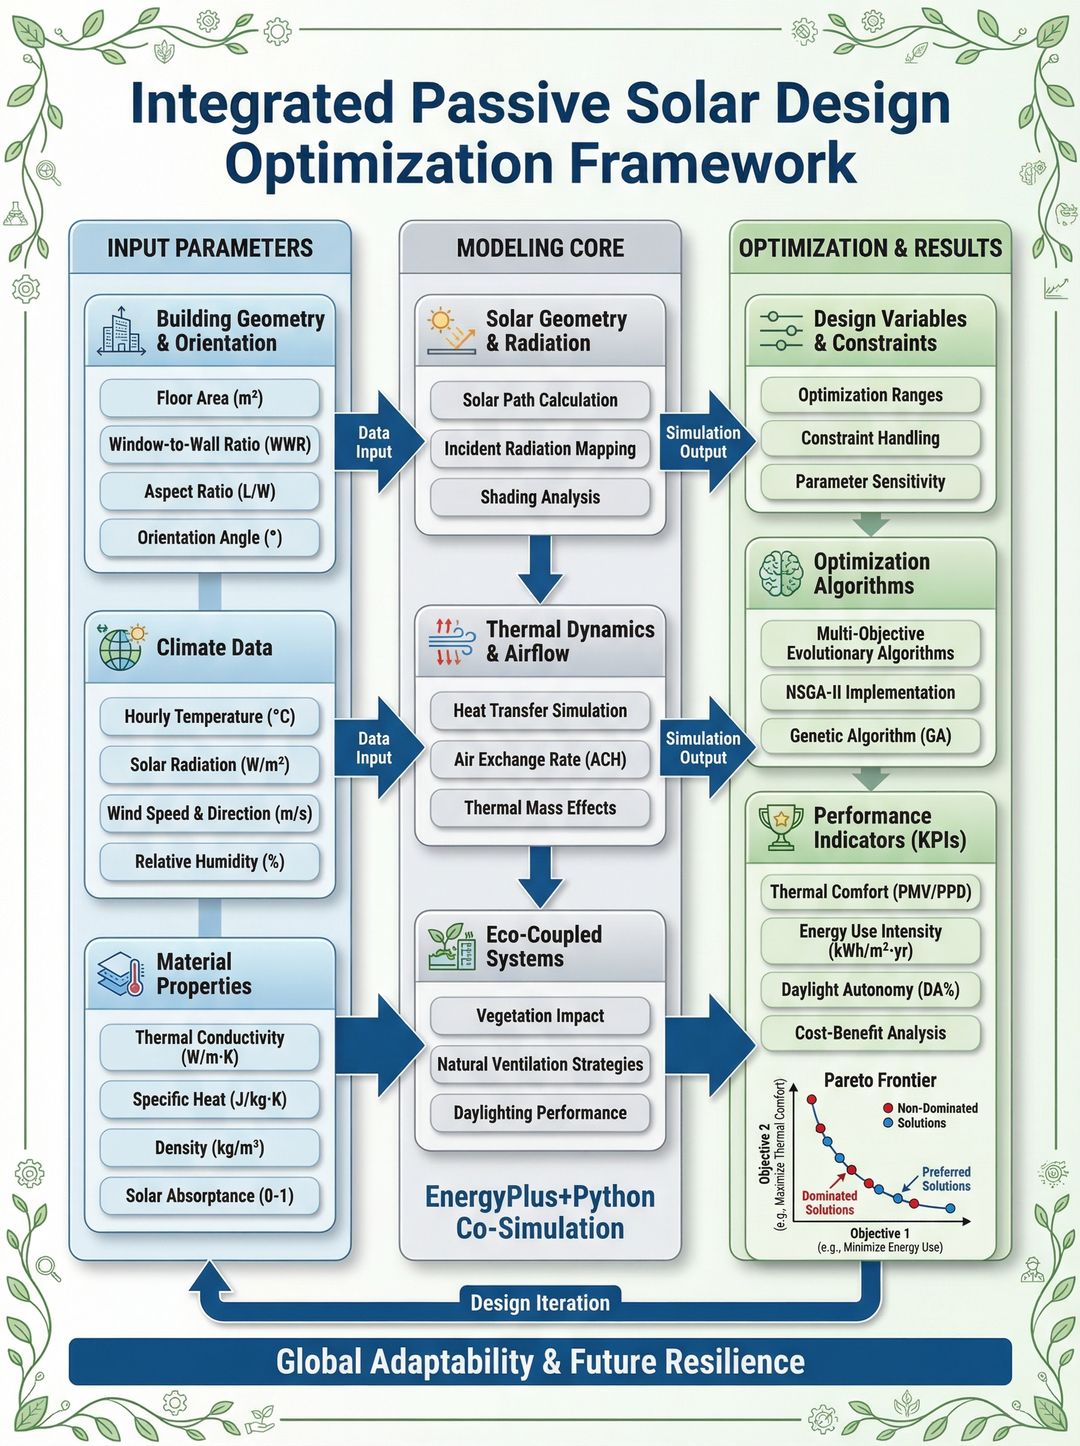
1.2 農業におけるストレス応答
プロンプト:作物に対する環境ストレスの影響
Environmental stress and suboptimal planting schedules significantly limit
cauliflower production by disrupting developmental processes. Create a diagram
showing:
- Temperature stress effects on plant physiology
- Water stress indicators and thresholds
- Developmental stage sensitivity windows
- Yield loss pathways
- Mitigation strategies (irrigation, shading)
Include both stress mechanism and management response panels.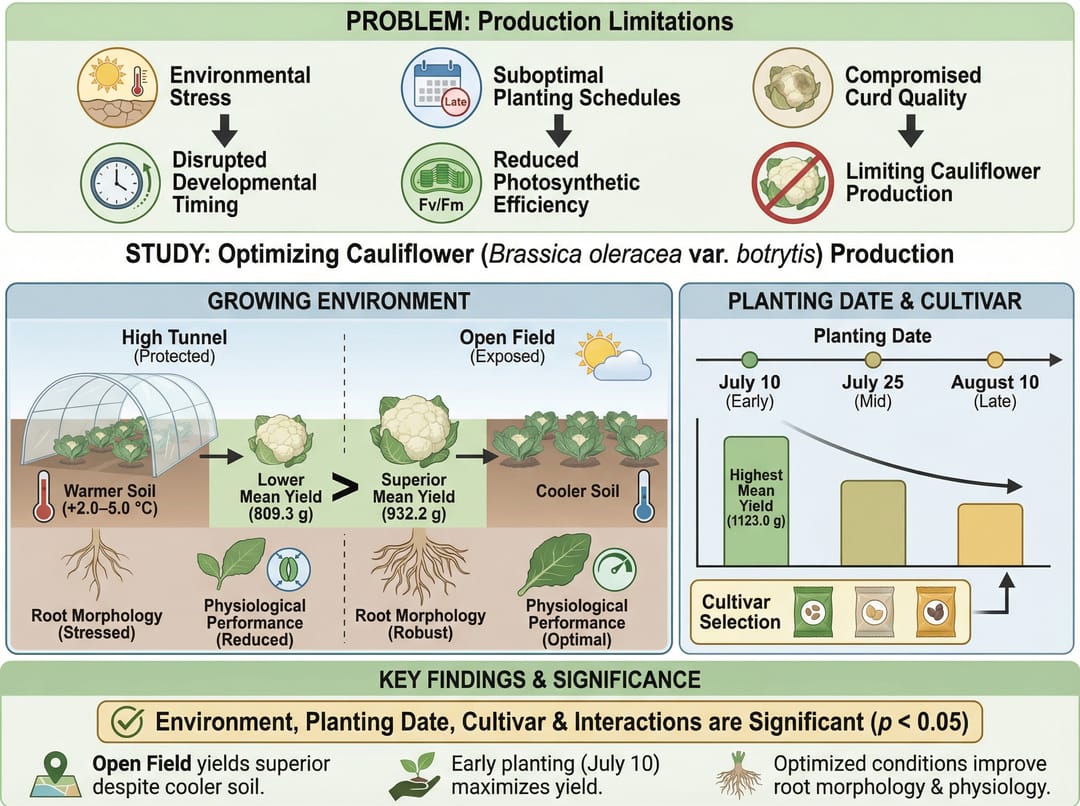
2. 生物地球化学的サイクル
2.1 土壌窒素プロセス
プロンプト:農地土壌の硝化メカニズム
Draw a schematic diagram illustrating the mechanism of the nitrification process
in farmland soil. With ammonia oxidation as the central process, show:
- NH4+ to NO2- conversion (ammonia-oxidizing bacteria)
- NO2- to NO3- conversion (nitrite-oxidizing bacteria)
- Environmental factors affecting rates (pH, temperature, moisture)
- Coupling with denitrification
- N2O emission pathways
Use soil profile cross-section with microbial community visualization.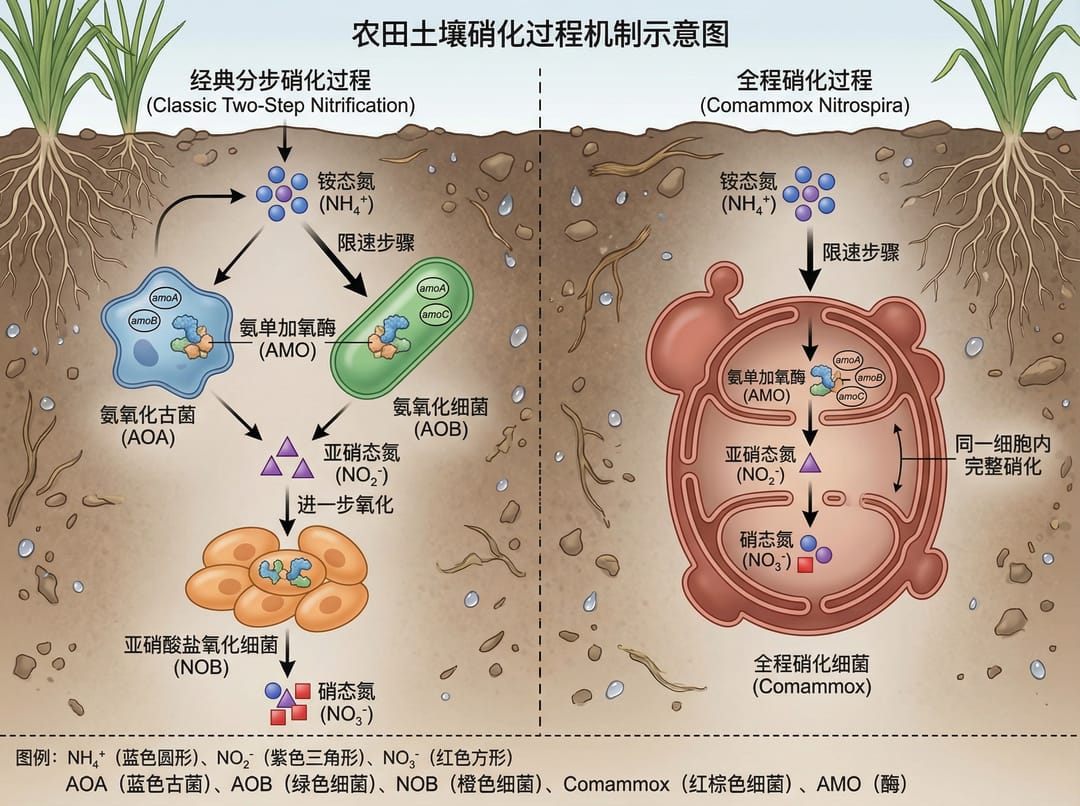
3. 新たな汚染物質(Emerging Contaminants)
3.1 汚染源と経路
プロンプト:新たな汚染物質の発生源
Emerging contaminants originate from diverse sources, with their release closely
linked to human production and lifestyle activities. Create an illustration showing:
- Pharmaceutical sources (hospitals, households, manufacturing)
- Personal care product pathways
- Agricultural chemical inputs
- Industrial discharge points
- Transport through water, soil, and air
- Exposure routes to ecosystems and humans
Use a circular or network diagram style.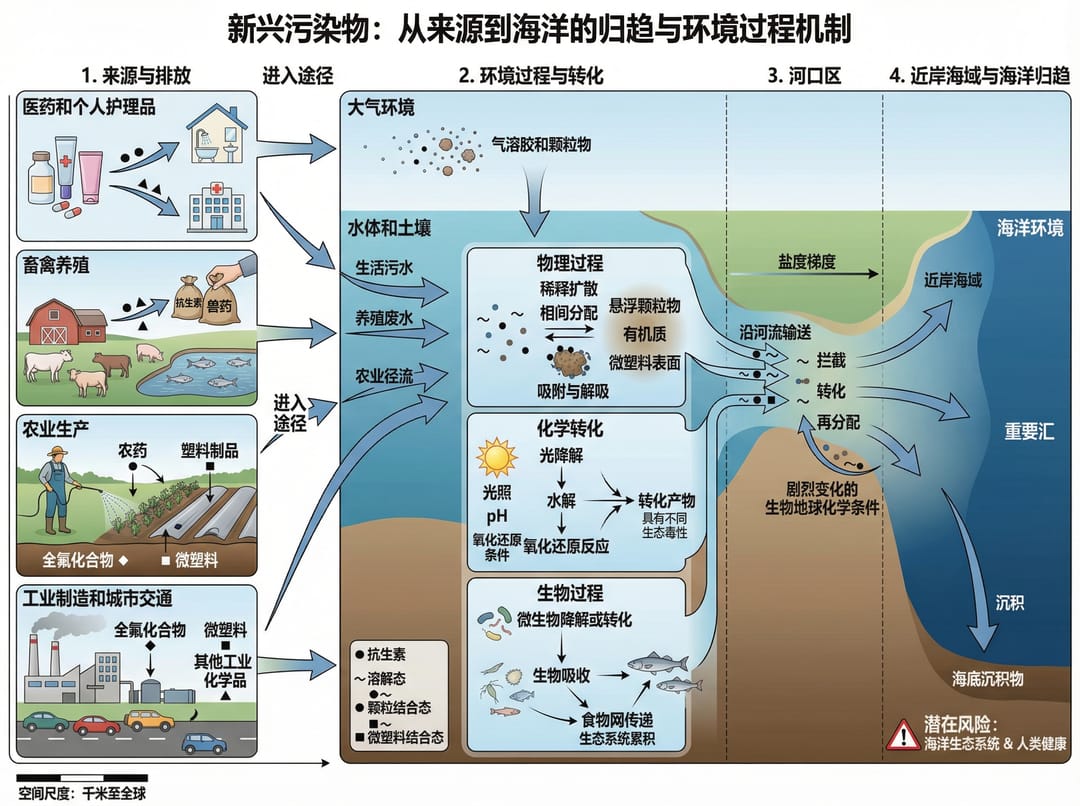
3.2 海洋食物網における移行
プロンプト:海洋系におけるPPCPsの栄養段階転移
Could you help me generate a technical roadmap? I am a graduate student studying
the trophic transfer of PPCPs (pharmaceuticals and personal care products) in
marine food webs. Show:
- Primary producer uptake mechanisms
- Bioaccumulation at each trophic level
- Biomagnification factors
- Metabolic transformation pathways
- Human exposure through seafood consumption
- Research methodology workflow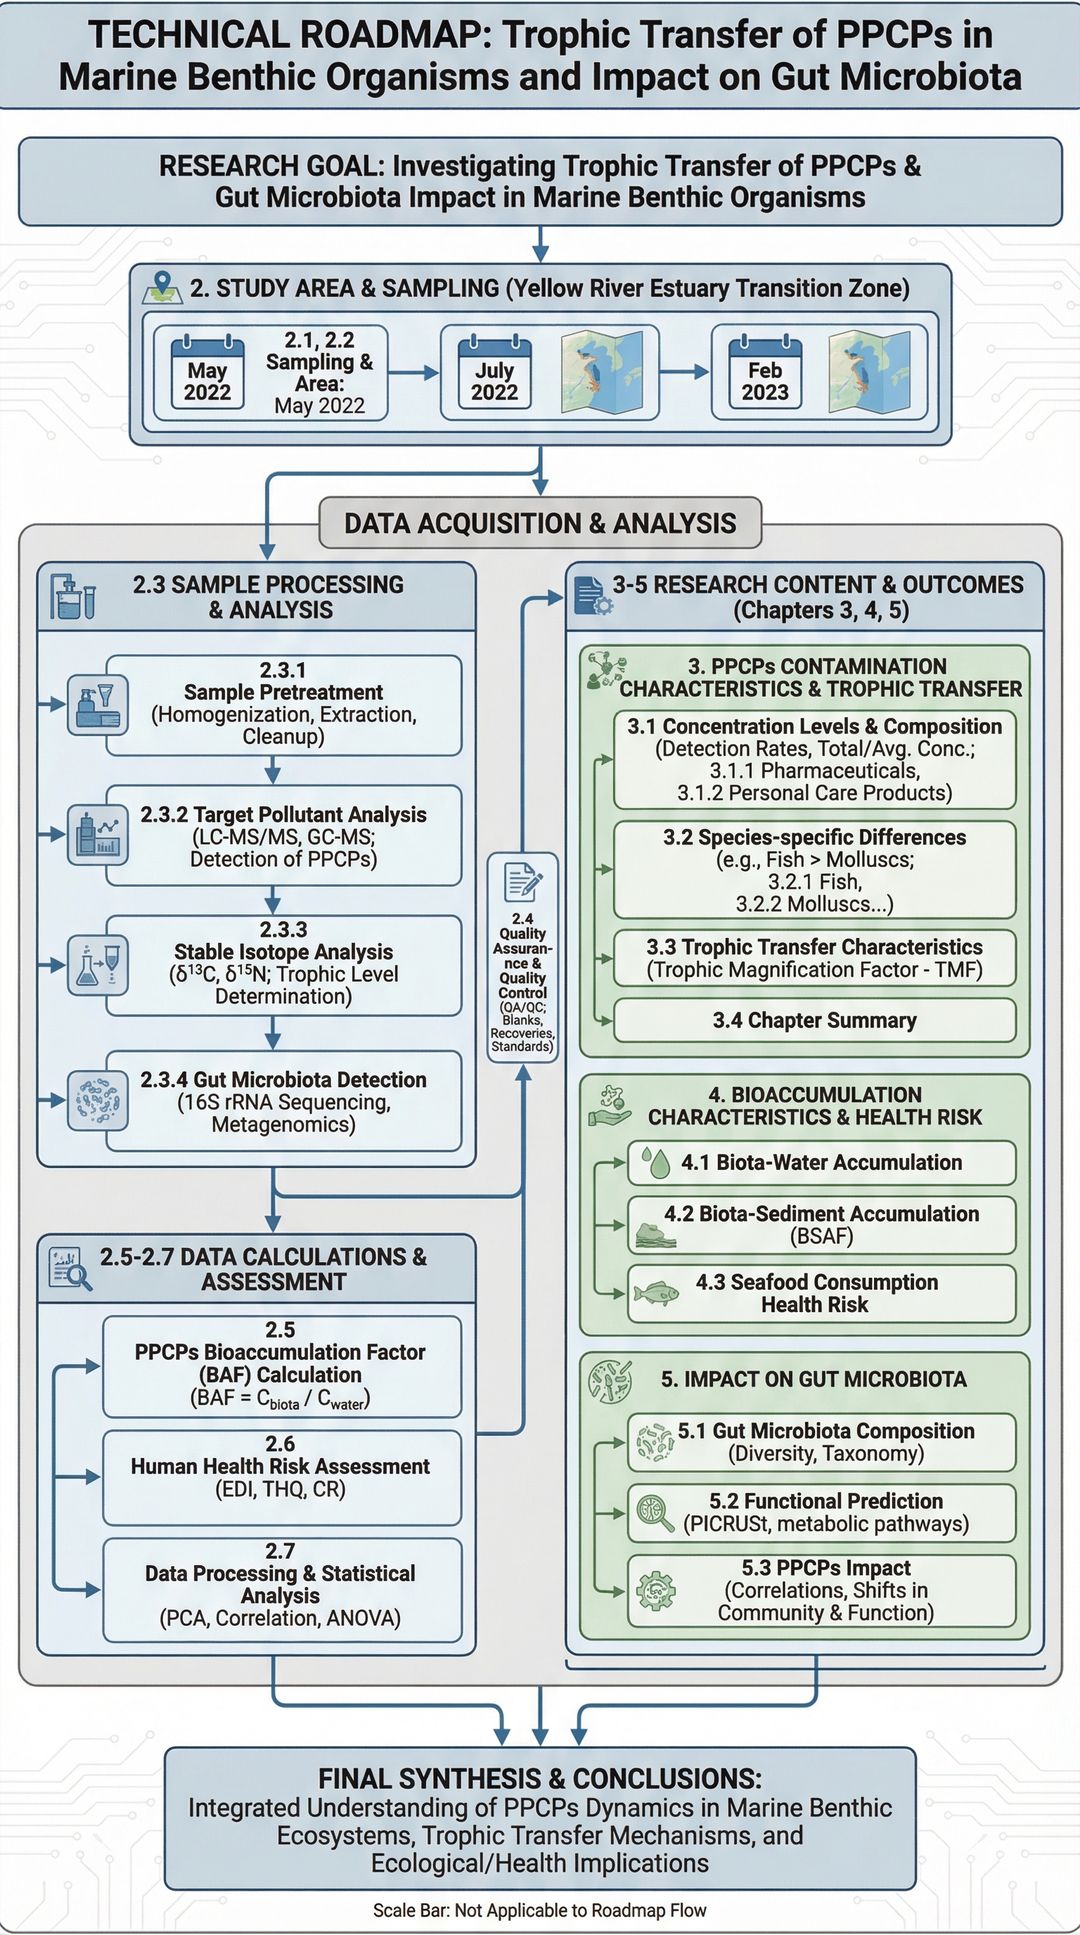
3.3 生態学的プロセスと健康リスク
プロンプト:PPCPsの生態学的・健康リスクフレームワーク
This study focuses on the ecological processes and health risks of emerging
contaminants, specifically pharmaceuticals and personal care products in aquatic
environments. Create a framework diagram showing:
- Source identification and quantification
- Environmental fate and transport
- Ecological toxicity pathways
- Human health risk assessment
- Regulatory framework and monitoring
Use a hierarchical or flow-based structure.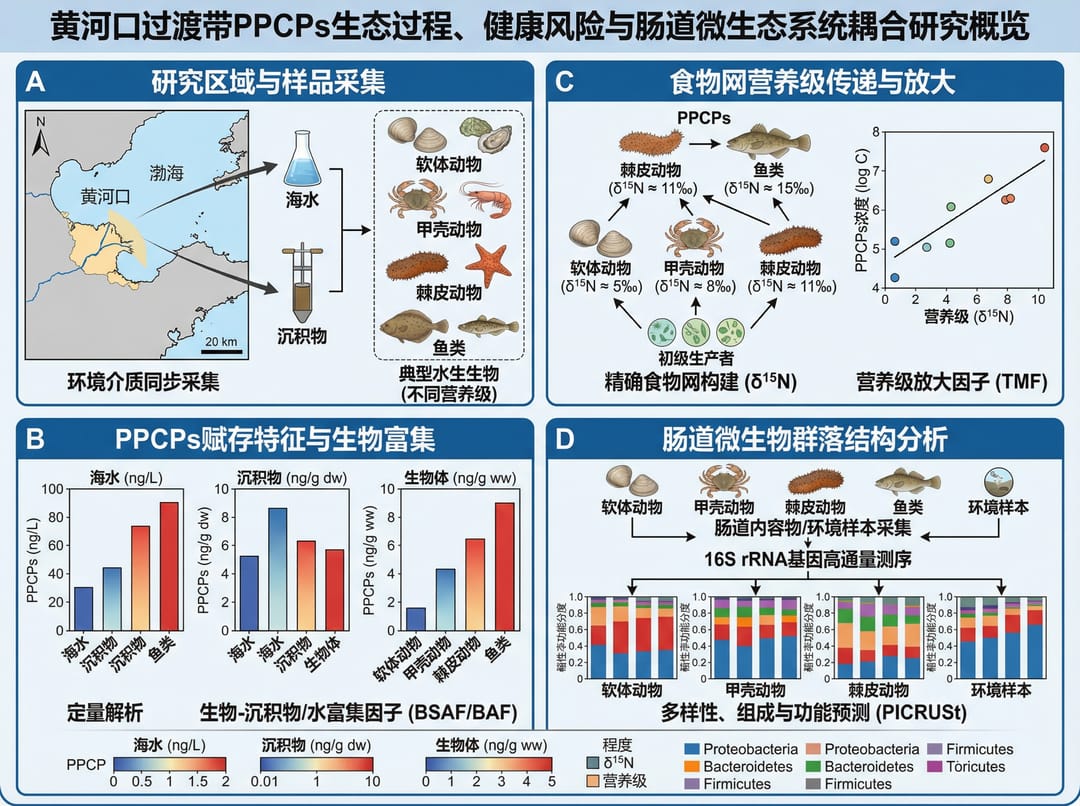
4. 地域環境研究
4.1 河口域の生態系
プロンプト:黄河河口域の技術ロードマップ
Generate a technology roadmap. This study focuses on the ecologically sensitive
Yellow River Estuary transition zone as a case study. Include:
- Study area characterization
- Research objectives and hypotheses
- Sampling and monitoring strategy
- Data analysis methods
- Expected outcomes and applications
- Timeline and milestones
Use a professional research roadmap format.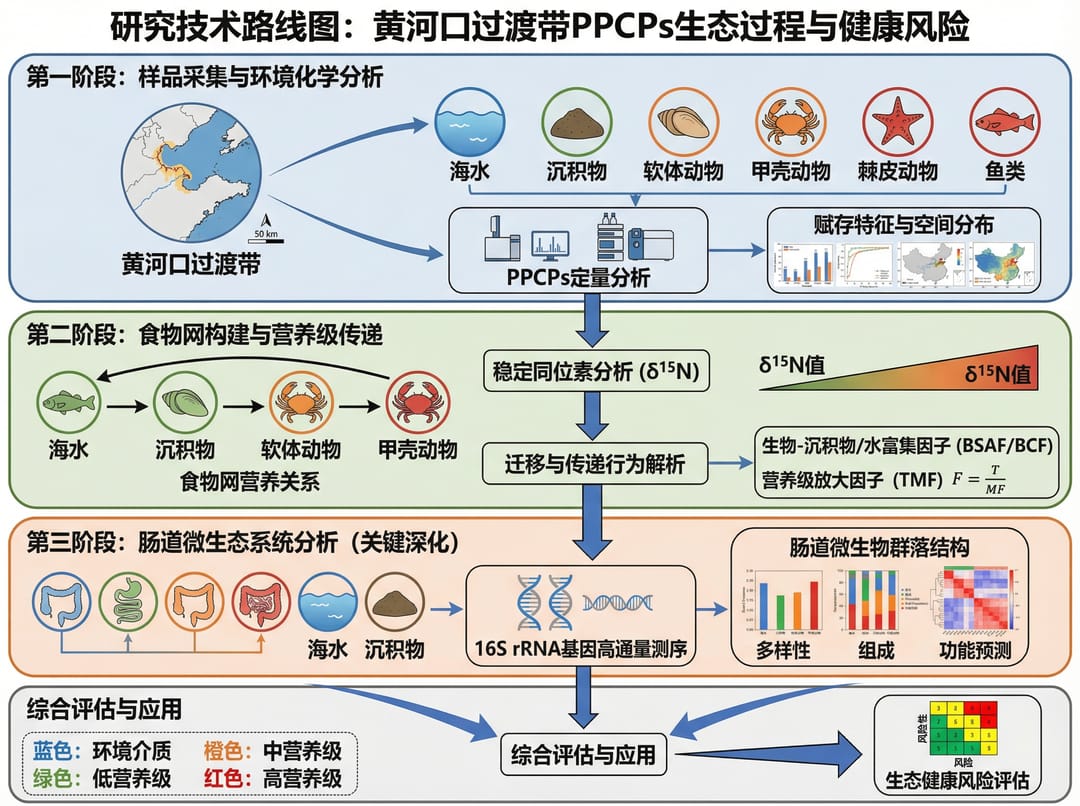
5. 問題解決フレームワーク
5.1 円形インフォグラフィック
プロンプト:風食問題の連鎖(カスケード)
Scientific illustration, circular infographic format.
Top Half: Problem Cascade illustrating the effects of wind erosion:
- Soil loss and degradation
- Nutrient depletion
- Vegetation damage
- Air quality impacts

Bottom Half: Solution Framework showing:
- Windbreak establishment
- Cover cropping
- Tillage management
- Monitoring and assessment
Use a professional circular infographic with clear visual hierarchy.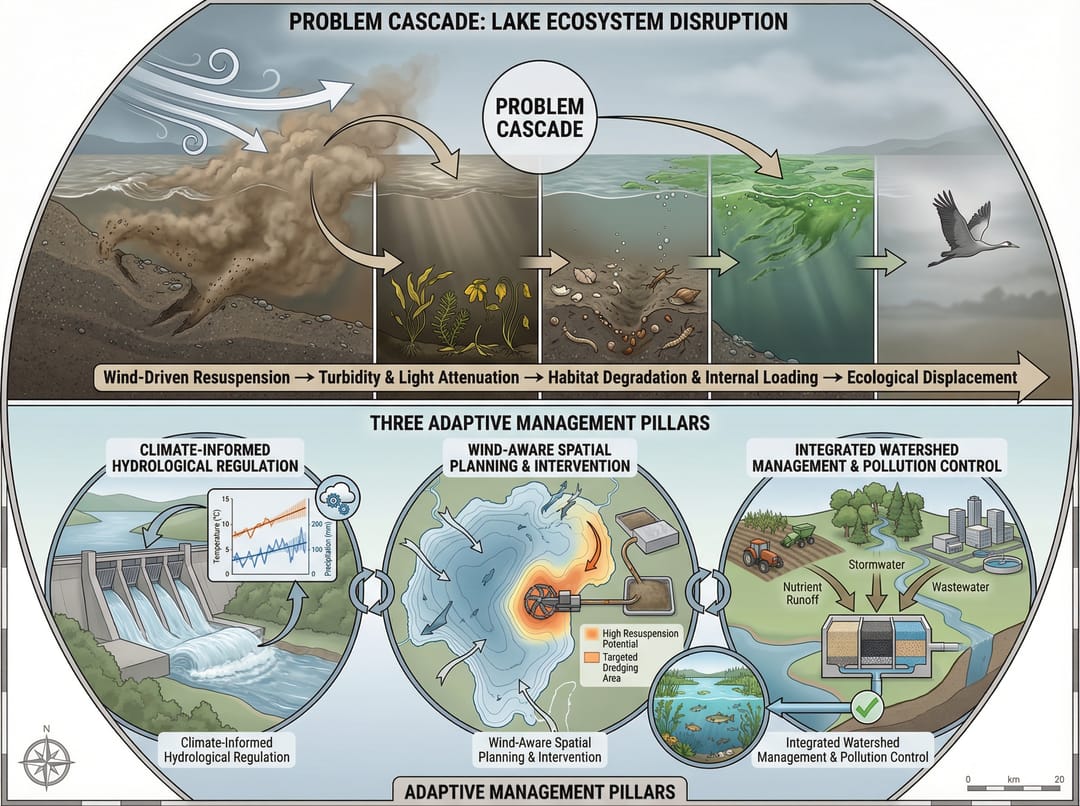
6. インフラと持続可能性
6.1 路盤材の利活用
プロンプト:路盤充填材の研究
1.1 Research Significance
The efficient utilization of roadbed filling materials is a concrete
implementation of key transportation sustainability goals. Create a figure showing:
- Material sources (recycled, natural, industrial byproducts)
- Processing and treatment methods
- Performance requirements and testing
- Environmental benefits quantification
- Life cycle assessment framework
Use a research significance diagram style.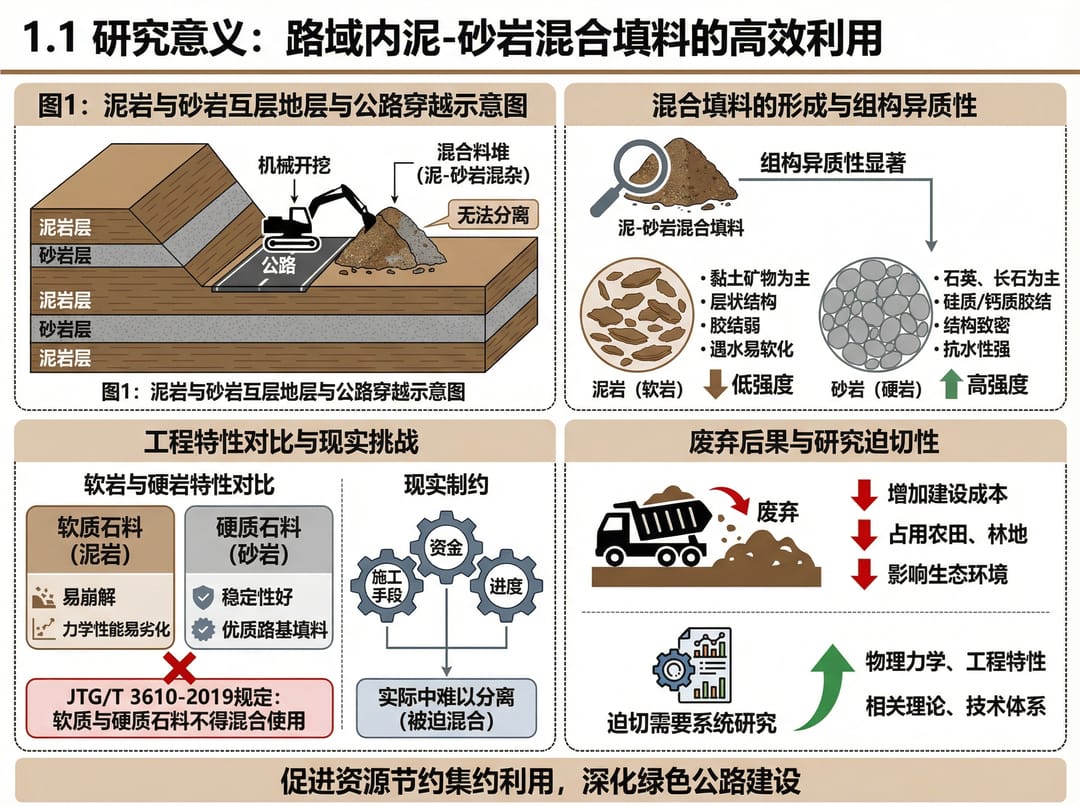
7. 環境科学図表のベストプラクティス
図表タイプ別の必須要素
| 図表のタイプ | 必須構成要素 |
|---|---|
| 生物地球化学的サイクル | 貯蔵庫(リザーバー)、フラックス、変換プロセス、微生物剤 |
| 汚染経路 | 発生源、輸送媒体、受容体、暴露経路 |
| 生態系研究 | 栄養段階、エネルギー流、栄養循環、種間相互作用 |
| 持続可能性フレームワーク | 投入(インプット)、産出(アウトプット)、フィードバックループ、指標 |
環境科学プロンプトのヒント
- スケールの明示: 時間的(日次、季節、年次)および空間的(局所、地域、地球規模)なスケールを含める
- 定量的データの表示: フラックス率、濃度、パーセンテージなどを示す
- 不確実性の提示: 必要に応じてエラーバーや信頼区間を表示する
- 基準の参照: EPA、WHO、または地域の規制閾値を参照する
- 認知されたシンボルの使用: プロセスやコンパートメントに標準的なシンボルを使用する
環境科学図表の作成を始めましょう
SciDraw AI の AI イラストレーションツールでこれらのプロンプトを試してみてください: