論文や助成金申請、プレゼン用にバイオメディカルの図を1枚作る——これまではIllustratorが使えるか、お金を払って誰かに描いてもらうかの二択でした。いまは描きたいものを文章で説明すれば、AIが投稿レベルに近い図を出してくれます。難しさは「ソフトを使えるか」から「プロンプトをどう書くか」に移ったわけです。
この記事では、実際の研究プロジェクトから集めた50本のプロンプトを、用途別(細胞生物学・分子生物学・免疫学・医学図)に整理して載せました。コピーして少し書き換えれば、そのまま使えます。
このガイドの内容:
- 一般的なバイオメディカル図解のための、すぐに使えるプロンプトテンプレート
- 出版された研究プロジェクトからの実例
- 特定のニーズに合わせてプロンプトをカスタマイズするためのヒント
- 出版品質の結果を得るためのベストプラクティス
1. 細胞生物学と分子メカニズム
1.1 タンパク質の構造と機能
プロンプト:p53のDNA結合メカニズム
The p53 protein binds to the DNA double helix via its central DNA binding domain.
Create a molecular illustration showing the tetrameric p53 structure engaging with
the major groove of DNA, highlighting the zinc coordination sites and key amino
acid residues involved in sequence-specific recognition.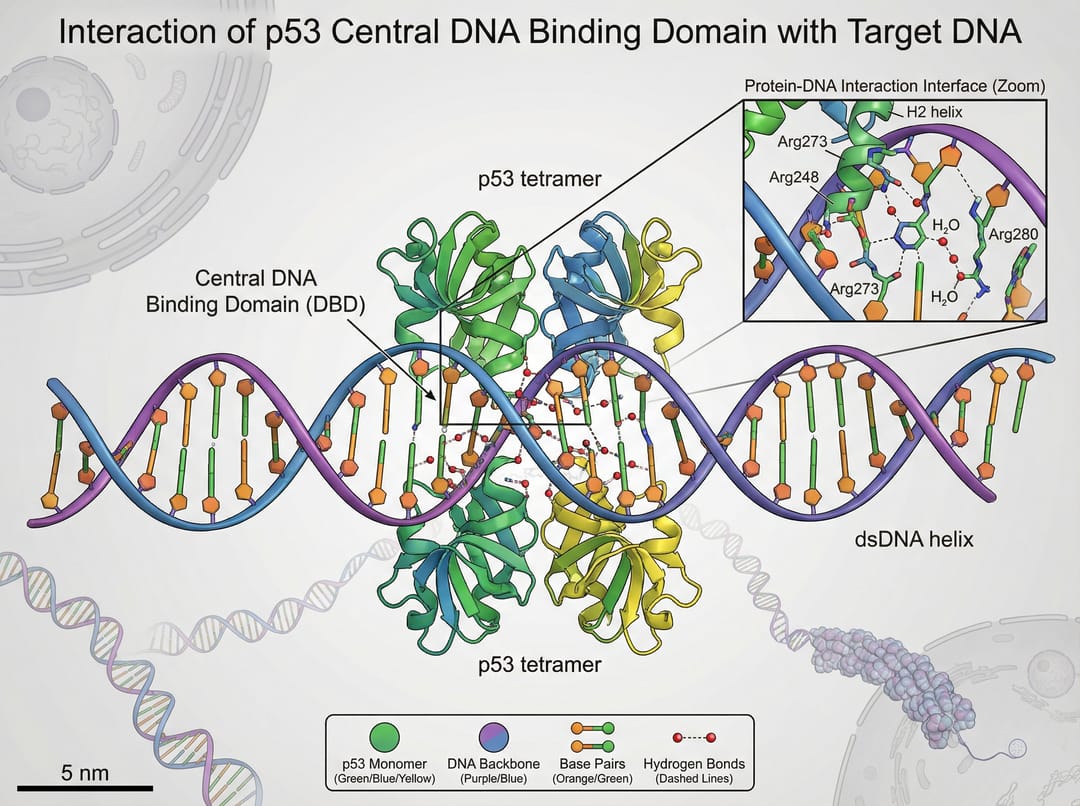
プロンプト:心血管疾患におけるECMプロテオミクス
"Applications of ECM-specific proteomics in cardiovascular disease".
The figure should be vertically structured, showing the workflow from tissue
sample collection through mass spectrometry analysis to biomarker discovery,
with emphasis on extracellular matrix protein identification.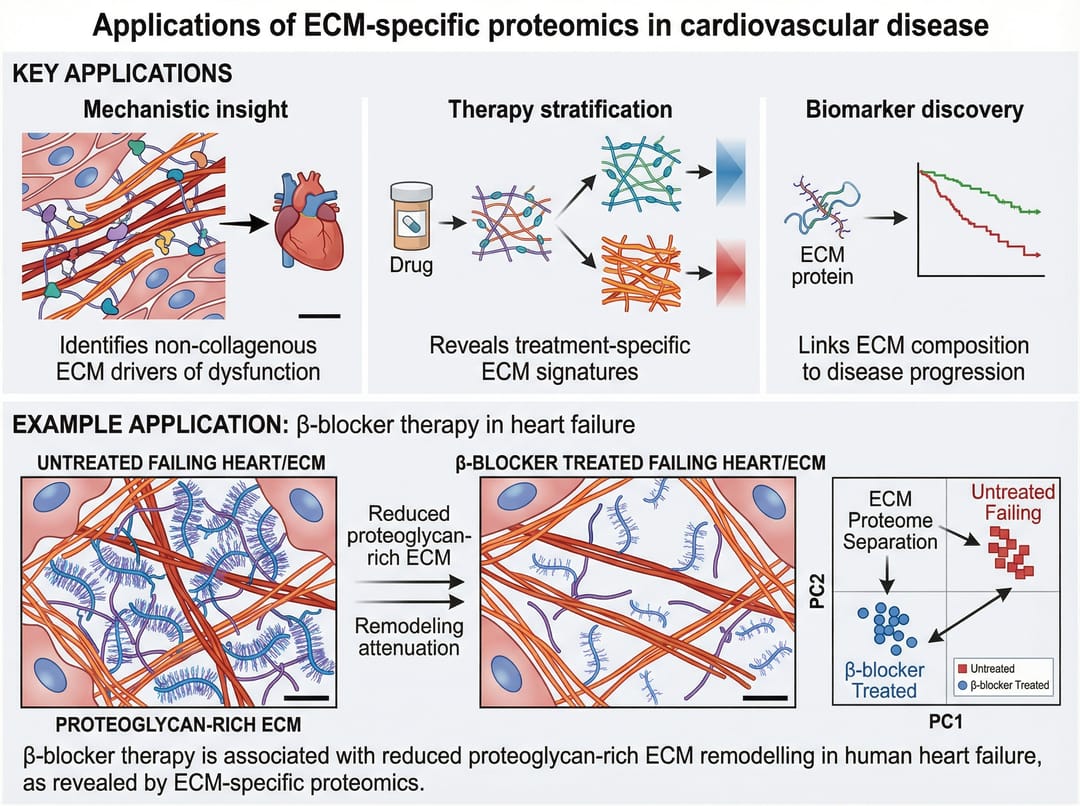
1.2 細胞プロセス
プロンプト:ドラッグデリバリーメカニズム - FlaToxシステム
Create a simplified schematic illustrating the FlaTox-mediated delivery of
flagellin into intestinal epithelial cells. Show the protective antigen (PA)
binding to cell surface receptors, pore formation, and subsequent translocation
of the flagellin fusion protein into the cytoplasm where it activates NLRC4
inflammasome signaling.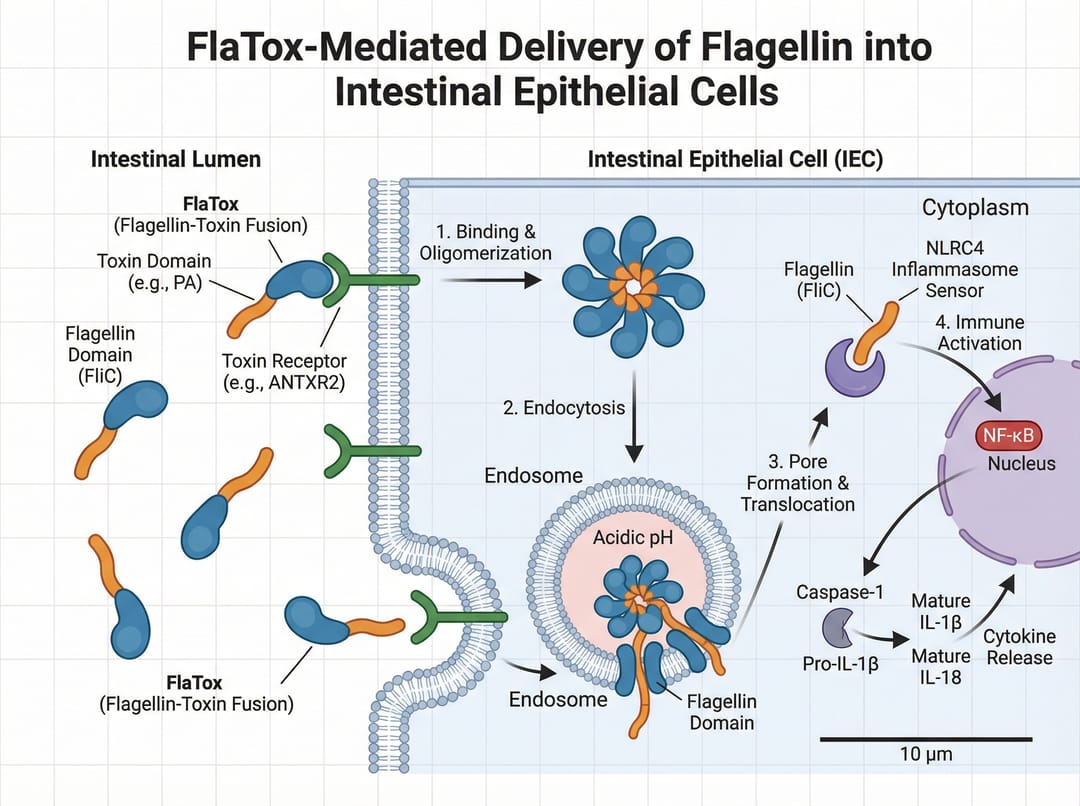
プロンプト:食後血糖値の影響
Illustration depicting the postprandial glucose elevation following a high-sugar
meal and its subsequent detrimental effects on vascular endothelium. Show the
timeline from meal ingestion through glucose spike to endothelial dysfunction,
including oxidative stress markers and inflammatory pathway activation.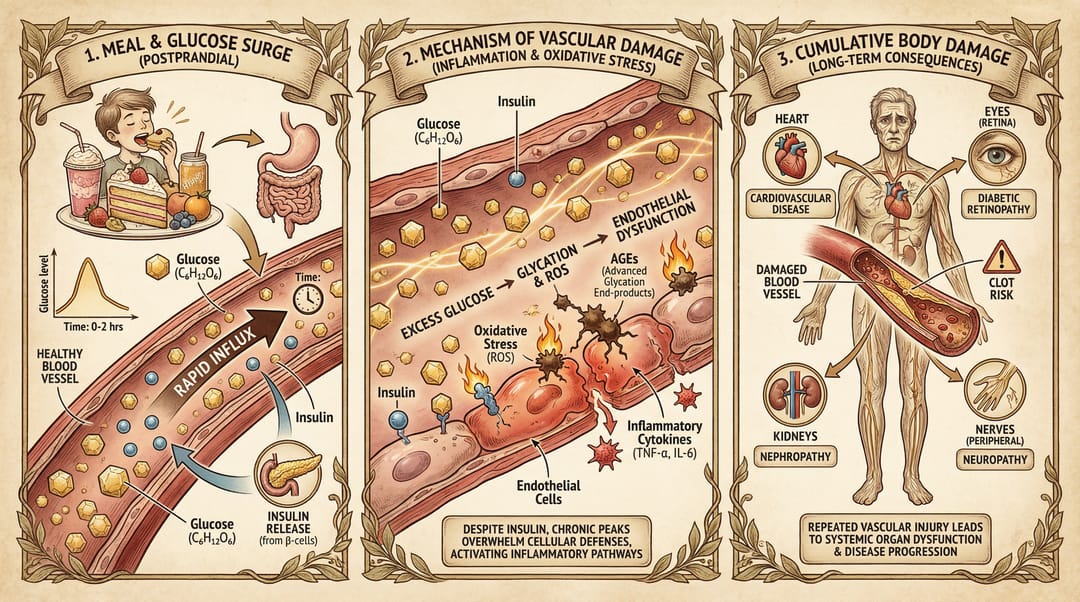
2. 免疫学と疾患研究
2.1 免疫細胞の研究
プロンプト:自閉症研究におけるNK細胞の恒常性
This study draws the following key conclusions:
Mice with 15q duplication autism exhibit significant NK cell homeostasis
imbalance. Create a figure showing terminally mature NK cells, immature NK cell
populations, and the disrupted balance between them, with quantitative markers
and statistical significance indicators.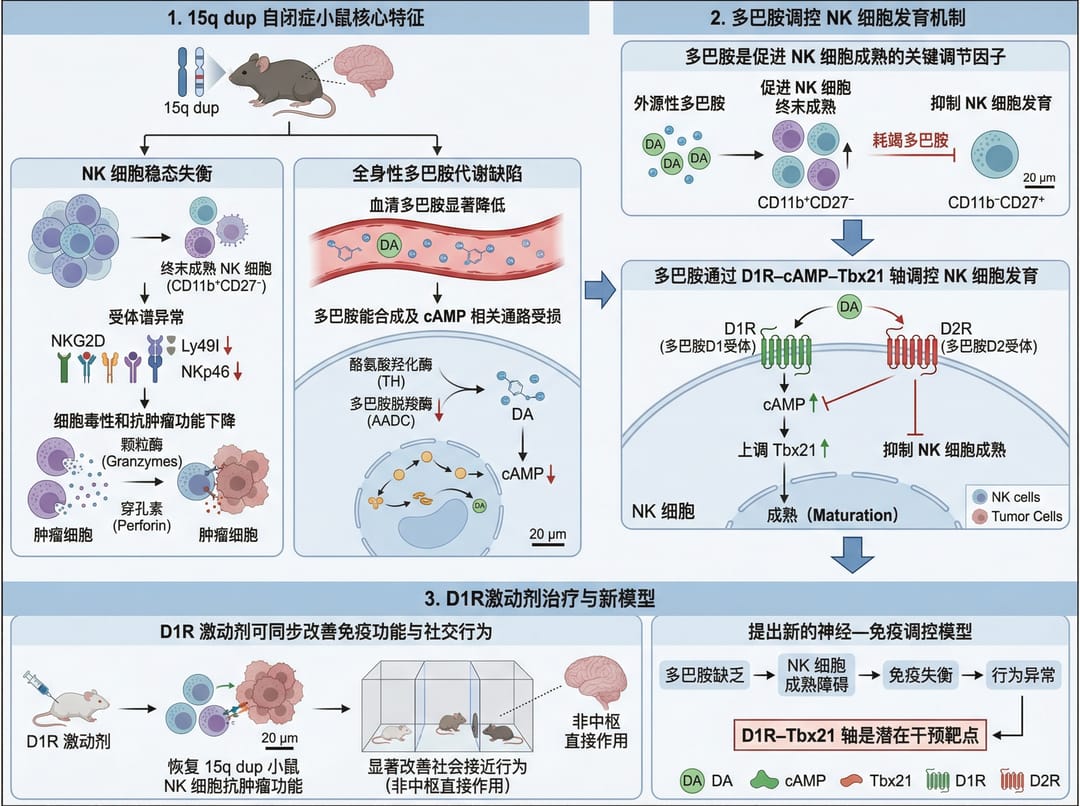
2.2 疫学とグローバルヘルス
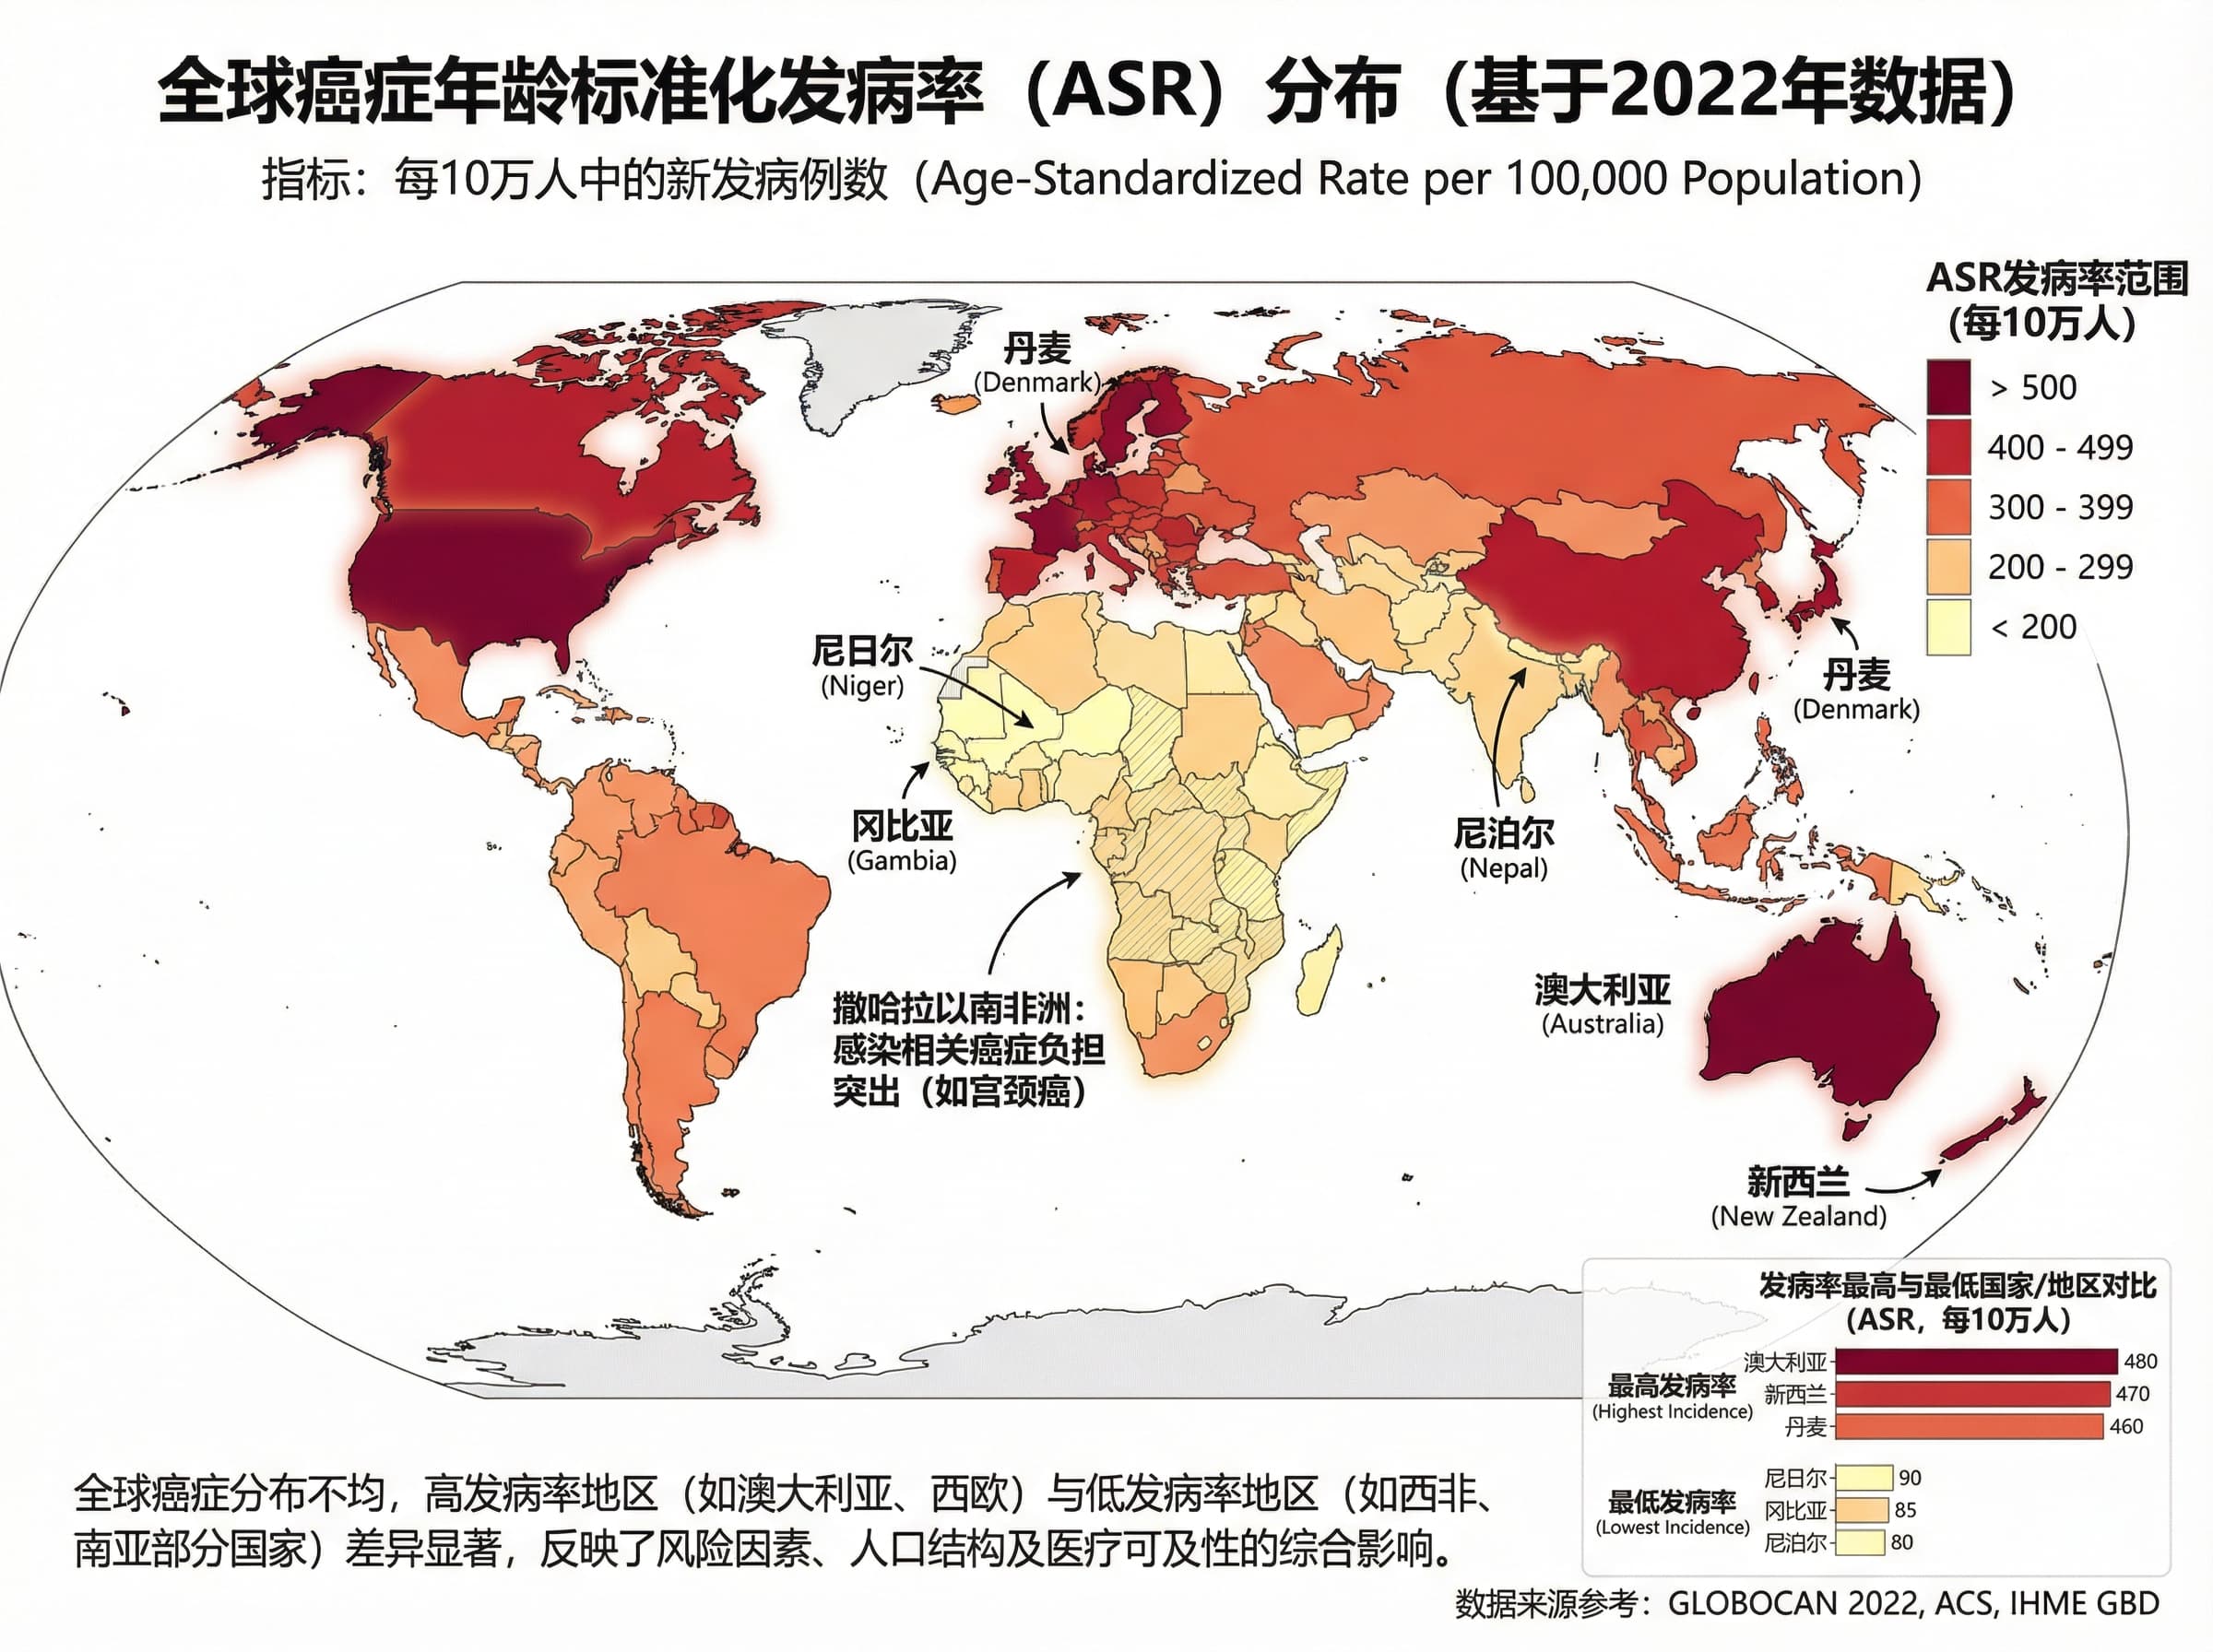
プロンプト:世界のがん罹患率マップ
Core Theme: To create a world map illustrating the global distribution of
age-standardized cancer incidence rates (ASR). Use a choropleth map with
gradient colors from light (low incidence) to dark (high incidence), include
regional labels, and add a color legend with ASR ranges per 100,000 population.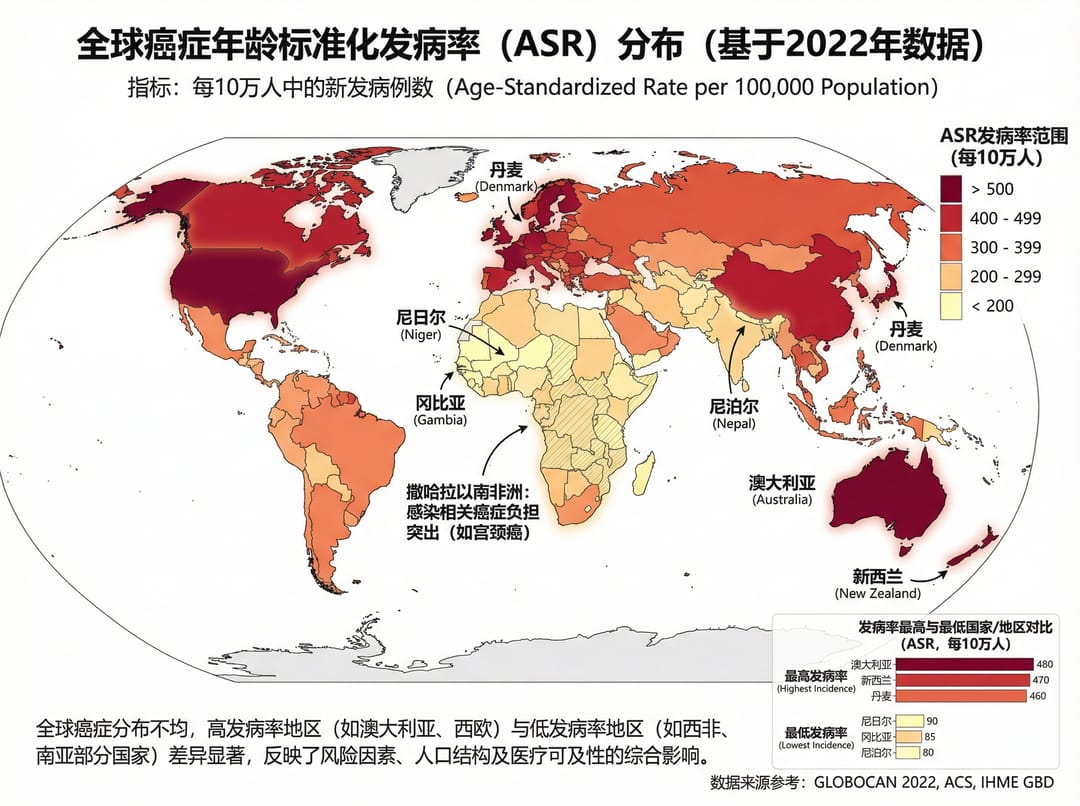
3. 実験プロトコルと手法
3.1 タンパク質分析ワークフロー
プロンプト:SDS-PAGEプロトコル
Here is a protocol for protein extraction, denaturation, gel preparation, and
sample loading for SDS-PAGE. Create a step-by-step workflow diagram showing:
(1) Total protein extraction from tissue samples
(2) BCA protein quantification
(3) Sample preparation with loading buffer
(4) Gel electrophoresis setup
(5) Coomassie staining and imaging
Include timing annotations and key reagent concentrations.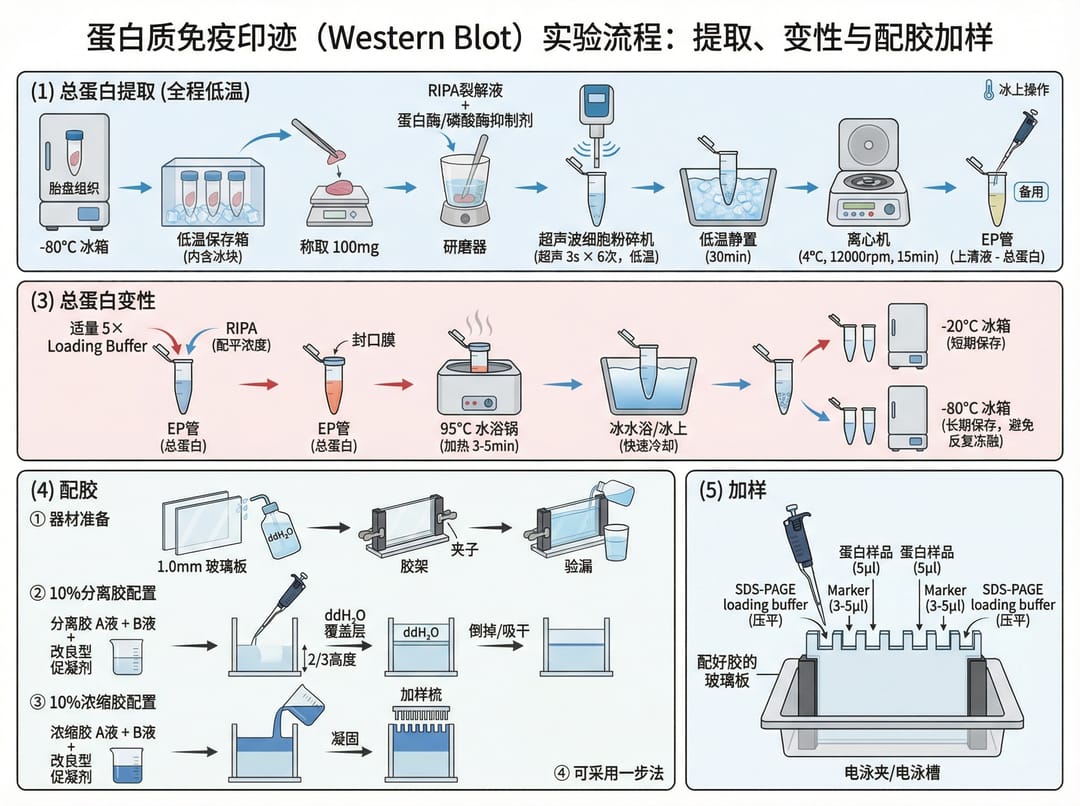
プロンプト:免疫組織化学(IHC)フローチャート
An immunohistochemistry (IHC) flowchart:
(1) Preparation of paraffin sections:
① Tissue fixation
② Dehydration and embedding
③ Sectioning at 4μm thickness
(2) Antigen retrieval (heat-induced or enzymatic)
(3) Blocking and primary antibody incubation
(4) Secondary antibody and DAB development
(5) Counterstaining and mounting
Use a vertical flow with icons for each step.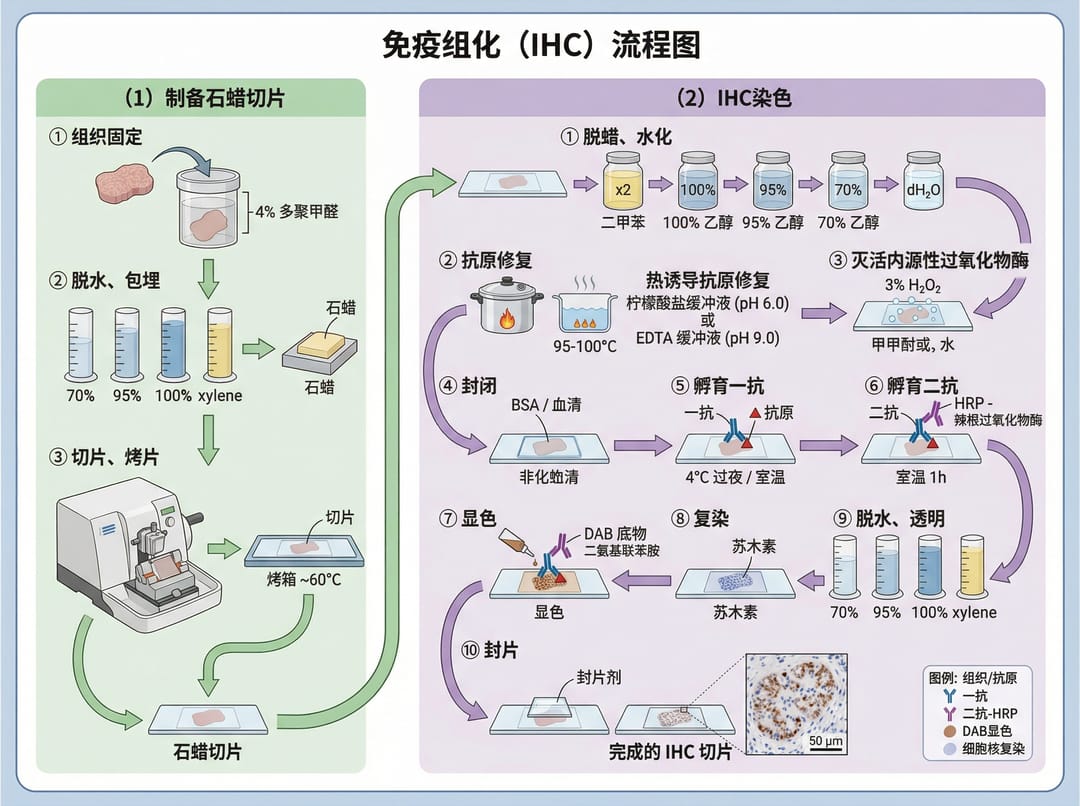
3.2 系統的レビューの手法
プロンプト:PRISMA 2020フロー図
Create a PRISMA 2020 flow diagram as a vertical process chart with a 4:3 aspect
ratio. Employ a clean, professional style with rectangular boxes connected by
arrows. Include four main sections: Identification (database searches, n=XXX),
Screening (title/abstract review, full-text assessment), Eligibility (inclusion/
exclusion criteria applied), and Included (final studies for synthesis). Add
boxes for duplicates removed and reasons for exclusion at each stage.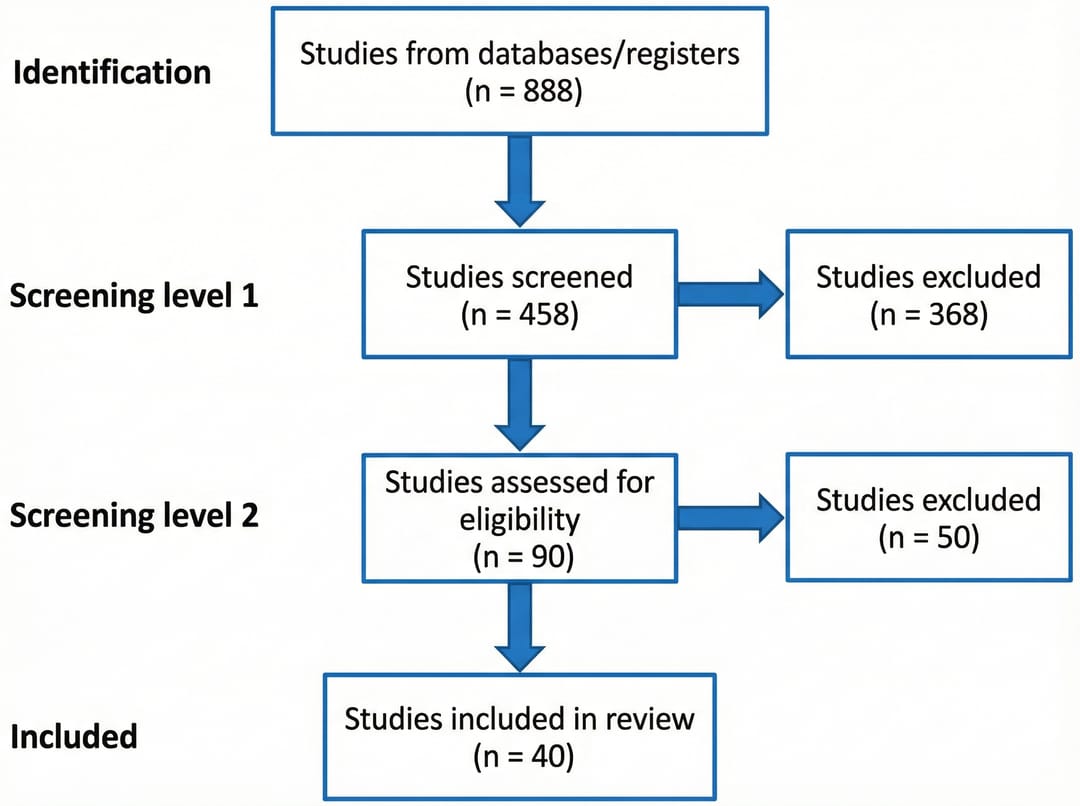
4. 臨床および医学イラストレーション
4.1 産婦人科
プロンプト:卵膜破裂のタイプ
Medical illustration depicting two distinct types of amniotic membrane rupture:
(1) A high leak, characterized by a small perforation in the upper portion of
the amniotic sac with gradual fluid loss
(2) A complete rupture at the cervical os with sudden, large-volume fluid
discharge
Show anatomical cross-sections with labeled structures including uterus,
placenta, amniotic fluid, and fetal position.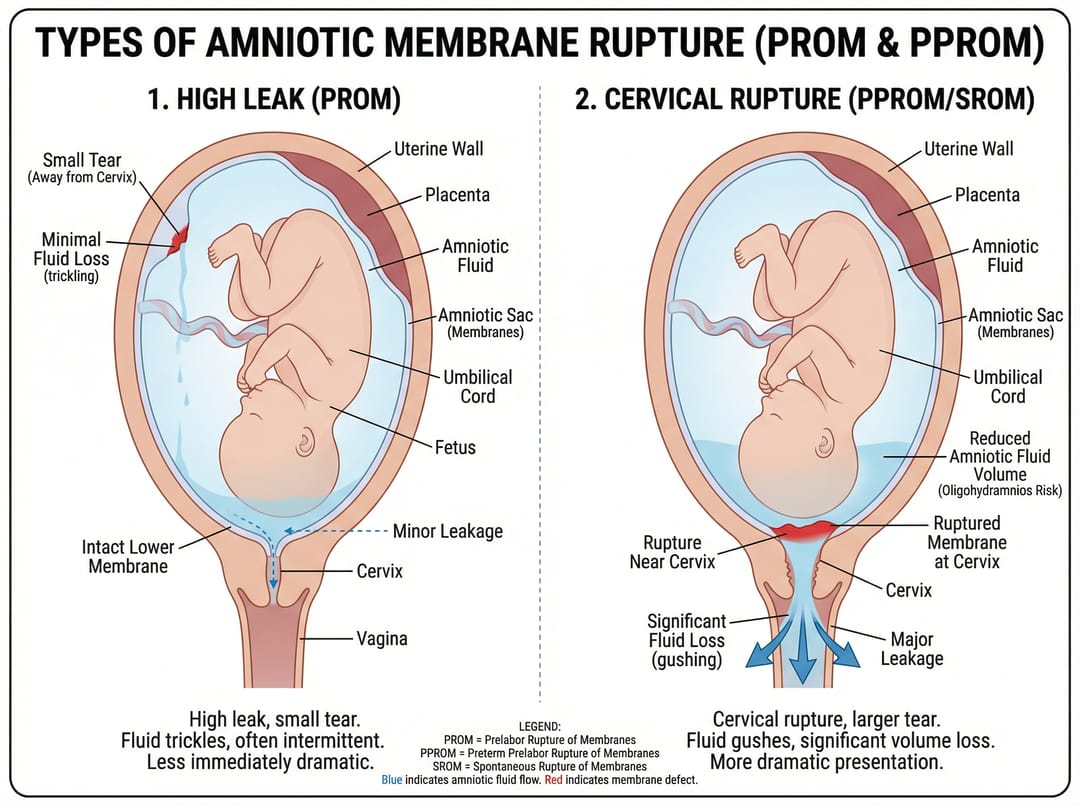
5. プロンプト作成のベストプラクティス
プロンプトを効果的に構成する
成功した645件のバイオメディカルプロンプトの分析に基づいた、重要な要素は以下の通りです:
1. コンテキストから始める
- イラストの種類を指定する(模式図、フローチャート、メカニズム図など)
- 対象読者を示す(ジャーナル投稿用、プレゼンテーション用、助成金申請用など)
2. 技術的な詳細を含める
- 特定のタンパク質、経路、または生物学的構造の名前を挙げる
- 正確な科学用語を使用する
- 関連する場合はスケールや倍率を指定する
3. 視覚的な要件を記述する
- アスペクト比(4:3 横長、3:4 縦長、16:9 ワイドスクリーンなど)
- 好みの配色
- ラベルの配置とフォントスタイル
- 接続矢印と流れの方向
4. 出版基準を参照する
- 該当する場合は、ターゲットとするジャーナルのスタイルに言及する
- 解像度の要件を指定する
- アクセシビリティへの配慮(色覚多様性に配慮したパレットなど)を記載する
一般的なプロンプトパターン
| 用途 | 含めるべき主要要素 |
|---|---|
| メカニズム図 | 分子コンポーネント、相互作用の矢印、時系列シーケンス |
| プロトコル・ワークフロー | ステップ番号、タイミング、試薬濃度、機器のアイコン |
| 解剖学的イラストレーション | 組織層、ラベル付き構造、断面図 vs 表面図 |
| データの視覚化 | 軸ラベル、凡例、統計的注釈、サンプルサイズ |
| 比較図 | 並列レイアウト、一貫したスタイリング、相違点の強調 |
バイオメディカル・イラストレーションの作成を始めましょう
プロフェッショナルな科学図を作成する準備はできましたか?SciDraw AIのAI搭載イラストレーションツールで、これらのプロンプトを試してみてください:
- 臨床イラストジェネレーター — AIで医学・解剖学イラストを作成
- 細胞イラストジェネレーター — AI細胞生物学図ツール
- 最初のイラストを作成する →
- ギャラリーで他の例を見る →
このガイドにあるすべてのプロンプトは実際の研究プロジェクトから引用されており、出版品質の結果が得られるようテストされています。ご自身の特定の研究ニーズに合わせてカスタマイズし、今日からプロフェッショナルなバイオメディカル・イラストレーションの生成を始めましょう。