«¿Y tu marco conceptual?». Esa pregunta tumba más defensas de anteproyecto que cualquier fallo metodológico. En el texto se puede matizar; en un esquema, no. Un diagrama de marco de investigación concentra en una sola página tus variables, tu lógica y los resultados que esperas, y en unos diez segundos se ve si esa lógica se sostiene.
El problema es que detrás de «marco de investigación» hay, como mínimo, tres figuras distintas. La mayoría de los borradores vuelven con correcciones no porque el estudiante no sepa dibujar, sino porque eligió el tipo de figura equivocado para su estudio.
Esta guía repasa las tres que de verdad te van a pedir —el modelo de variables, el esquema IPO y el marco general de investigación—: cuándo encaja cada una, qué rechaza el tribunal y cómo obtener un primer borrador a partir de una descripción en texto.
Lo que vas a aprender:
- Cuál de los tres tipos de marco necesita tu estudio
- Los errores concretos que el director de tesis te devuelve
- Un ejemplo completo de cada tipo
- Cómo generar un primer borrador a partir de un párrafo
Antes de dibujar relaciones entre variables, deja claro qué significa cada término y cómo se observa. La guía de operacionalización de variables, con ejemplos y una matriz de trabajo, te ayuda a que el marco sea coherente con tu metodología.
Tres tipos de marco, tres funciones distintas
| Tipo de marco | Qué responde | Ámbito habitual |
|---|---|---|
| Modelo de variables | ¿Qué variables influyen en cuáles y por qué vía? | Administración de empresas, psicología, educación, salud pública |
| Esquema IPO | ¿Qué entra, qué proceso se sigue y qué sale? | Sistemas de información, TFG de ingeniería y proyectos de desarrollo de software |
| Marco general de investigación | ¿Cómo se conectan el problema, la teoría, los contenidos, los métodos y los resultados? | Casi cualquier tesis, sobre todo en la fase de anteproyecto |
La prueba es sencilla. Si tu estudio mide variables y contrasta hipótesis, necesitas un modelo de variables. Si construye algo, necesitas un IPO. Si tiene que mostrar al tribunal cómo encaja todo el trabajo, necesitas un marco general. Muchas tesis incluyen dos: un marco general en el anteproyecto y un modelo de variables en el capítulo de metodología.
Tipo 1: El modelo de variables
Es el marco que necesitan la mayoría de las tesis cuantitativas. Muestra las variables independientes, la variable dependiente y las relaciones entre ellas, incluido todo lo que se sitúa sobre esas relaciones o las modifica.
Qué debe incluir:
- Variables independientes (VI) a la izquierda, cada una en su propio recuadro
- Variable dependiente (VD) a la derecha
- Variables mediadoras sobre la propia ruta, entre la VI y la VD
- Variables moderadoras arriba o abajo, con una flecha que apunte a la ruta que moderan, no a una variable
- Variables de control en un recuadro aparte, normalmente abajo a la izquierda y sin conectar
- Etiquetas de hipótesis (H1, H2, H3) sobre las flechas, si en el texto las numeras
Ejemplo completo: adopción de tecnología
Variables independientes: utilidad percibida y facilidad de uso percibida. Variable mediadora: actitud hacia el uso. Variable dependiente: intención de uso. Variable moderadora: confianza, que actúa sobre la ruta actitud → intención. Las hipótesis H1 a H4 van sobre las cuatro flechas.
Bien dibujado, cualquier lector puede enunciar tus hipótesis mirando solo la figura. Ese es el listón real.
Lo que te devuelven:
- Una moderadora dibujada como otra variable independiente. La moderadora cambia la intensidad de una relación. Su flecha tiene que caer sobre otra flecha, no sobre un recuadro.
- Métodos convertidos en variables. «Encuesta por cuestionario» o «análisis de regresión» no son constructos. Su sitio es el diagrama de ruta técnica, no este.
- Flechas sin dirección ni significado. Cada flecha es una hipótesis. Si no sabes qué hipótesis representa una flecha, bórrala.
- Falta de fundamentación teórica. Si no se ve que el marco sale de una teoría o de resultados previos, prepárate para que te pregunten de dónde lo has sacado.
Tipo 2: El esquema IPO
Los esquemas de entrada-proceso-salida (Input-Process-Output) son el estándar en sistemas de información, proyectos finales de ingeniería y trabajos de desarrollo de sistemas, y son especialmente habituales en universidades de Filipinas y del sudeste asiático. La figura son tres recuadros en fila, a veces con un bucle de evaluación.
Qué va en cada parte:
- Entrada: todo lo que reúnes antes de construir: requisitos de conocimiento (las reglas del dominio, las normas técnicas y la legislación que debes cumplir), requisitos de software, requisitos de hardware y datos de los usuarios encuestados
- Proceso: la metodología de desarrollo y sus fases: levantamiento de requisitos, diseño, programación, pruebas y despliegue, con el nombre del modelo que hayas seguido (ágil, en cascada, RAD)
- Salida: el entregable en sí, descrito de forma concreta
- Evaluación: una flecha que vuelve de la salida a la entrada, si evaluaste el sistema y retroalimentaste los resultados
Ejemplo completo: sistema de historias clínicas para un centro de salud de barrio
Entrada: requisitos de conocimiento (gestión de historias clínicas, normativa de protección de datos personales); requisitos de software (PHP, MySQL, Bootstrap); requisitos de hardware (estación de trabajo, impresora). Proceso: levantamiento de requisitos, diseño del sistema, programación, pruebas y despliegue, siguiendo una metodología ágil. Salida: un sistema web de historias clínicas para el centro de salud. Una flecha de evaluación vuelve de la salida a la entrada.
Lo que te devuelven:
- Un recuadro de proceso que solo dice «desarrollo». Nombra las fases y la metodología.
- Una salida que es un deseo, no un entregable. «Mayor eficiencia» es un efecto, no una salida. La salida es el sistema.
- Mezclar el IPO con un modelo de variables. Si te ves metiendo una variable mediadora dentro del recuadro de proceso, has elegido el tipo de marco equivocado.
Tipo 3: El marco general de investigación
Es la figura de una página que responde a «¿cómo encaja todo tu estudio?». En la fase de anteproyecto, muchos tribunales la quieren ver antes que ninguna otra.
Estructura, de arriba abajo:
- Contexto o problema de investigación: una línea, formulada como problema, no como tema
- Fundamentación teórica: las teorías o modelos en los que se apoya el estudio, uno al lado del otro
- Contenidos de la investigación: de dos a cuatro bloques, cada uno una subpregunta que de verdad vas a responder
- Métodos y datos: debajo de cada bloque, el método y la fuente de datos concretos de ese bloque
- Resultados esperados y aportaciones: lo que produce cada bloque
El valor de esta figura es que obliga a una correspondencia uno a uno. Cada bloque de contenido necesita un método debajo y un resultado debajo del método. El bloque que se queda sin método es justo el hueco que va a encontrar el tribunal.
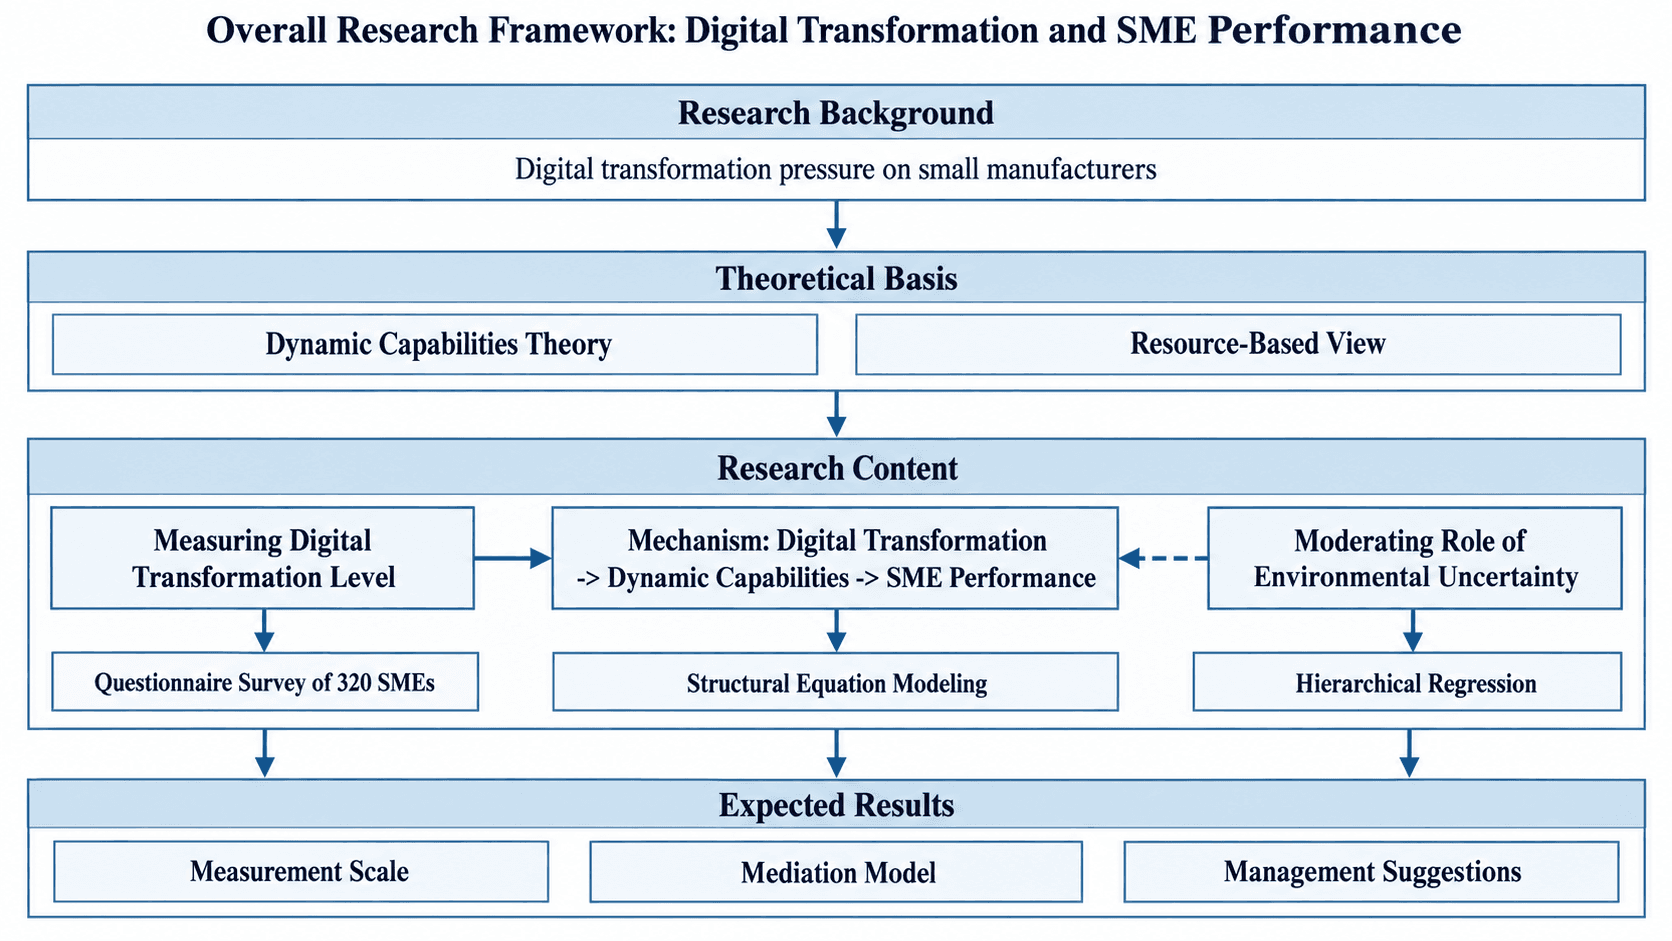
Ejemplo completo: transformación digital y desempeño de las pymes
Contexto: las pequeñas empresas manufactureras sufren presión para digitalizarse sin tener claro el retorno. Fundamentación teórica: teoría de las capacidades dinámicas y visión basada en recursos. Contenidos: (1) medir el grado de transformación digital; (2) el mecanismo que lleva de la transformación al desempeño a través de las capacidades dinámicas; (3) el papel moderador de la incertidumbre del entorno. Métodos: encuesta a 320 pymes, modelos de ecuaciones estructurales y regresión jerárquica. Resultados esperados: una escala de medición, un modelo de mediación y recomendaciones para la gestión.
Lo que te devuelven:
- Bloques de contenido que son títulos de capítulo. «Marco teórico» o «revisión de la literatura» no son contenidos de investigación. Un contenido de investigación es una pregunta que respondes con datos.
- Una capa teórica que no vuelve a aparecer. Si la teoría de las capacidades dinámicas está arriba pero no toca ningún bloque de contenido, el evaluador preguntará qué pinta ahí.
- Cuatro métodos para tres bloques, o ninguno para uno de ellos. La correspondencia es precisamente lo que se evalúa.
Generar un primer borrador a partir de texto
Arrastrar recuadros en PowerPoint y rehacer flechas después de cada comentario del director es el camino lento. Lo más rápido es escribir el marco como un párrafo, generar un borrador y luego pulirlo.
El creador de marco conceptual separa ahora los tres tipos en modos de trabajo, que se cambian encima del cuadro de texto:
- Modelo de variables: enumera tus VI, VD, mediadoras, moderadoras y los números de hipótesis, y las coloca en las rutas correctas
- Esquema IPO: enumera lo que va en cada una de las tres columnas y las mantiene separadas
- Marco de investigación general: indica contexto, teoría, bloques de contenido, métodos y resultados esperados, y los apila dejando visible la correspondencia
Elige primero el modo. Las restricciones de la indicación cambian de un modo a otro, y por eso un modelo de variables generado en el modo de marco general sale con aspecto de índice y no de diagrama de rutas.
Dos cosas que conviene saber. El generador dibuja solo las variables y relaciones que le das: no se inventa una mediadora para que tu modelo luzca mejor, que es exactamente lo que quieres en una figura de tesis. Y si lo que necesitas en realidad es la cadena de métodos y no la estructura de variables, eso es otra figura: usa el modo de ruta técnica.
Para el resto de figuras que pide una tesis, explora las figuras de tesis por disciplina y abre directamente la plantilla que corresponda.
Preguntas frecuentes
¿Qué tipo de marco necesita mi tesis? Si contrastas hipótesis sobre variables, usa el modelo de variables. Si construyes un sistema o un producto, usa el IPO. Si preparas la defensa del anteproyecto y tienes que mostrar el estudio completo, usa el marco general. Una tesis puede contener perfectamente dos de ellos en capítulos distintos.
¿Es lo mismo marco conceptual que marco teórico? Se solapan, pero no son idénticos. El marco teórico es el conjunto de teorías que adoptas; el marco conceptual es tu propio esquema de cómo se relacionan los constructos en tu estudio. En la mayoría de los programas se espera que la teoría se discuta en el texto y que el marco se presente como figura.
¿Cuántas variables debe tener un diagrama de marco? Las necesarias para enunciar tus hipótesis, y ni una más. A partir de unos ocho recuadros, el lector deja de seguir las rutas. Si tu modelo es realmente más grande, divídelo: una figura de marco general y un modelo de variables detallado para cada subestudio.
¿Puedo reutilizar el marco del anteproyecto en la tesis final? Sí, y deberías: un marco que cambia sin avisar entre el anteproyecto y la defensa provoca preguntas. Guarda una versión editable, actualízala cuando cambie tu modelo y explica el cambio en el texto en lugar de redibujarlo en silencio.