La investigación en ciencias ambientales requiere visualizaciones claras de los procesos ecológicos, las rutas de contaminación y los marcos de sostenibilidad. Esta guía presenta 30 prompts de IA probados a partir de investigaciones ambientales reales, ayudándole a crear diagramas listos para publicación en revistas, informes y presentaciones.
Lo que encontrará en esta guía:
- Diagramas de procesos ecológicos y ciclos biogeoquímicos
- Ilustraciones de fuentes y rutas de contaminación
- Marcos de diseño sostenible y optimización
- Mapas de ruta técnicos para la investigación ambiental
1. Diseño Sostenible y Optimización
1.1 Diseño Solar Pasivo
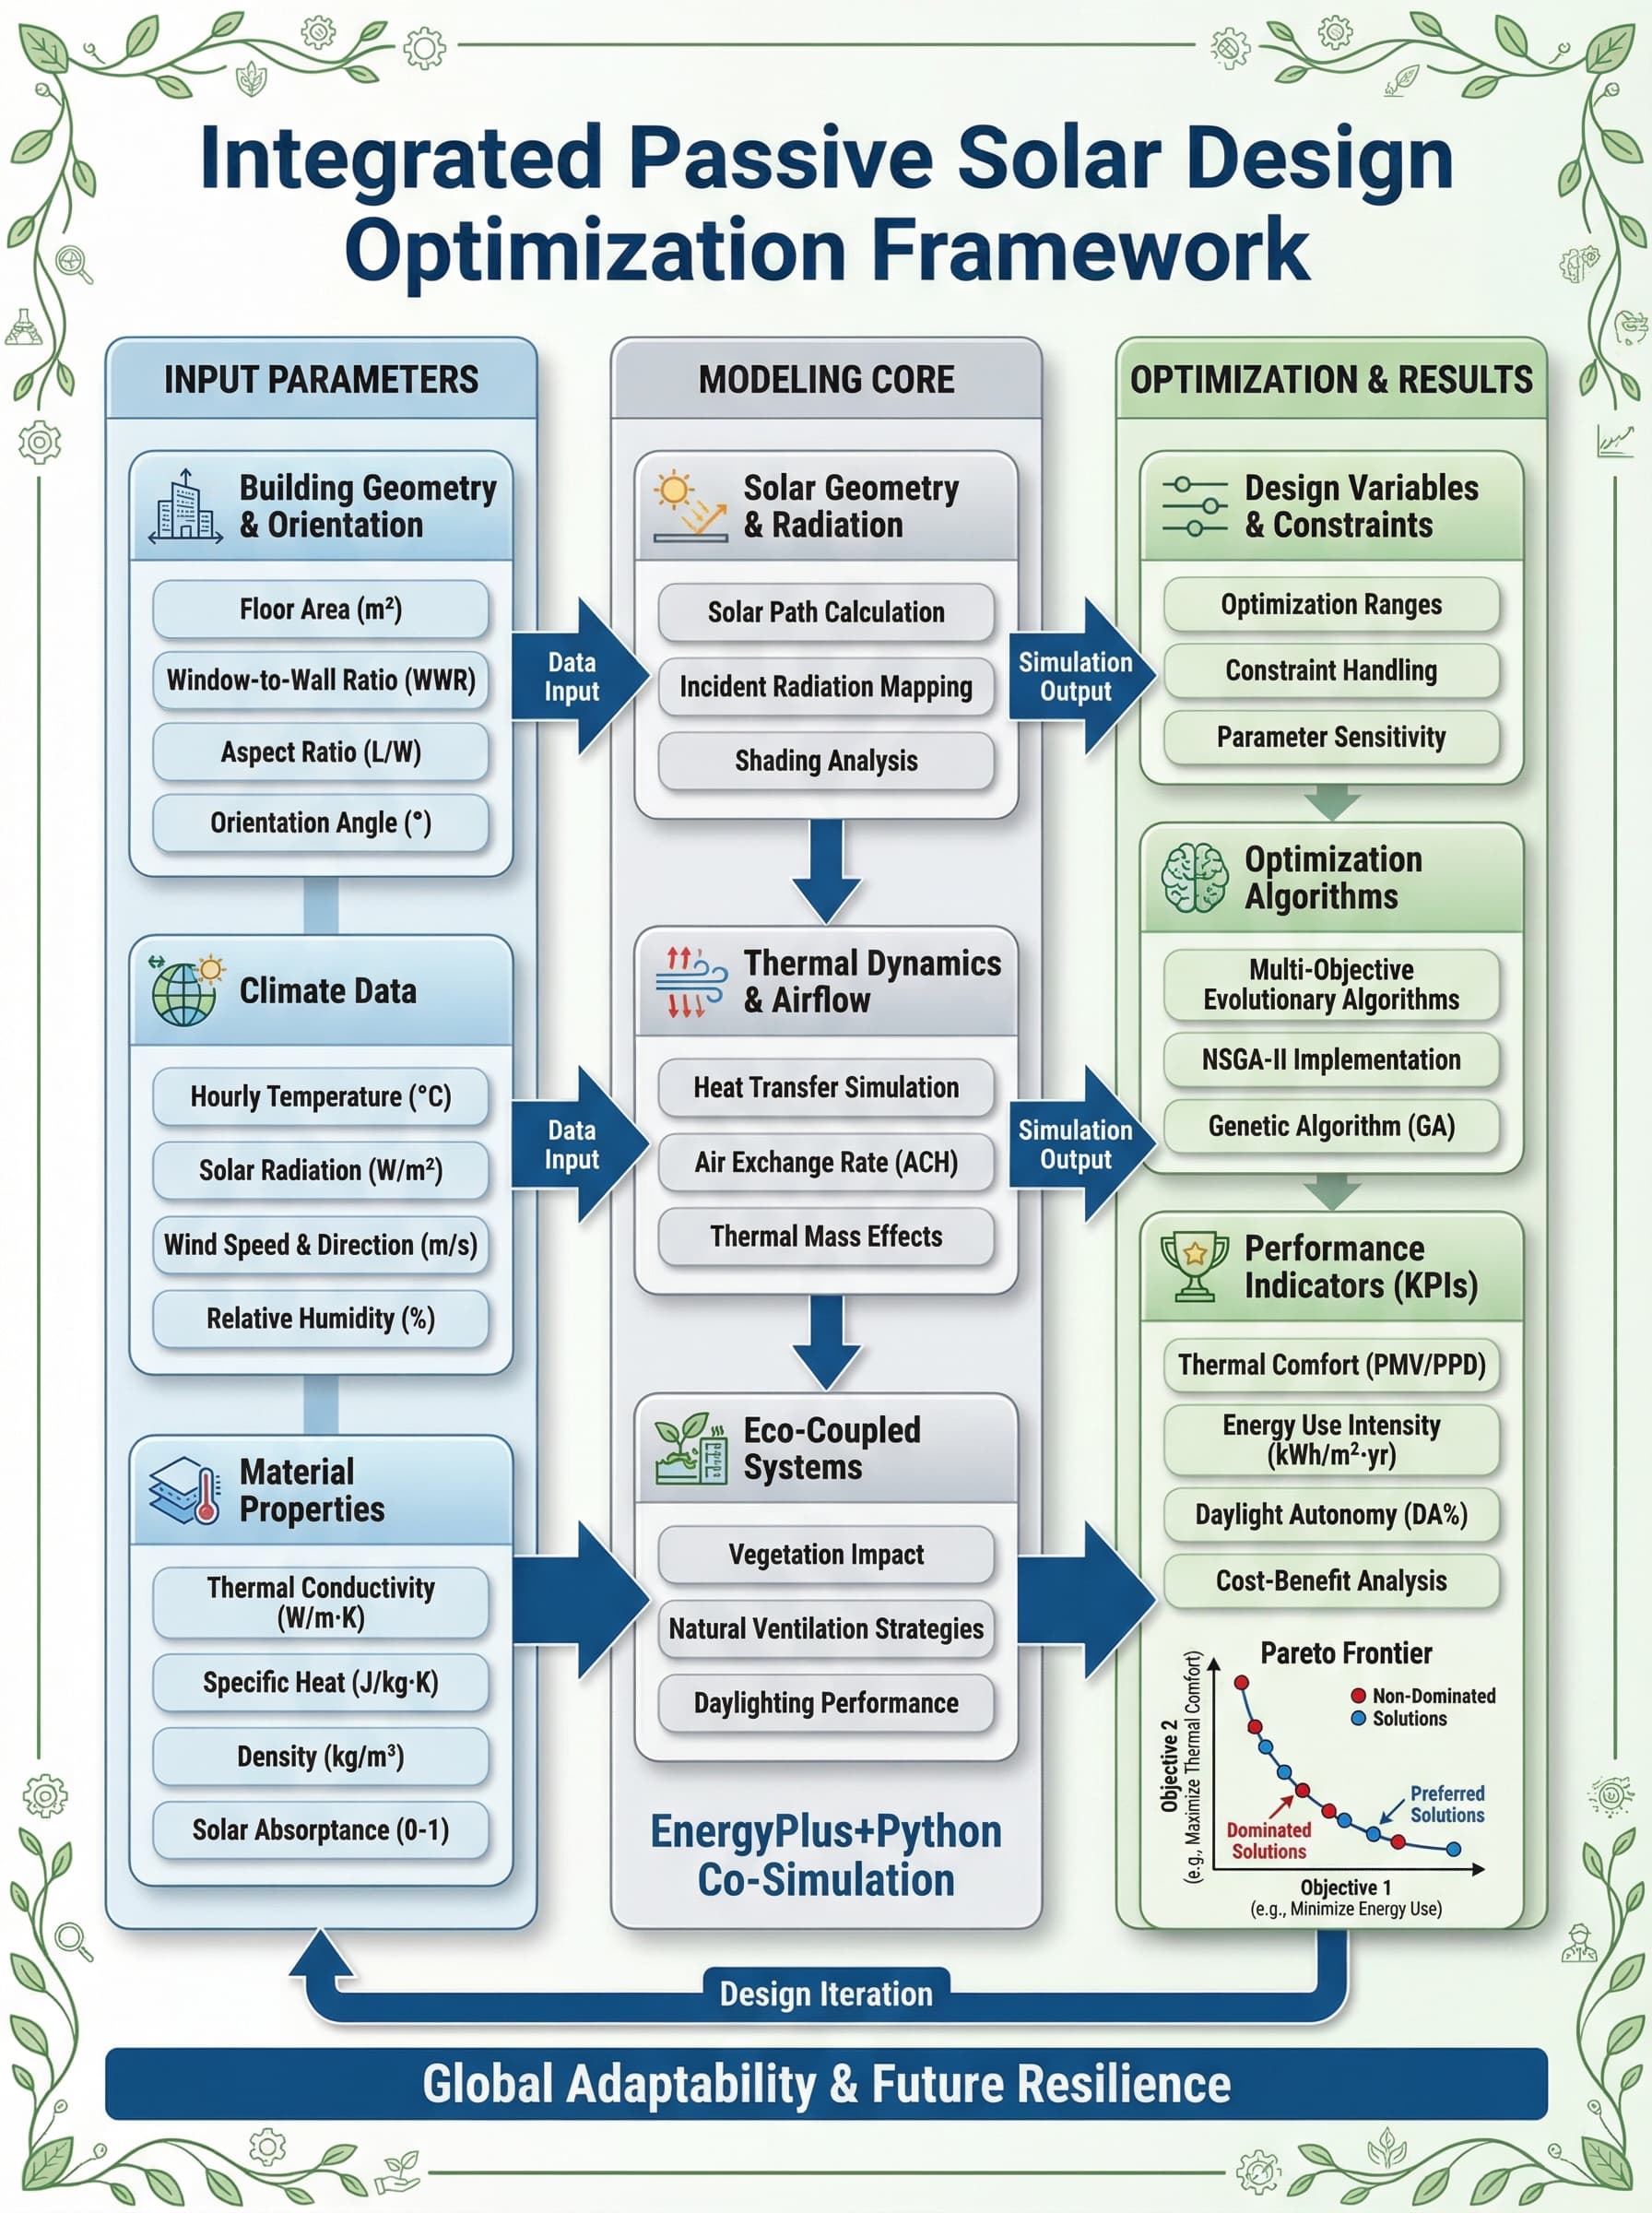
Prompt: Integrated Passive Solar Design Framework
Generate a landscape-oriented scientific framework diagram in English, titled
"Integrated Passive Solar Design Optimization Framework". Show:
- Building orientation and solar geometry
- Thermal mass placement strategies
- Natural ventilation pathways
- Daylighting optimization zones
- Energy performance indicators
- Integration with active systems
Use a professional scientific diagram style with clear hierarchical structure.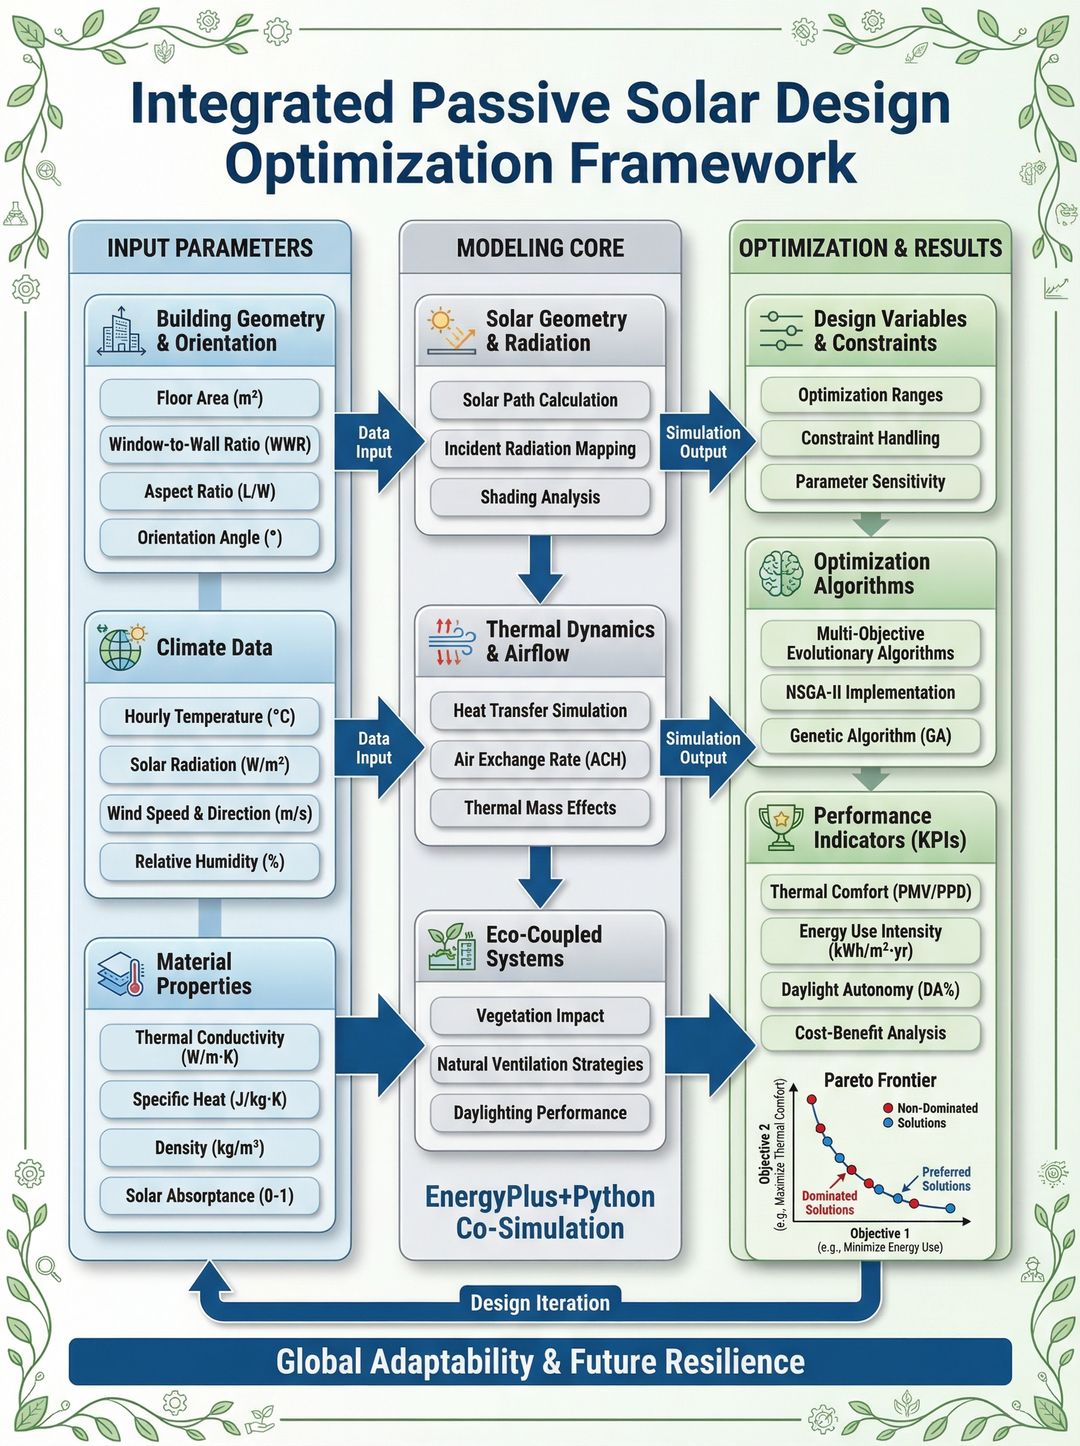
1.2 Respuesta al Estrés Agrícola
Prompt: Environmental Stress Effects on Crops
Environmental stress and suboptimal planting schedules significantly limit
cauliflower production by disrupting developmental processes. Create a diagram
showing:
- Temperature stress effects on plant physiology
- Water stress indicators and thresholds
- Developmental stage sensitivity windows
- Yield loss pathways
- Mitigation strategies (irrigation, shading)
Include both stress mechanism and management response panels.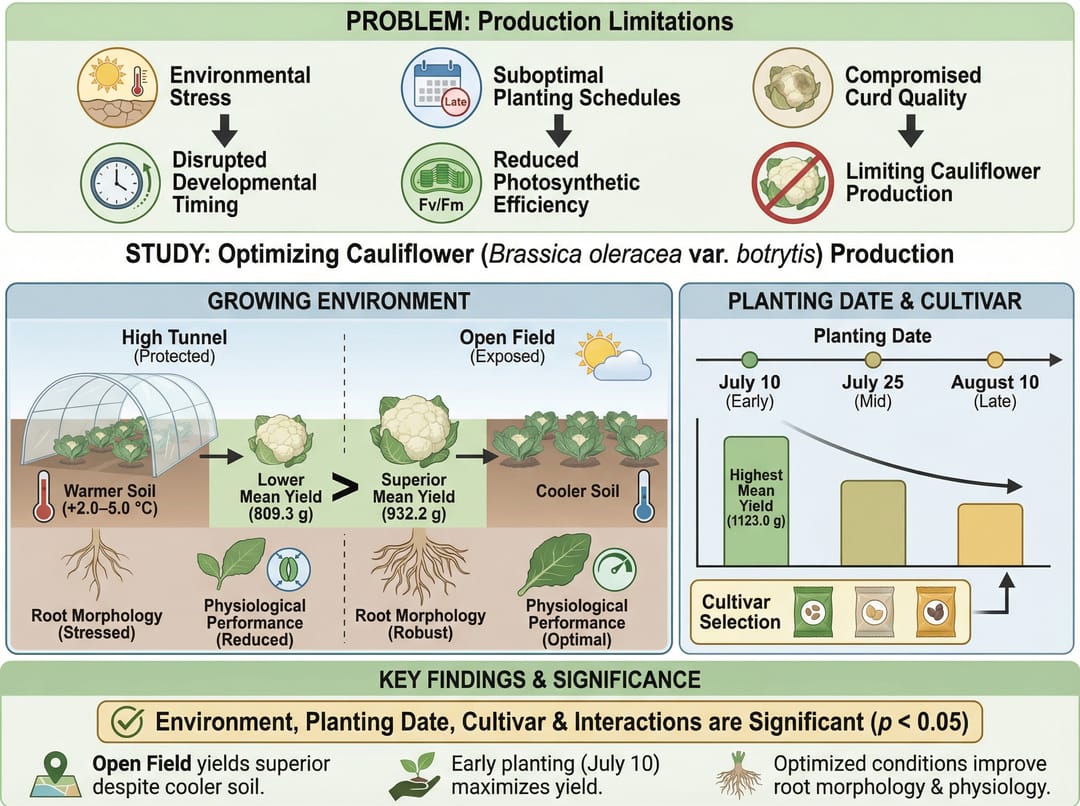
2. Ciclos Biogeoquímicos
2.1 Procesos del Nitrógeno en el Suelo
Prompt: Farmland Soil Nitrification Mechanism
Draw a schematic diagram illustrating the mechanism of the nitrification process
in farmland soil. With ammonia oxidation as the central process, show:
- NH4+ to NO2- conversion (ammonia-oxidizing bacteria)
- NO2- to NO3- conversion (nitrite-oxidizing bacteria)
- Environmental factors affecting rates (pH, temperature, moisture)
- Coupling with denitrification
- N2O emission pathways
Use soil profile cross-section with microbial community visualization.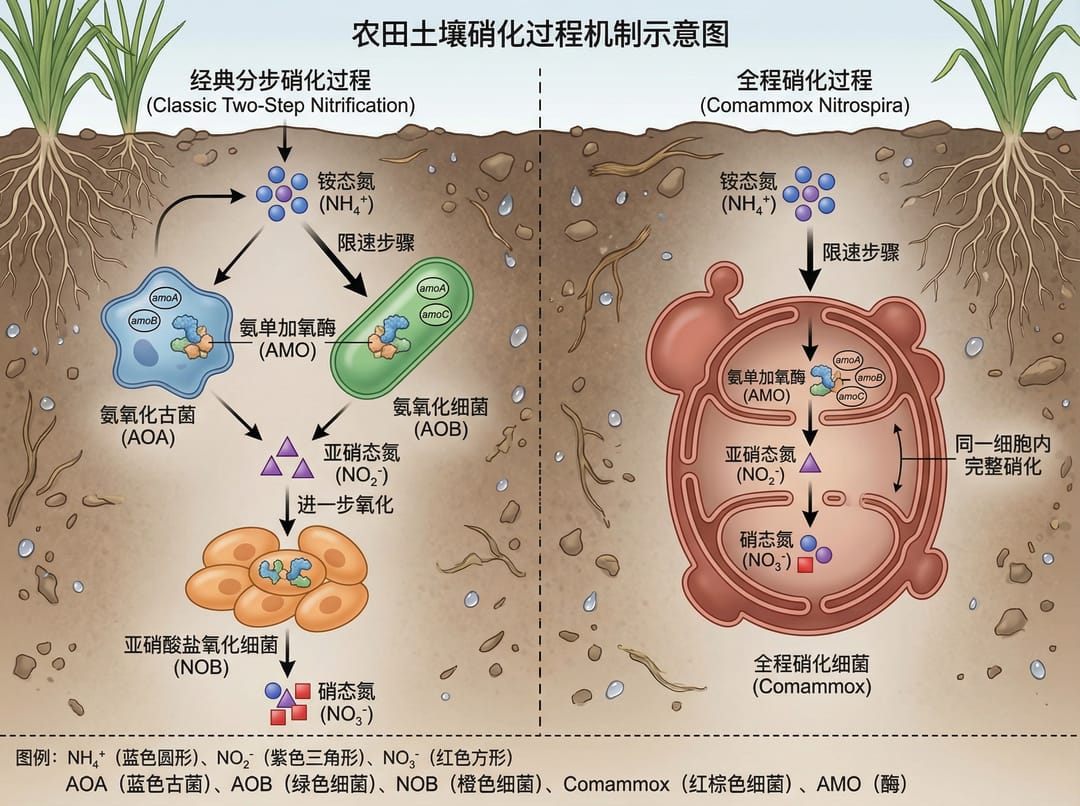
3. Contaminantes Emergentes
3.1 Fuentes y Rutas de Contaminación
Prompt: Emerging Contaminant Sources
Emerging contaminants originate from diverse sources, with their release closely
linked to human production and lifestyle activities. Create an illustration showing:
- Pharmaceutical sources (hospitals, households, manufacturing)
- Personal care product pathways
- Agricultural chemical inputs
- Industrial discharge points
- Transport through water, soil, and air
- Exposure routes to ecosystems and humans
Use a circular or network diagram style.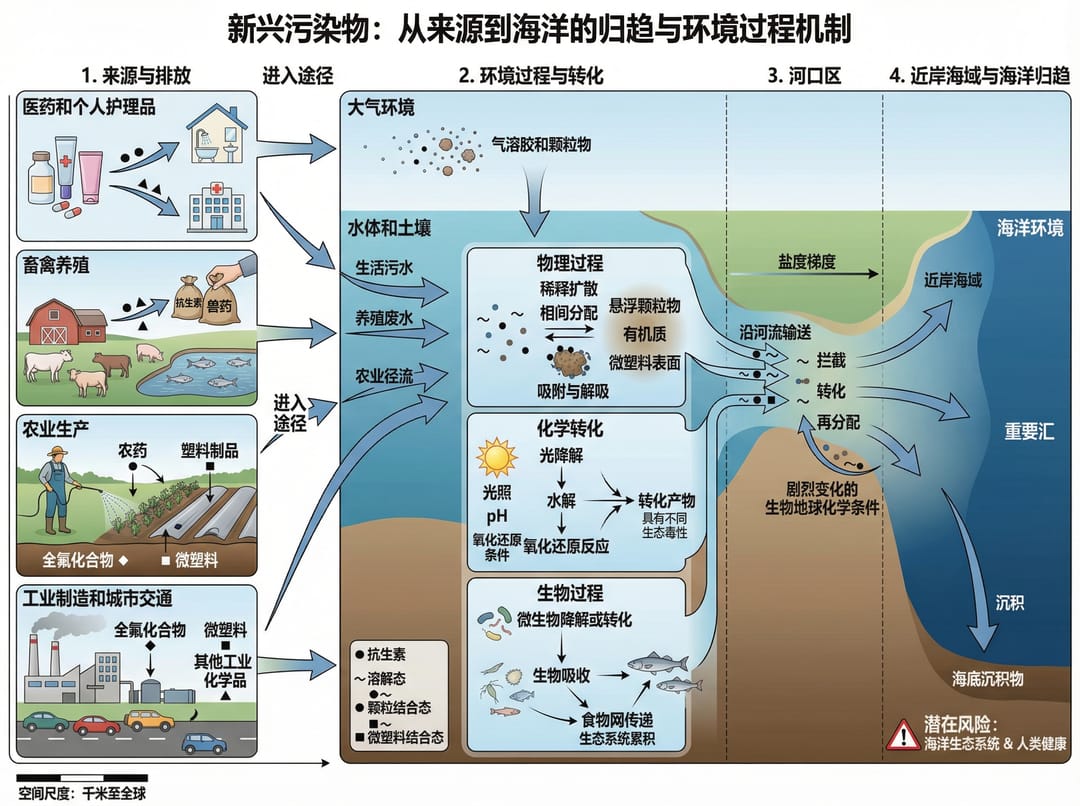
3.2 Transferencia en la Red Trófica Marina
Prompt: PPCPs Trophic Transfer in Marine Systems
Could you help me generate a technical roadmap? I am a graduate student studying
the trophic transfer of PPCPs (pharmaceuticals and personal care products) in
marine food webs. Show:
- Primary producer uptake mechanisms
- Bioaccumulation at each trophic level
- Biomagnification factors
- Metabolic transformation pathways
- Human exposure through seafood consumption
- Research methodology workflow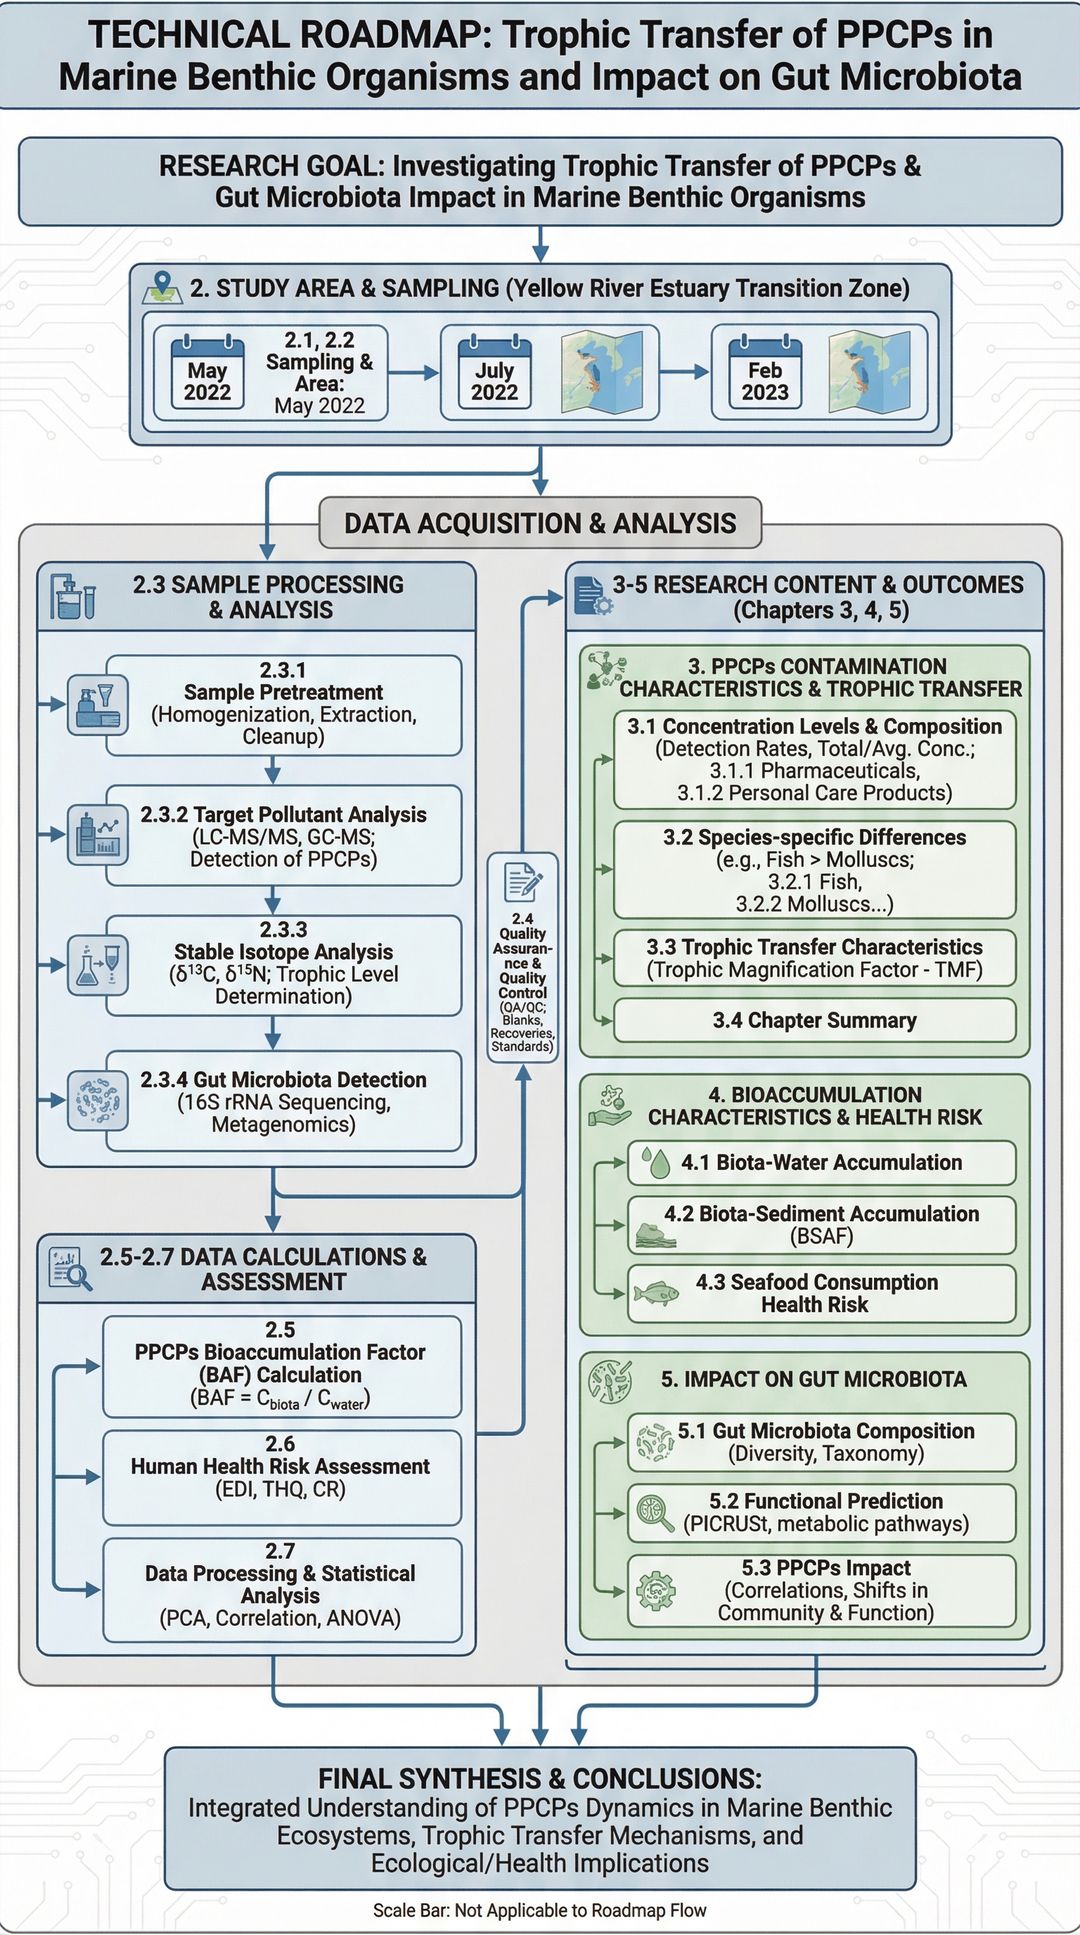
3.3 Procesos Ecológicos y Riesgos para la Salud
Prompt: PPCPs Ecological and Health Risk Framework
This study focuses on the ecological processes and health risks of emerging
contaminants, specifically pharmaceuticals and personal care products in aquatic
environments. Create a framework diagram showing:
- Source identification and quantification
- Environmental fate and transport
- Ecological toxicity pathways
- Human health risk assessment
- Regulatory framework and monitoring
Use a hierarchical or flow-based structure.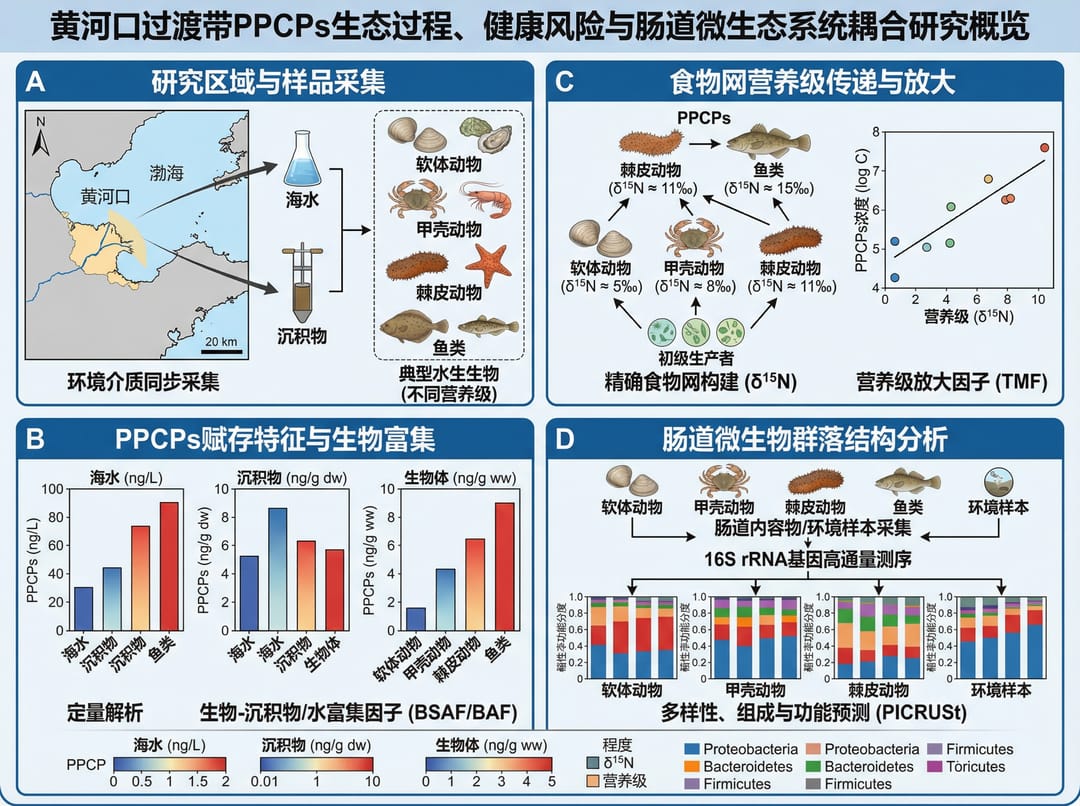
4. Estudios Ambientales Regionales
4.1 Ecosistemas de Estuarios
Prompt: Yellow River Estuary Technology Roadmap
Generate a technology roadmap. This study focuses on the ecologically sensitive
Yellow River Estuary transition zone as a case study. Include:
- Study area characterization
- Research objectives and hypotheses
- Sampling and monitoring strategy
- Data analysis methods
- Expected outcomes and applications
- Timeline and milestones
Use a professional research roadmap format.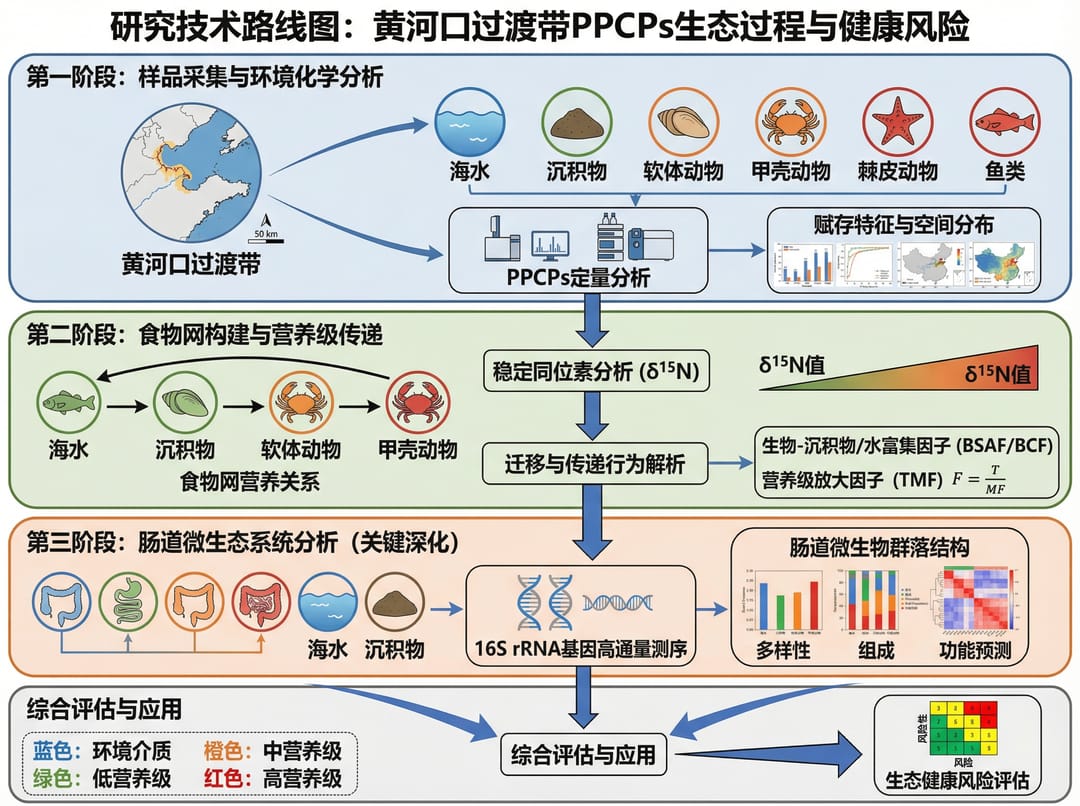
5. Marcos de Problema-Solución
5.1 Infografías Circulares
Prompt: Wind Erosion Problem Cascade
Scientific illustration, circular infographic format.
Top Half: Problem Cascade illustrating the effects of wind erosion:
- Soil loss and degradation
- Nutrient depletion
- Vegetation damage
- Air quality impacts

Bottom Half: Solution Framework showing:
- Windbreak establishment
- Cover cropping
- Tillage management
- Monitoring and assessment
Use a professional circular infographic with clear visual hierarchy.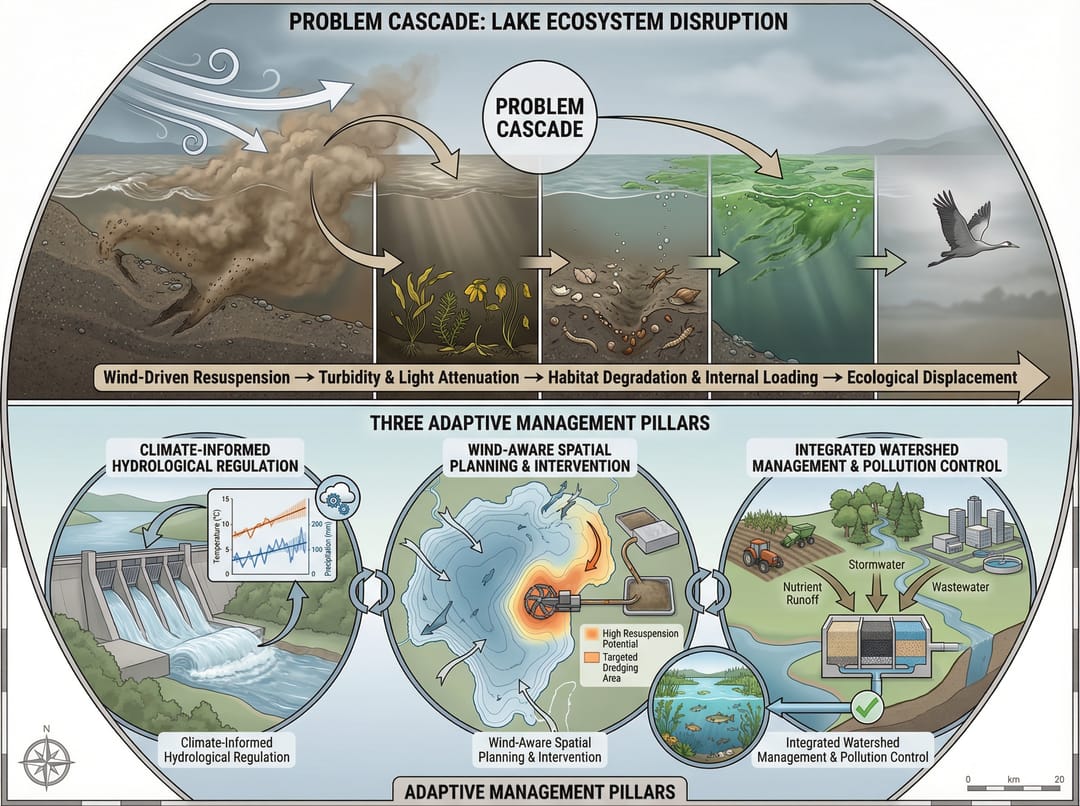
6. Infraestructura y Sostenibilidad
6.1 Utilización de Materiales para el Firme de Carreteras
Prompt: Roadbed Filling Materials Research
1.1 Research Significance
The efficient utilization of roadbed filling materials is a concrete
implementation of key transportation sustainability goals. Create a figure showing:
- Material sources (recycled, natural, industrial byproducts)
- Processing and treatment methods
- Performance requirements and testing
- Environmental benefits quantification
- Life cycle assessment framework
Use a research significance diagram style.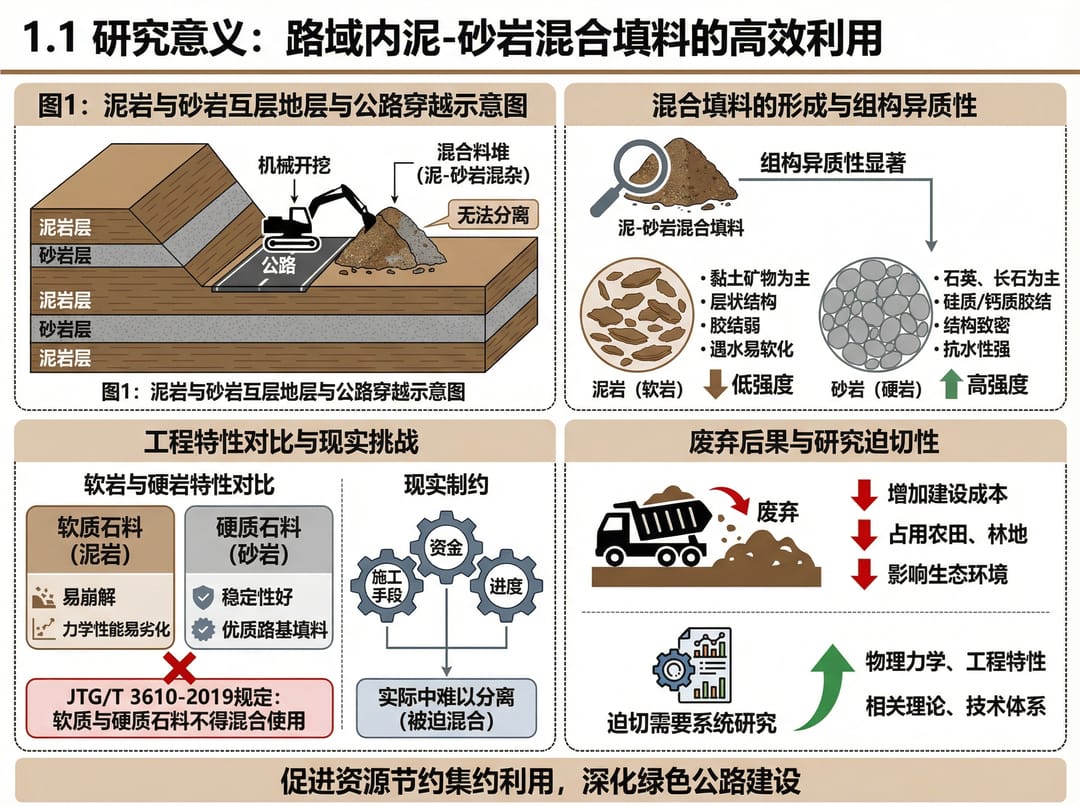
7. Mejores Prácticas para Diagramas de Ciencias Ambientales
Elementos Clave por Tipo de Diagrama
| Tipo de Diagrama | Componentes Esenciales |
|---|---|
| Ciclos Biogeoquímicos | Reservorios, flujos, procesos de transformación, agentes microbianos |
| Rutas de Contaminación | Fuentes, medios de transporte, receptores, rutas de exposición |
| Estudios de Ecosistemas | Niveles tróficos, flujo de energía, ciclo de nutrientes, interacciones entre especies |
| Marcos de Sostenibilidad | Entradas, salidas, bucles de retroalimentación, indicadores |
Consejos para Prompts de Ciencias Ambientales
- Incluir escala: Temporal (diaria, estacional, anual) y espacial (local, regional, global)
- Mostrar datos cuantitativos: Tasas de flujo, concentraciones, porcentajes
- Indicar incertidumbre: Barras de error, intervalos de confianza cuando sea aplicable
- Referenciar estándares: EPA, WHO o umbrales regulatorios regionales
- Usar símbolos reconocidos: Símbolos estándar para procesos y compartimentos
Comience a Crear sus Diagramas de Ciencias Ambientales
Pruebe estos prompts con las herramientas de ilustración de IA de SciDraw AI: