LogoLogoSciDraw AI
  • Start Creating
  • Tools
  • Blog
  • Pricing
  • Education Discount
LogoLogoSciDraw AI

AI-powered scientific figure platform for researchers, students, educators, and science communicators. Create publication- and classroom-ready figures, graphical abstracts, TOC graphics, posters, and teaching illustrations in minutes. No design skills required.

EmailYouTubeXGitHubLinkedInInstagramStripe ClimateStripe Climate Contribution
Tools
  • AI Drawing
  • Graphical Abstract Maker
  • Scientific Figure Maker
  • Image Converter
  • Vectorize Image
  • All Tools
Popular tools
  • Scientific Diagram Maker
  • Scientific Poster Maker
  • Research Poster Template
  • Plant Cell Diagram
  • Lewis Dot Structure Generator
  • Molecular Orbital Diagram Generator
  • PRISMA Flow Diagram Generator
  • Conceptual Framework Maker
Use Cases
  • For PhD Students
  • For Educators
  • For Journal Submission
  • BioRender Alternative
Resources
  • Blog
  • Gallery
  • Published references
  • Media Kit
  • Developers
Company
  • About
  • Pricing
  • Affiliate
  • Institutional invoicing
  • Privacy Policy
  • Terms of Service
© 2026 SciDraw AI All Rights Reserved.
How to Make a PCR Diagram with AI: Step-by-Step Guide (2026)
2026/06/18

How to Make a PCR Diagram with AI: Step-by-Step Guide (2026)

Learn how to make a PCR diagram with AI step by step — set up the denaturation, annealing, and extension cycle, add a qPCR amplification curve, label every step, and export a publication-ready figure. A reusable template, worked examples, and fixes for common mistakes.

A clear PCR diagram is one of the most reused figures in molecular biology — it shows up in methods sections, lab reports, lecture slides, and grant applications. But drawing the three-step cycle by hand, with neatly labeled denaturation, annealing, and extension stages, takes far longer than it should. This guide shows you how to make a PCR diagram with AI from start to finish: how to describe the cycle, label every step, add a qPCR amplification curve, and export a clean, publication-ready PCR figure — no design software and no drawing skills required.

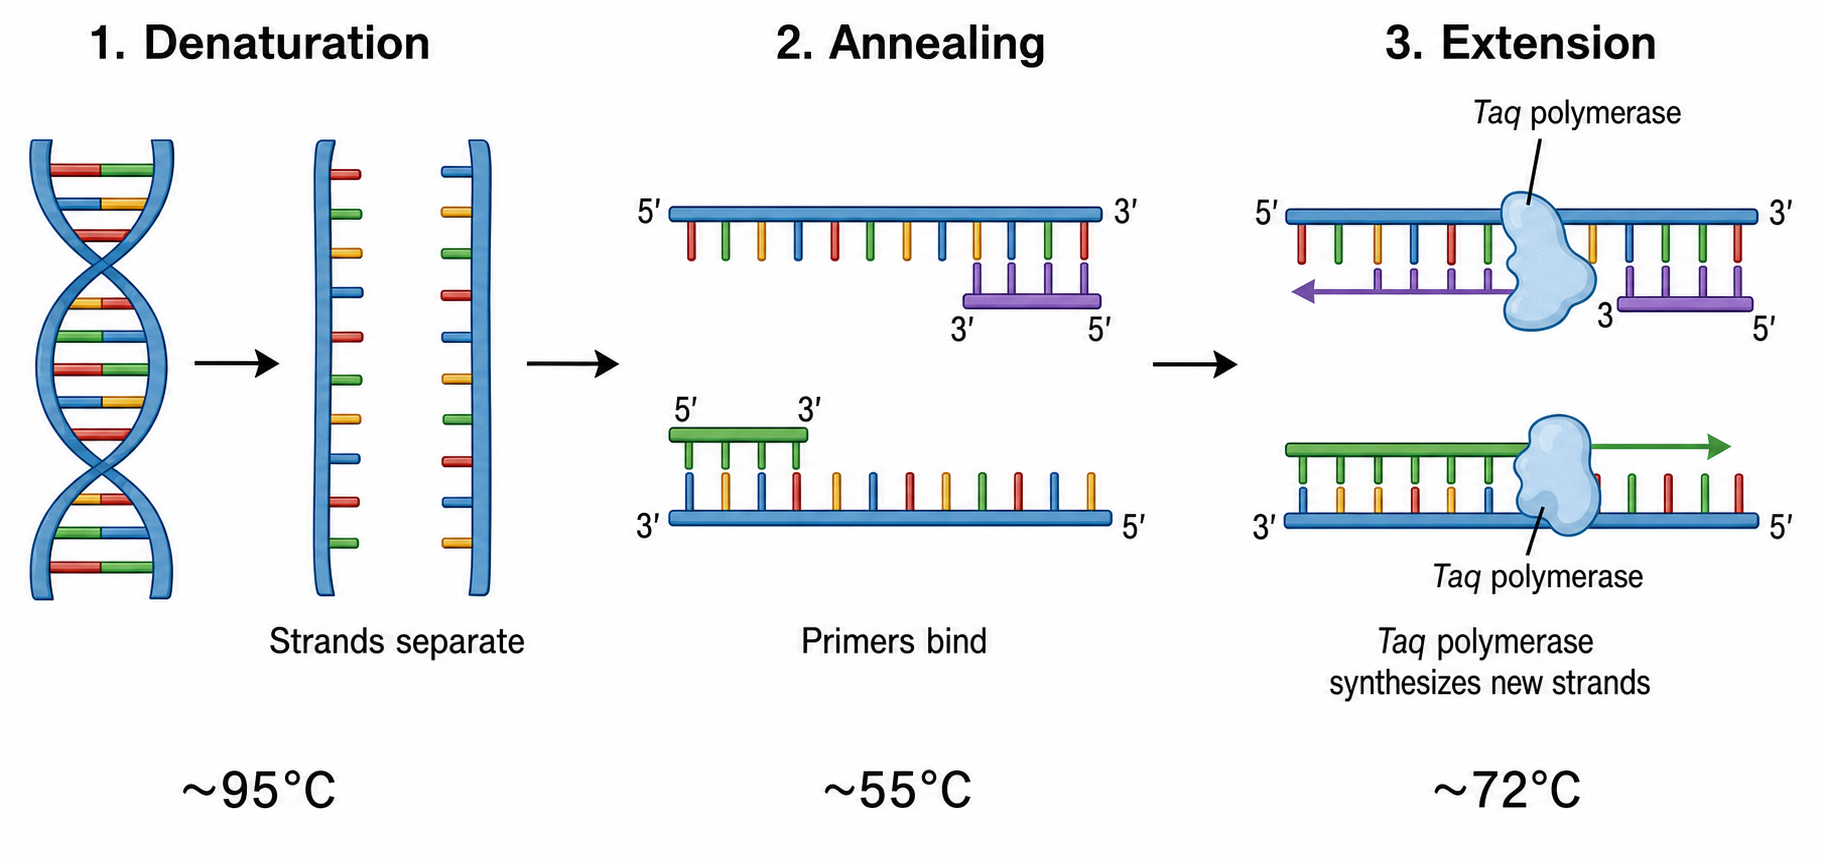
Labeled PCR cycle diagram showing denaturation, annealing, and extension steps with primers, template DNA, and Taq polymerase

By the end of this guide you'll be able to:

  • Generate a PCR cycle diagram showing denaturation, annealing, and extension from a single sentence.
  • Add temperatures and labels to each step so the figure reads correctly at a glance.
  • Create a qPCR amplification plot with a threshold line and Ct value next to your schematic.
  • Edit and export your PCR figure to editable SVG or PPTX for a paper, poster, or slide deck.

Every step below is done by typing an instruction into the PCR Diagram Generator, then refining the result in the SciDraw AI editor — the AI-native workspace where your image is the canvas and language is the tool.

Step 1: Describe the PCR cycle clearly

The quality of your figure depends almost entirely on how you describe it. A strong PCR diagram prompt has four parts:

  1. Subject — what you're drawing (e.g. "one cycle of standard PCR").
  2. Steps — the stages in order (denaturation → annealing → extension).
  3. Labels — every element you want named (template strands, primers, Taq polymerase, dNTPs, temperatures).
  4. Style & layout — "flat vector, publication-ready, left-to-right flow."

Template: "Draw [PCR process] showing [steps in order]. Label [strands, primers, enzyme, temperatures]. Use a clean flat-vector style with a left-to-right flow."

Keep this template handy — every example below follows it, and you can swap in your own conditions.

Step 2: Generate the three-step PCR cycle

Start with the core figure most people need: a single PCR cycle with all three steps. Paste this into the PCR Diagram Generator:

"Draw one cycle of PCR as a left-to-right flow with three labeled steps: denaturation at 95°C (double-stranded DNA separating into single strands), annealing at 55°C (forward and reverse primers binding to the template), and extension at 72°C (Taq polymerase synthesizing new strands from dNTPs). Label both template strands, the primers, Taq polymerase, and the temperature of each step. Use a clean flat-vector style."

This produces the labeled cycle above — the workhorse figure for any methods section. From here you can branch into a full multi-cycle exponential view or zoom into a single step.

Show exponential amplification across cycles

Once one cycle is right, illustrate why PCR is so powerful:

"Show PCR exponential amplification across cycles: how one copy of double-stranded DNA doubles each cycle (1 → 2 → 4 → 8 ...), drawn as a branching diagram over three to four cycles, with a 'target amplicon' produced. Label the cycle number under each step."

Step 3: Add temperatures, primers, and enzyme labels

Temperatures and the right molecular players are what make a PCR diagram trustworthy. If the AI leaves any out, add them as a targeted edit instead of regenerating:

  • "Add the temperature to each step: 95°C for denaturation, 55°C for annealing, 72°C for extension."
  • "Label the forward primer and reverse primer, and show 5′ and 3′ ends on each strand."
  • "Label Taq polymerase at the extension step and add 'dNTPs' as the building blocks."

Because the editor changes the existing image in place, every other element stays exactly where it was. For more on precise wording, see how to edit text and labels in an AI figure.

Step 4: Build a qPCR amplification curve

Many papers need a qPCR (real-time PCR) figure alongside the cycle schematic. Generate it the same way:

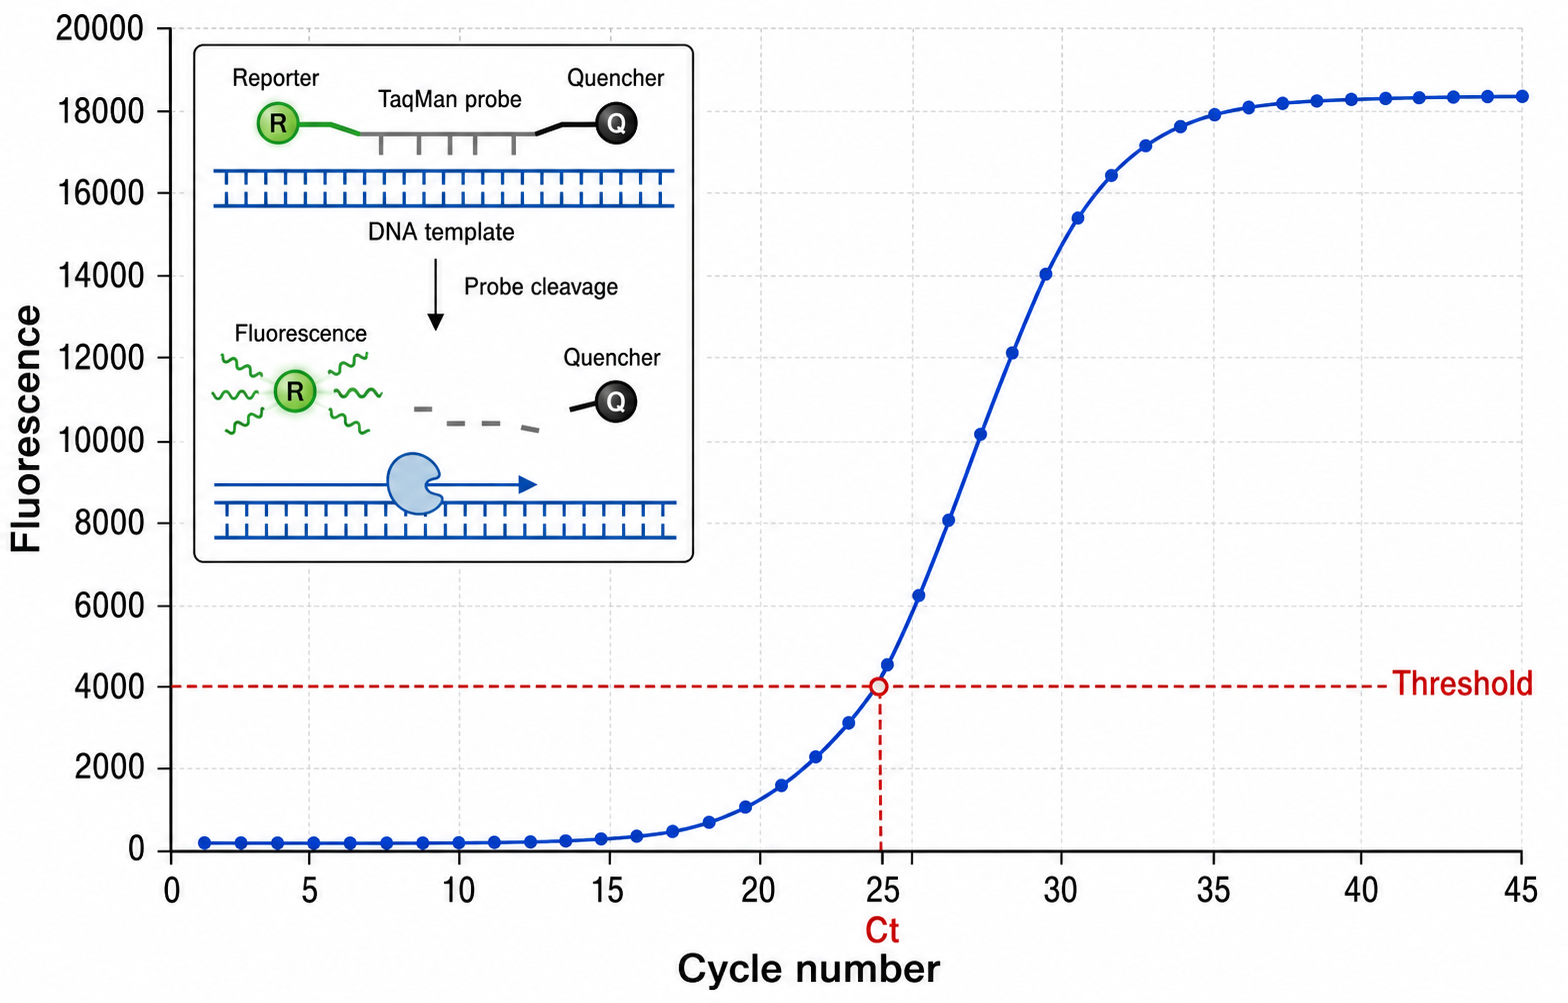
qPCR amplification curve diagram showing fluorescence versus cycle number with a threshold line and Ct value marked

"Draw a qPCR (real-time PCR) amplification plot: fluorescence versus cycle number with a sigmoidal curve, a threshold line, and the Ct value marked. Add a small inset showing a TaqMan probe being cleaved to emit fluorescence. Label the axes, threshold, and Ct."

This gives you a clean amplification curve you can place next to the cycle diagram to tell the full story — how the reaction works and how you measure it. To pair the two as a single figure, ask the editor to "combine the PCR cycle and the qPCR curve into a two-panel figure labeled A and B."

Other PCR variants worth a panel

  • RT-PCR: "Show reverse transcription PCR: RNA being converted to cDNA by reverse transcriptase, then amplified by PCR, as a labeled flow."
  • Primer design: "Illustrate primer binding specificity — a forward and reverse primer flanking a target region, with 5′ and 3′ orientation labeled."
  • Full workflow: "Draw a PCR workflow from sample prep to thermocycler to gel analysis, as a labeled left-to-right pipeline."

Common mistakes (and how to fix them)

  • Steps out of order or merged. Fix: name the steps explicitly in sequence ("denaturation, then annealing, then extension") and request a "left-to-right flow."
  • Missing or wrong temperatures. Fix: state each temperature in the prompt, or re-prompt with "add 95°C, 55°C, and 72°C to the three steps."
  • Primers not labeled. Fix: ask the AI to "label the forward primer and reverse primer" — it labels what you name.
  • Garbled text (typical of generic image AI). Fix: SciDraw AI renders clean sans-serif labels; re-prompt the exact wording if a label looks off.
  • Overcrowded multi-cycle view. Fix: ask to "simplify to three cycles" or split the cycle and the amplification curve into separate panels.

Export and use your PCR figure

Once the diagram reads exactly right, export it to editable SVG or PowerPoint (PPTX), or download a high-resolution image for your manuscript, slides, or poster. SVG and PPTX let collaborators tweak a label or temperature later, while the AI editor handles the fast fixes now.

Want more ready-made wording to drop in? See our PCR diagram prompts collection for copy-paste prompts covering qPCR, RT-PCR, primer design, and full workflows. Need to fix a label or translate it? See how to edit text and labels in an AI figure.

Frequently asked questions

How do I make a PCR diagram with AI? Open the PCR Diagram Generator, describe one cycle with its three steps (denaturation, annealing, extension), name the elements you want labeled, and generate. Then refine the result in the SciDraw AI editor by adding temperatures or relabeling primers.

What temperatures should a PCR diagram show? A standard PCR diagram shows denaturation around 95°C, annealing around 50–60°C (commonly 55°C), and extension around 72°C. State your exact conditions in the prompt so the figure matches your protocol.

Can I add a qPCR amplification curve to my PCR figure? Yes. Generate a qPCR plot — fluorescence versus cycle number with a threshold line and Ct value — then ask the editor to combine it with your cycle diagram into a two-panel figure.

Can I make a PCR diagram for free? Yes — you can start generating PCR diagrams for free, then upgrade for more credits and editable SVG/PPTX export.

Is this a good way to make a publication-ready PCR figure? It's designed for publication-ready output with clean, editable labels, but always review the biology and temperatures for your specific protocol and correct any labels before submitting.

Start creating

Open the PCR Diagram Generator, paste the cycle prompt above, and refine it in the SciDraw AI editor until it matches your protocol. From a single labeled cycle to a full qPCR figure, your next PCR diagram is one sentence away.

All Posts

Author

avatar for Davie Chen / SciDraw AI
Davie Chen / SciDraw AI

Researcher

Davie Chen is a researcher at the Faculty of Animation and Intermedia, University of Arts in Poznan, studying generative AI for scientific figure creation, patent illustration, and manuscript drafting. SciDraw AI is one of the research-to-product tools built from this work.

Author profile

Categories

Step 1: Describe the PCR cycle clearlyStep 2: Generate the three-step PCR cycleShow exponential amplification across cyclesStep 3: Add temperatures, primers, and enzyme labelsStep 4: Build a qPCR amplification curveOther PCR variants worth a panelCommon mistakes (and how to fix them)Export and use your PCR figureFrequently asked questionsStart creating

More Posts

Create your scientific figures with AI

Thousands of researchers use SciDraw AI to make publication-ready figures for papers, grants, and journal submissions — in minutes, with no design skills.

Start for free
Tutorials
How to Draw a Free Body Diagram: Forces, Examples, and Checklist
Tutorials

How to Draw a Free Body Diagram: Forces, Examples, and Checklist

Draw a free body diagram step by step. Learn which forces to include, avoid common FBD mistakes, and use examples for blocks, ramps, and projectiles.

avatar for Davie Chen / SciDraw AI
Davie Chen / SciDraw AI
2026/07/18
How to Label a Brain Diagram: Lobes, Structures, and Functions
Tutorials

How to Label a Brain Diagram: Lobes, Structures, and Functions

Label a brain diagram step by step. Learn the four lobes, the brainstem and cerebellum, key internal structures, common mistakes, and how to make your own.

avatar for Davie Chen / SciDraw AI
Davie Chen / SciDraw AI
2026/07/18
How to Label an Animal Cell Diagram: Parts, Functions, and Examples
Tutorials

How to Label an Animal Cell Diagram: Parts, Functions, and Examples

Label an animal cell diagram step by step. Learn every organelle, avoid common mistakes, compare plant and animal cells, and make a blank worksheet.

avatar for Davie Chen / SciDraw AI
Davie Chen / SciDraw AI
2026/07/18
Explore Our Tools
PCR Diagram Generator·Scientific Diagram Maker·Scientific Figure Maker·Graphical Abstract Maker