Lucidchart ist ein solides Diagrammwerkzeug — für Forschende sind jedoch die Preisgestaltung, die fehlenden wissenschaftlichen Formbibliotheken und der browsergebundene Workflow oft ein Problem. Ob experimentelle Pipelines, Laborgeräteschemata oder konzeptionelle Rahmendiagramme für eine Publikation: Es gibt besser geeignete Alternativen, viele davon kostenlos.
Was Sie in diesem Leitfaden erfahren:
- Welche Lucidchart-Alternativen sich für wissenschaftliche Workflow-Diagramme und Forschungsschemata am besten eignen
- Ein ehrlicher Vergleich zu Preis, Offline-Unterstützung, Zusammenarbeit und wissenschaftsspezifischen Funktionen
- Vor- und Nachteile sowie optimale Einsatzszenarien für 7 Tools
- Wann KI-gestützte Generierung (SciDraw AI) manuelles Diagrammzeichnen übertrifft
Warum Forschende nach Lucidchart-Alternativen suchen
Lucidchart ist ein gutes Allzweck-Diagrammwerkzeug, aber Wissenschaftlerinnen und Wissenschaftler stoßen auf typische Schwächen:
- Kosten: Der kostenlose Tarif ist stark eingeschränkt (3 bearbeitbare Dokumente, 60 Formen pro Diagramm). Team-Pläne kosten 9–10 € pro Nutzer/Monat.
- Kein Offline-Modus: Alles läuft im Browser; bei Verbindungsabbruch verliert man Zeit und Fortschritt.
- Generische Formbibliotheken: Lucidchart bietet Formen für Business-Flowcharts und Netzwerkdiagramme, nicht für Biologie, Chemie, Schaltkreisdesign oder wissenschaftliche Workflows.
- Eingeschränkter Export: SVG- und PDF-Export erfordern oft einen bezahlten Plan.
Für Doktorandinnen, Postdocs oder Forschungsgruppen mit knappem Budget summieren sich diese Einschränkungen schnell. Nachfolgend sieben empfehlenswerte Alternativen.
Vergleichstabelle: Lucidchart-Alternativen für Forschende
| Tool | Kostenlose Version | Offline | Echtzeit-Kollaboration | Wissenschaftliche Formen | KI-Generierung | Optimal für |
|---|---|---|---|---|---|---|
| draw.io (diagrams.net) | Unbegrenzt, vollständig kostenlos | Ja | Eingeschränkt | Gut | Nein | Lab-Workflows, Netzwerk-/Systemdiagramme |
| Mermaid | Kostenlos (Open Source) | Ja (lokal) | Nein | Keine (textbasiert) | Nein | Versionierbare, codebasierte Diagramme |
| Excalidraw | Kostenlos | Ja (PWA) | Ja | Keine | Nein | Whiteboard-artige Konzeptskizzen |
| Miro | Kostenlos (3 Boards) | Nein | Exzellent | Keine | Eingeschränkt | Brainstorming, interdisziplinäre Teams |
| Creately | Kostenlos (5 Diagramme) | Nein | Ja | Moderat | Nein | Strukturierte Forschungs-Flowcharts |
| Whimsical | Kostenlos (begrenzt) | Nein | Ja | Keine | Nein | Klare, minimalistische Flowcharts |
| SciDraw AI | Kreditbasiert | Nein | Nein | Wissenschaftsnativ | Ja (Text-zu-Diagramm) | KI-Abbildungen, wissenschaftliche Workflows, Schemata |
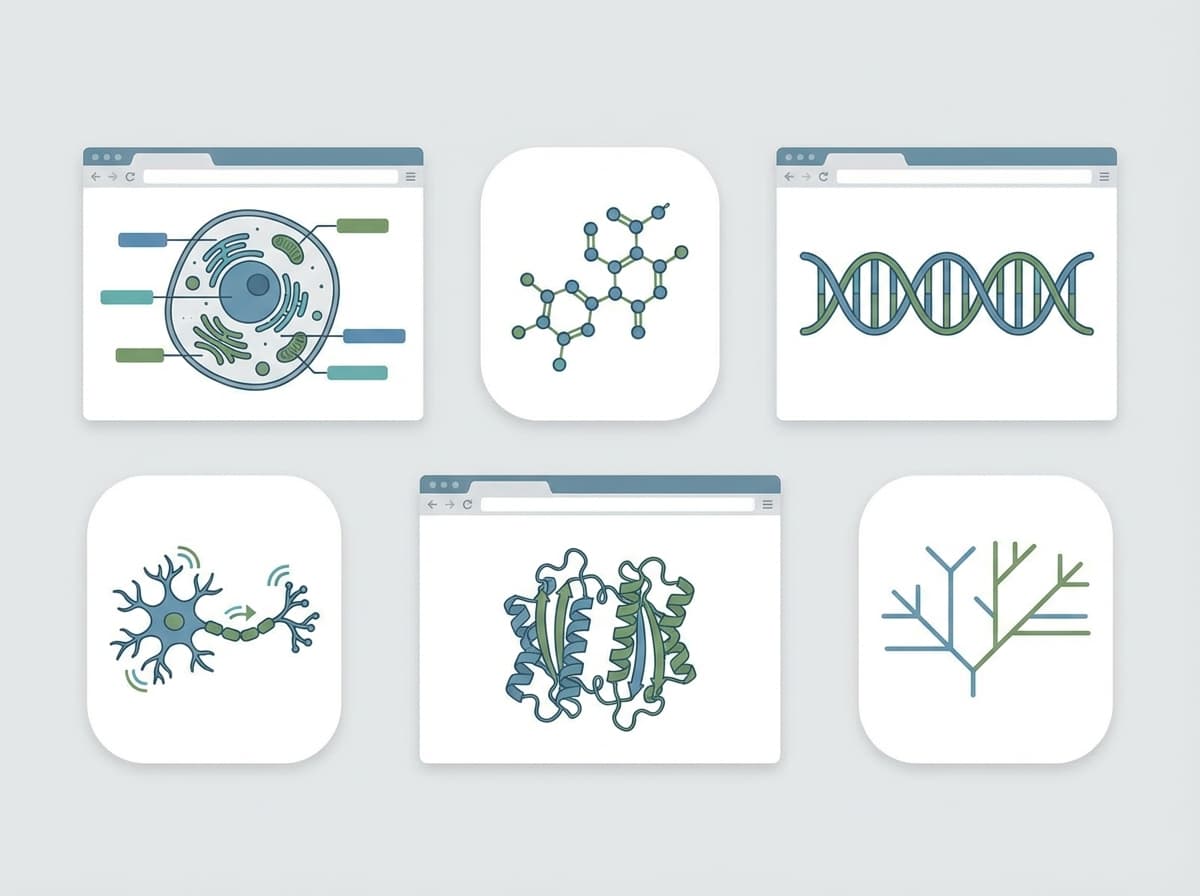
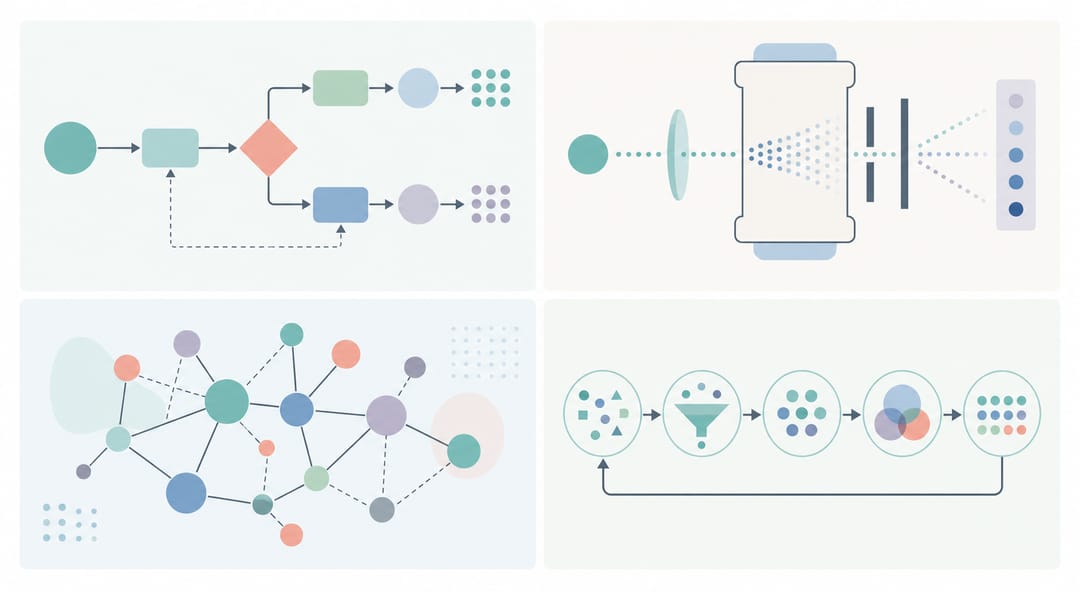 Forschungsdiagramme reichen von Workflows über Laborschemata bis zu Konzeptmodellen – jedes Tool passt unterschiedlich gut.
1. draw.io (diagrams.net)
Kostenlos. Open Source. Offline-fähig.
draw.io ist die stärkste kostenlose Lucidchart-Alternative für Forschende, die vollständige Kontrolle über ihre Diagramme benötigen. Es läuft im Browser, als Desktop-App (Electron-basiert) oder als VS-Code-Erweiterung — sämtliche Funktionen sind ohne Bezahlung verfügbar.
Vorteile:
- Wirklich unbegrenzt und dauerhaft kostenlos
- Desktop-App funktioniert offline
- Umfangreiche Formbibliotheken: Elektrik, Netzwerk, UML und wissenschaftliche Grundformen
- Export in SVG, PNG, PDF, VSDX und XML ohne Paywall
- Integration mit Google Drive, Confluence, Jira und GitHub
Nachteile:
- UI wirkt im Vergleich zu Lucidchart veraltet
- Echtzeit-Kollaboration eingeschränkt (keine Live-Cursor)
- Keine eingebaute KI-Generierung
- Wissenschaftliche Spezialformen (Biologie, Chemie, Schaltkreise) erfordern manuellen Import
Optimal für: Laborprotokoll-Diagramme, experimentelle Workflow-Schemata, Geräteverdrahtungspläne und alle Forschenden, die Offline-Zuverlässigkeit benötigen. Wer ein detailliertes Schemadiagramm manuell erstellen möchte, profitiert von draw.ios XML-basiertem Format, das vollständige Reproduzierbarkeit gewährleistet.
2. Mermaid
Kostenlos. Textbasiert. Versionskontrollfreundlich.
Mermaid ist keine visuelle Diagramm-App — es ist eine Markdown-inspirierte Syntax, die Diagramme aus Plaintext rendert. Man schreibt graph TD; A-->B; B-->C; und erhält ein Flussdiagramm. Das macht es zur natürlichen Wahl für Forschende, die in Code-Notebooks, Dokumentationen oder GitHub-Repositories arbeiten.
Vorteile:
- Native Integration in GitHub Markdown, Notion, Obsidian, GitLab und VS Code
- Vollständig versionierbar (das Diagramm ist reiner Text)
- Komplett kostenlos und Open Source
- Flowcharts, Sequenzdiagramme, Gantt-Charts, ERDs werden unterstützt
Nachteile:
- Keine grafische Oberfläche — Syntaxkenntnis erforderlich
- Nicht geeignet für Abbildungen mit Icons, Bildern oder benutzerdefinierten Formen
- Layout wird automatisch generiert; manuelle Positionierung ist nicht möglich
- Hohe Einstiegshürde für Nicht-Programmierer
Optimal für: Forschende, die ihre Methoden in GitHub-Repos oder Jupyter-Notebooks dokumentieren und reproduzierbare, automatisch gerenderte Diagramme in READMEs oder Labor-Wikis benötigen.
3. Excalidraw
Kostenlos. Handgezeichnete Ästhetik. Kollaborativ.
Excalidraw erzeugt Diagramme mit einem skizzenhaften, handgezeichneten Look, den viele Forschende zugänglicher finden als formale Flowcharts. Es ist ein browser-first-Tool (auch als PWA installierbar) mit eingebautem Echtzeit-Kollaborationsfeature.
Vorteile:
- Vollständig kostenlos ohne Account-Pflicht
- Echtzeit-Kollaboration über teilbare Links
- Offline-fähig (PWA)
- Übersichtliche, ablenkungsfreie Oberfläche
- Unterstützt Grundformen, Pfeile, Text und Bildeinbettung
Nachteile:
- Handgezeichneter Stil passt möglicherweise nicht zu formalen Publikationen
- Keine wissenschaftlichen Formbibliotheken
- Begrenzte Exportoptionen (PNG, SVG, JSON)
- Nicht ideal für große, komplexe Diagramme
Optimal für: Schnelle Konzeptskizzen, whiteboard-artige Konzeptrahmen-Diagramme und Brainstorming-Sitzungen, bei denen visuelle Präzision weniger wichtig ist als Geschwindigkeit.
4. Miro
Kostenloser Plan: 3 Boards. Bezahlt ab 8 €/Nutzer/Monat.
Miro ist eine kollaborative Whiteboard-Plattform für Teams. Die Arbeitsfläche ist praktisch unbegrenzt und unterstützt viele Diagrammtypen, Haftnotizen, Abstimmungs-Widgets und Integrationen mit Tools wie Slack und Jira.
Vorteile:
- Beste Echtzeit-Kollaboration (Live-Cursor, Kommentare, Abstimmungen)
- Hervorragend für große interdisziplinäre Teams
- Gute Vorlagenbibliothek mit Prozessdiagrammen und Affinity-Diagrammen
- Integration mit Hunderten von Tools
Nachteile:
- Der kostenlose Plan begrenzt auf 3 Boards (dauerhaft nicht mehr bearbeitbar nach Überschreitung)
- Kein Offline-Modus
- Kein wissenschaftsspezifischer Ansatz — keine Spezialformen
- Für einfache Diagramme oft überladen
Optimal für: Forschungsteams, die funktionsübergreifende Projekte koordinieren, Förderantrags-Brainstorming-Sitzungen und Workshops, bei denen mehrere Personen in Echtzeit gemeinsam diagrammieren.
5. Creately
Kostenloser Plan: 5 Diagramme. Bezahlt ab 8 €/Nutzer/Monat.
Creately liegt in seinem Funktionsumfang näher an Lucidchart — strukturiertes Diagrammtool mit Vorlagen, Echtzeit-Kollaboration und einem übersichtlichen visuellen Editor. Es unterstützt Flowcharts, Organigramme, Mind Maps und BPMN-Diagramme.
Vorteile:
- Moderne, aufgeräumte Oberfläche
- Gute Vorlagenbibliothek für Prozess- und Workflow-Diagramme
- Echtzeit-Kollaboration mit Kommentaren
- Integration mit Google Drive und Microsoft Teams
Nachteile:
- Kostenlose Version auf 5 Diagramme begrenzt
- Keine wissenschaftlichen Spezialformen
- Export erfordert bezahlten Plan
- Erweiterte Kollaborationsfunktionen hinter höheren Tarifen
Optimal für: Forschungsgruppen, die eine strukturierte Lucidchart-ähnliche Erfahrung zu günstigeren Preisen suchen und keine wissenschaftlichen Spezialformen benötigen.
6. Whimsical
Kostenlos: begrenzte Objekte. Bezahlt ab 10 €/Nutzer/Monat.
Whimsical ist ein minimalistisches, meinungsstarkes Diagrammtool, das eine Sache gut macht: saubere, lesbare Flowcharts und Wireframes. Die schnelle, tastaturgesteuerte Oberfläche erzeugt visuell konsistente Ergebnisse mit minimalem Designaufwand.
Vorteile:
- Außergewöhnlich saubere Ausgabe — wirkt professionell ohne Aufwand
- Schneller, tastaturgesteuerter Workflow
- Echtzeit-Kollaboration
- Mind Maps, Flowcharts, Wireframes und Haftnotizen
Nachteile:
- Sehr eingeschränkter kostenloser Plan
- Keine wissenschaftlichen Formen oder Biologie-/Chemie-Bibliotheken
- Weniger flexibel als draw.io bei komplexen Diagrammen
- Export nur in bezahlten Plänen
Optimal für: Forschende, die schnell publikationsreife Flowcharts erstellen möchten, insbesondere für Methodenabschnitte oder Förderantrag-Diagramme, bei denen visuelle Klarheit entscheidend ist.
7. SciDraw AI
KI-gestützte Generierung. Kreditbasierte Preisgestaltung.
SciDraw AI verfolgt einen grundlegend anderen Ansatz: Statt Diagramme durch manuelles Platzieren von Formen zu erstellen, beschreibt man in natürlicher Sprache, was benötigt wird, und die KI generiert die Abbildung. Das ist besonders leistungsfähig für Forschende, die wissen, was sie kommunizieren möchten, aber keine Stunden in einem Diagrammeditor verbringen wollen.
Vorteile:
- Erzeugt wissenschaftliche Diagramme direkt aus Textbeschreibungen
- Wissenschaftsnative Ausgabe — versteht biologische Signalwege, experimentelle Workflows, Laborschemata
- Keine Designkenntnisse erforderlich
- Schnelle Iteration: Änderung beschreiben, in Sekunden neue Abbildung erhalten
- Unterstützt viele Diagrammtypen: Workflows, Schemata, konzeptionelle Rahmen
Nachteile:
- Weniger präzise manuelle Kontrolle als draw.io für pixelgenaue Positionierung
- Erfordert Credits (nicht vollständig kostenlos)
- Keine Echtzeit-Kollaborationsfunktionen
Optimal für: Forschende, die schnell publikationsreife wissenschaftliche Abbildungen benötigen — experimentelle Workflow-Diagramme, Forschungs-Workflow-Diagramme, Schemadiagramme für Publikationen und konzeptionelle Rahmenabbildungen.
SciDraw AI ist die stärkste Wahl, wenn der Engpass die Zeit und nicht das Budget ist — wenn klar ist, was das Diagramm kommunizieren soll, man aber nicht zwei Stunden mit dem Ziehen von Formen in Lucidchart verbringen möchte.
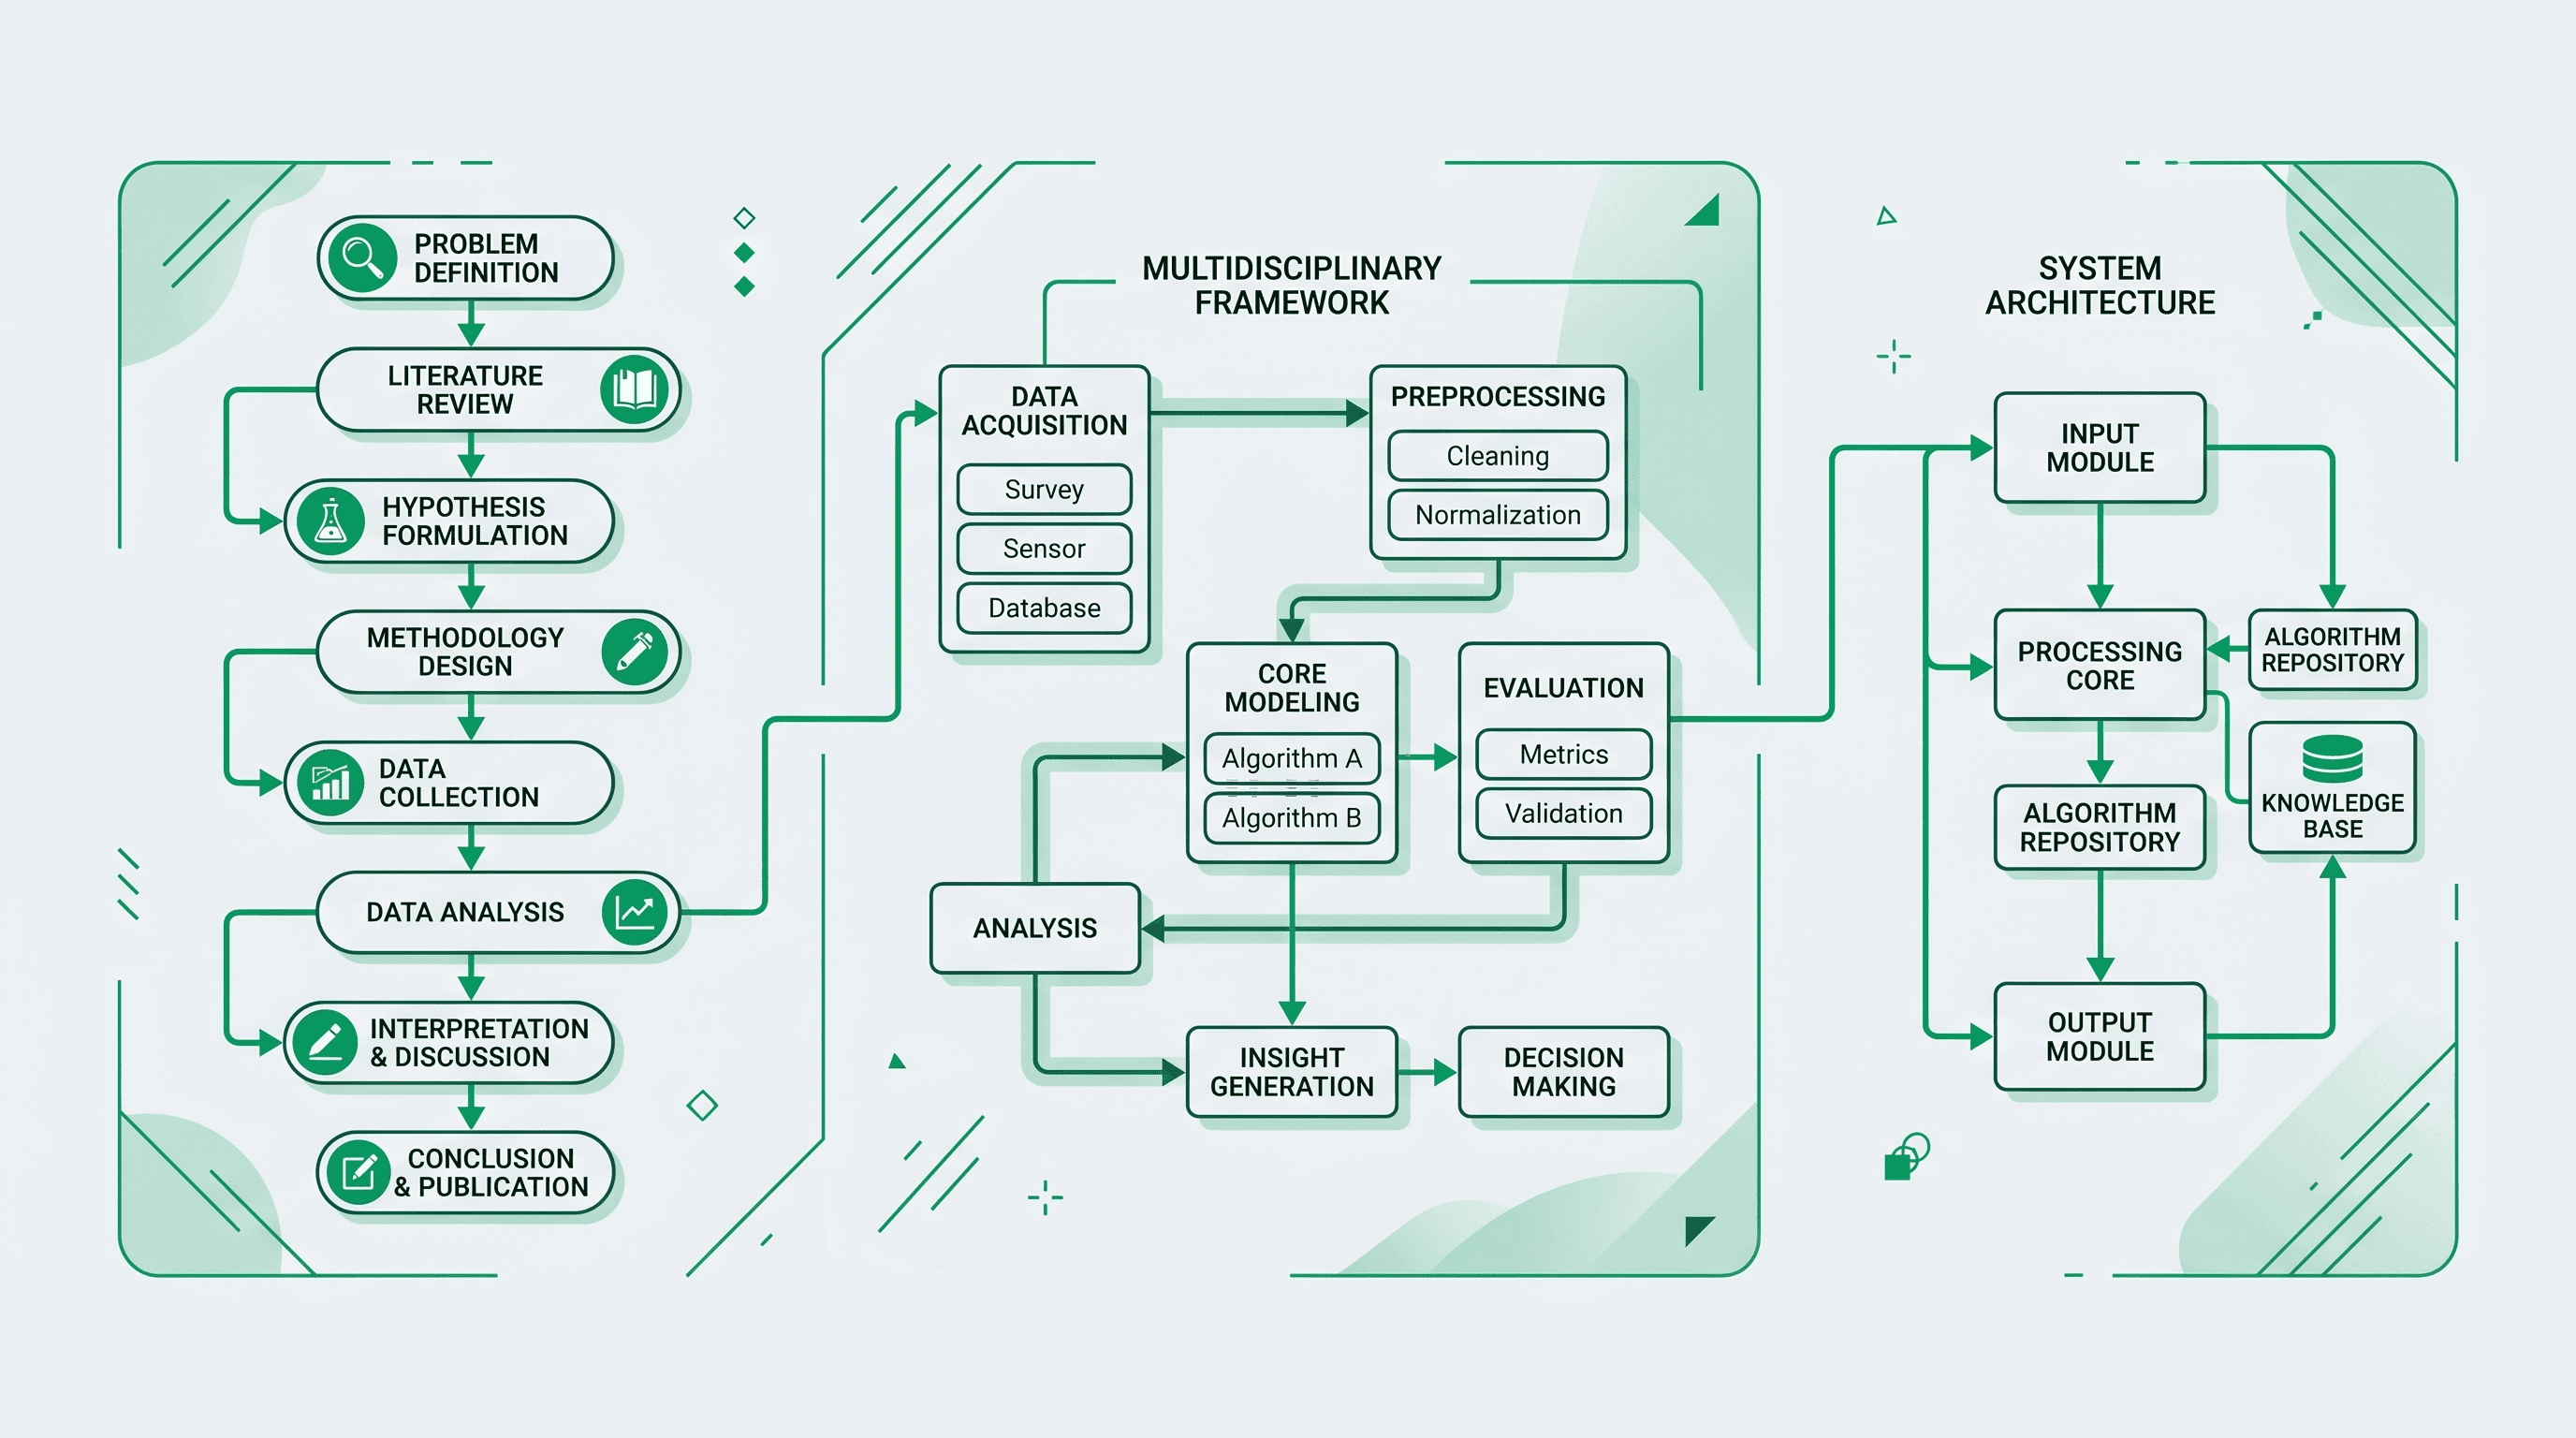
 KI-Generierung verwandelt eine Beschreibung in Alltagssprache in Sekunden in ein wissenschaftsgerechtes Diagramm.
Wie man das richtige Tool auswählt
draw.io wählen, wenn: Ein vollständig kostenloses, offline-fähiges Tool für detaillierte Diagramme benötigt wird. Es ist der engste echte Lucidchart-Ersatz für einzelne Forschende.
Mermaid wählen, wenn: Hauptsächlich in Code-Umgebungen gearbeitet wird (GitHub, Jupyter, VS Code) und versionierbare, reproduzierbare Diagramme aus Text benötigt werden.
Excalidraw wählen, wenn: Schnelles, freiformiges Skizzieren und Kollaborieren mit minimalem Setup gefragt ist — besonders für konzeptionelle Rahmen in frühen Forschungsphasen.
Miro wählen, wenn: Team-Kollaboration auf einem gemeinsamen, nahezu unbegrenzten Canvas Priorität hat und Budget für einen bezahlten Plan vorhanden ist.
Creately oder Whimsical wählen, wenn: Eine übersichtlichere Lucidchart-ähnliche Erfahrung gewünscht wird und keine wissenschaftlichen Spezialformen benötigt werden.
SciDraw AI wählen, wenn: Die KI das Diagramm aus einer Beschreibung generieren soll — ideal für wissenschaftliche Workflows, Schemata und konzeptionelle Abbildungen, bei denen Geschwindigkeit und wissenschaftsnative Ausgabe über manuelle Kontrolle gestellt werden.
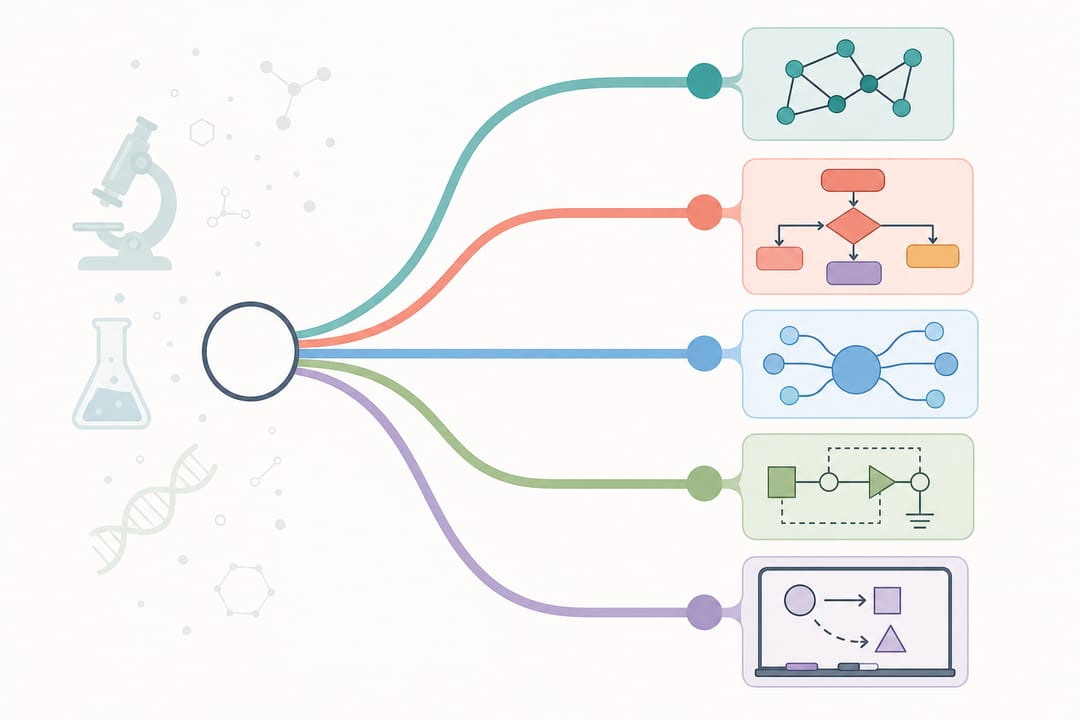 Die richtige Wahl hängt davon ab, ob Ihr Engpass Budget, Zusammenarbeit, Offline-Zugriff oder Tempo ist.
Häufige Fragen
Ist draw.io wirklich kostenlos ohne Einschränkungen? Ja. draw.io (diagrams.net) ist vollständig Open Source und kostenlos — ohne Formbegrenzung, Dokumentenlimit oder Exportbeschränkung. Auch die Desktop-App ist kostenlos und funktioniert offline.
Kann ich mit einem dieser Tools publikationsreife Abbildungen erstellen? draw.io und SciDraw AI sind die stärksten Optionen für publikationsreife Ausgabe. draw.io exportiert saubere SVG- und PDF-Dateien; SciDraw AI generiert wissenschaftsnative Abbildungen, die für Publikationen und Präsentationen konzipiert sind.
Welche Lucidchart-Alternative eignet sich am besten für Laborprotokoll-Diagramme? draw.io ist aufgrund seiner umfangreichen Formbibliothek und Offline-Unterstützung am leistungsfähigsten für detaillierte Laborprotokoll- und experimentelle Workflow-Diagramme. SciDraw AIs Workflow-Diagramm-Generator ist die schnellere Option, wenn die KI das Diagramm aus einer Textbeschreibung erstellen soll.
Funktioniert SciDraw AI auch für Nicht-KI-Forschende (z. B. Biologie, Chemie)? Ja. SciDraw AI ist für wissenschaftliche Disziplinen insgesamt konzipiert — Biologie, Chemie, Physik, Neurowissenschaften, Ingenieurwesen und mehr. Die KI versteht fachspezifische Terminologie und generiert entsprechende Abbildungen.
Kann ich Lucidchart-Diagramme in draw.io importieren?
Ja. draw.io kann Lucidcharts .vsdx-Format importieren, was die Migration bestehender Diagrammbibliotheken unkompliziert macht.
Ist Mermaid für Nicht-Programmierer geeignet? Mermaid hat eine Lernkurve und erfordert das Schreiben von Textsyntax. Für Nicht-Programmierer sind Excalidraw oder SciDraw AI deutlich zugänglicher.