환경 과학 연구는 생태학적 과정, 오염 경로 및 지속 가능성 프레임워크에 대한 명확한 시각화를 필요로 합니다. 이 가이드는 실제 환경 연구에서 검증된 30개의 AI 프롬프트를 소개하며, 학술지, 보고서 및 발표 자료에 바로 사용할 수 있는 수준의 다이어그램을 제작하는 데 도움을 줍니다.
이 가이드에서 다루는 내용:
- 생태학적 과정 및 생지화학적 순환 다이어그램
- 오염원 및 경로 삽화
- 지속 가능한 설계 및 최적화 프레임워크
- 환경 연구를 위한 기술 로드맵
1. 지속 가능한 설계 및 최적화
1.1 패시브 솔라 디자인 (Passive Solar Design)
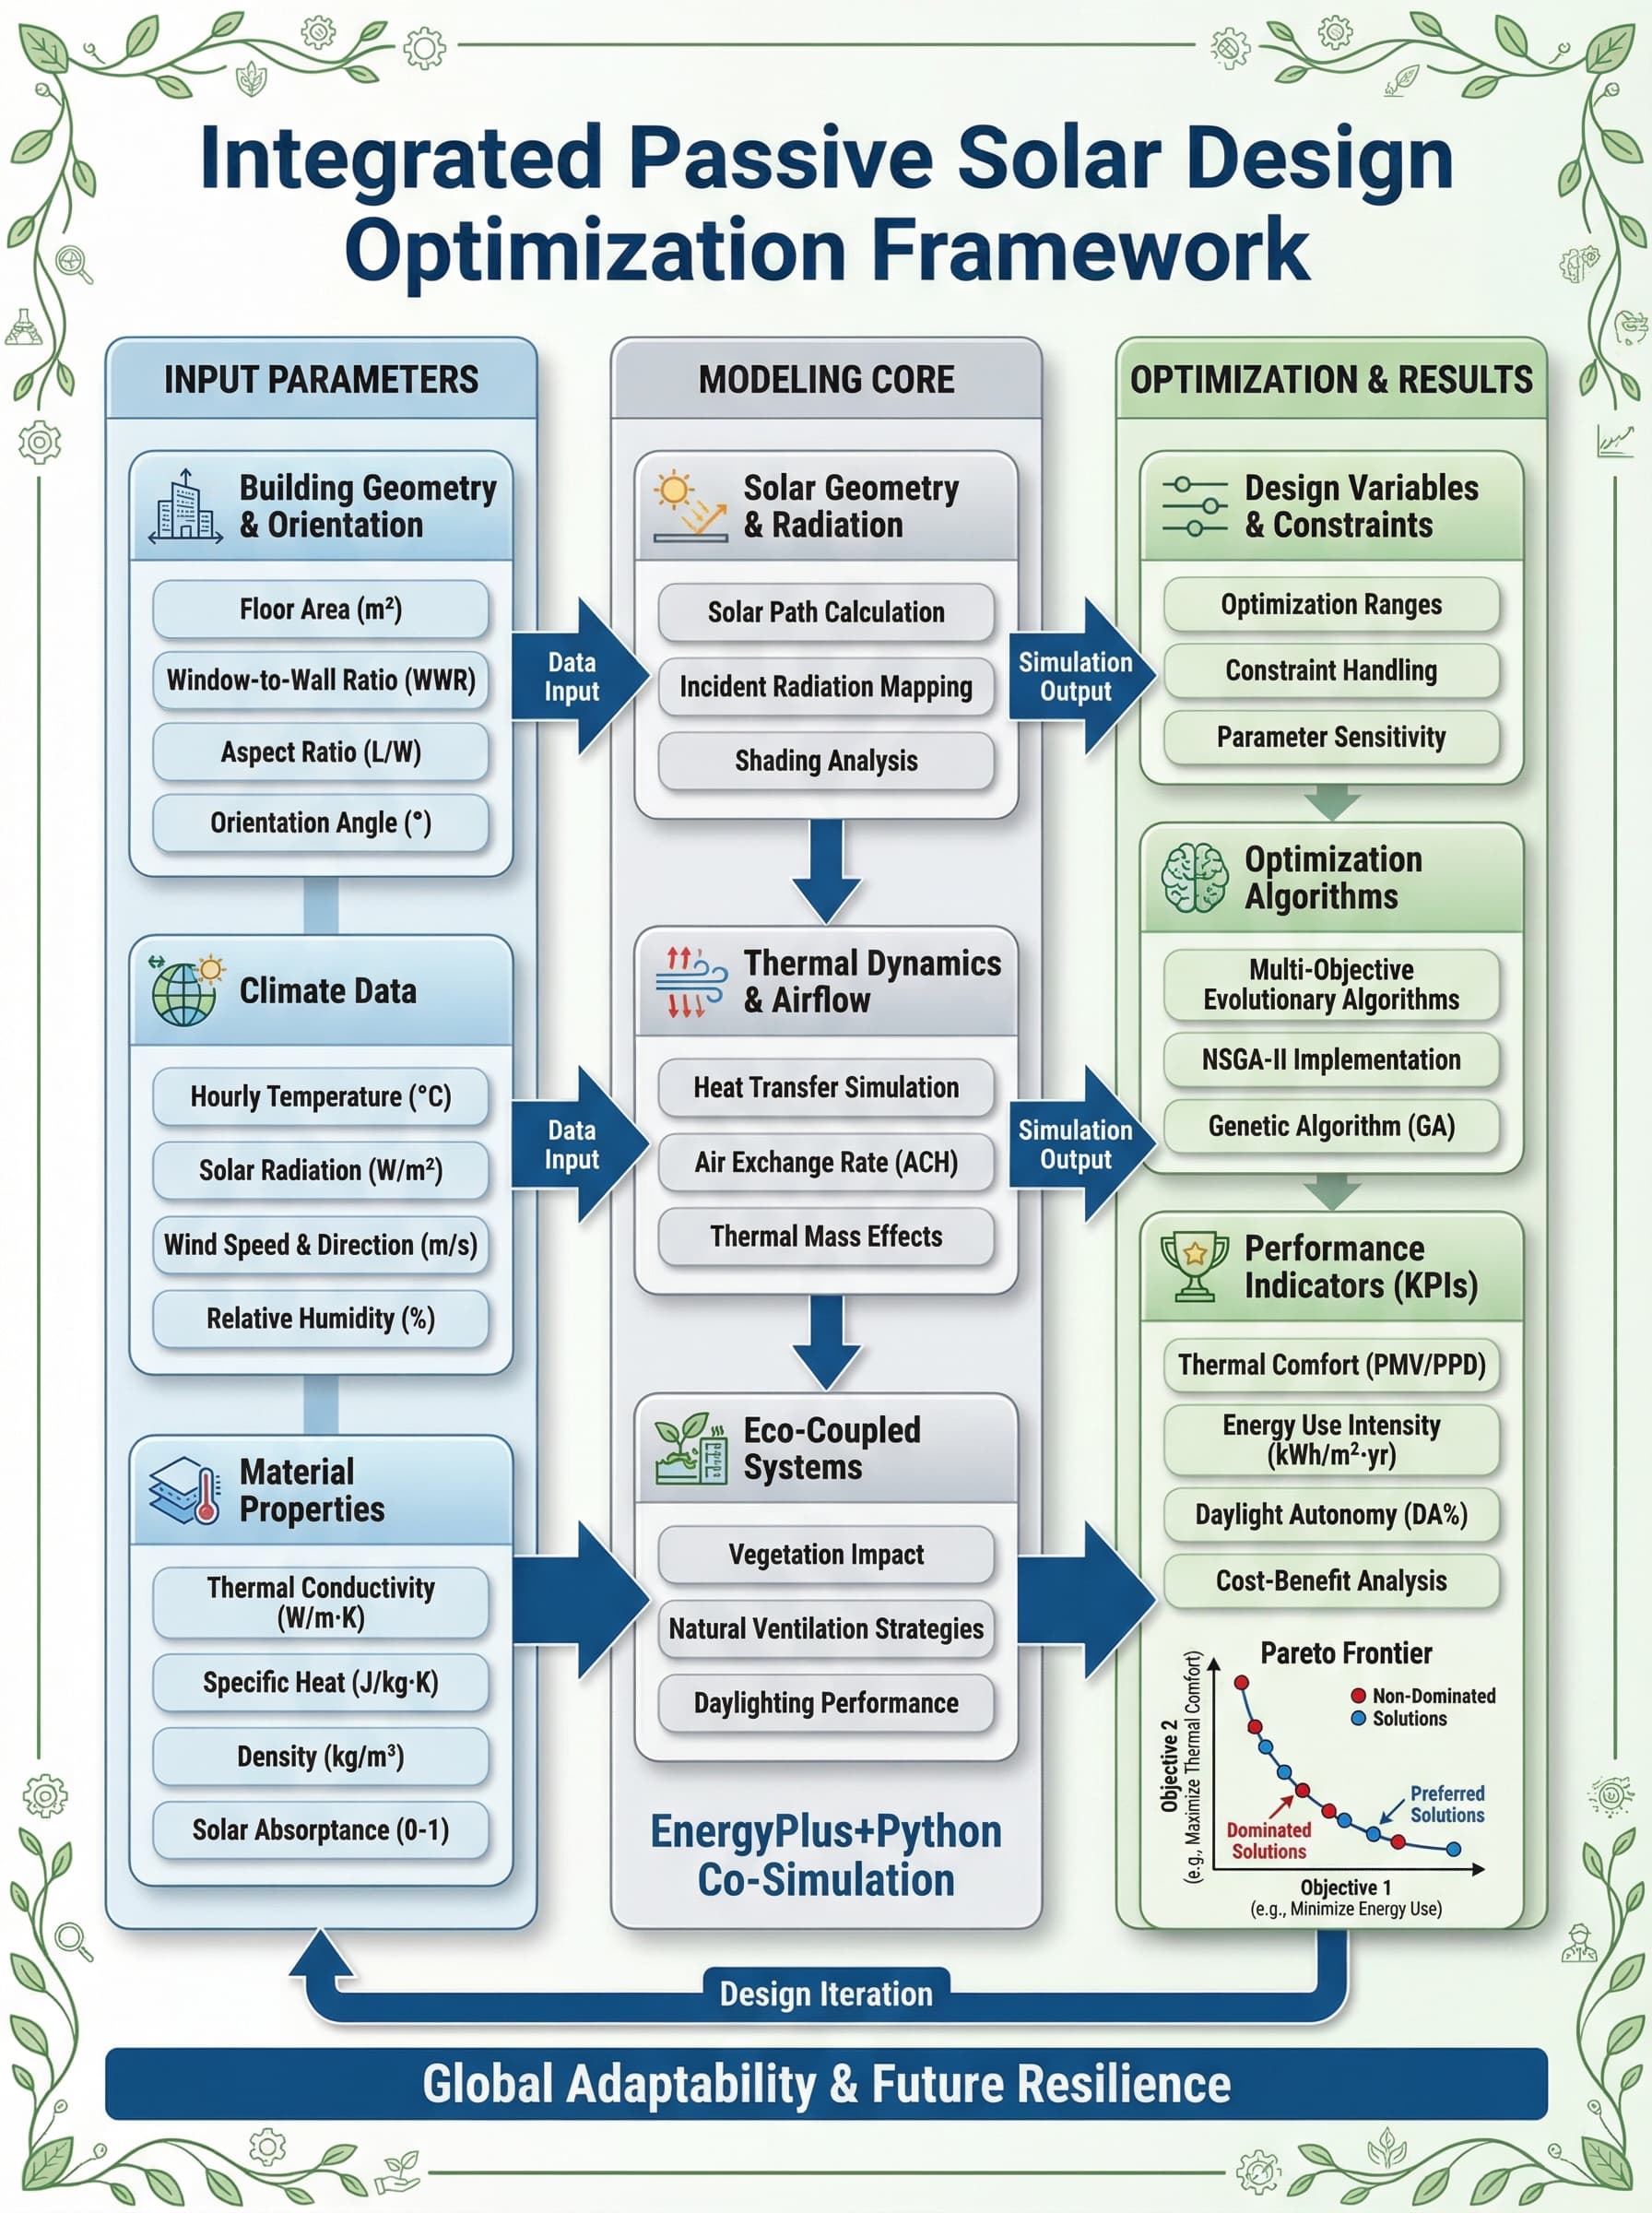
프롬프트: 통합 패시브 솔라 디자인 프레임워크
Generate a landscape-oriented scientific framework diagram in English, titled
"Integrated Passive Solar Design Optimization Framework". Show:
- Building orientation and solar geometry
- Thermal mass placement strategies
- Natural ventilation pathways
- Daylighting optimization zones
- Energy performance indicators
- Integration with active systems
Use a professional scientific diagram style with clear hierarchical structure.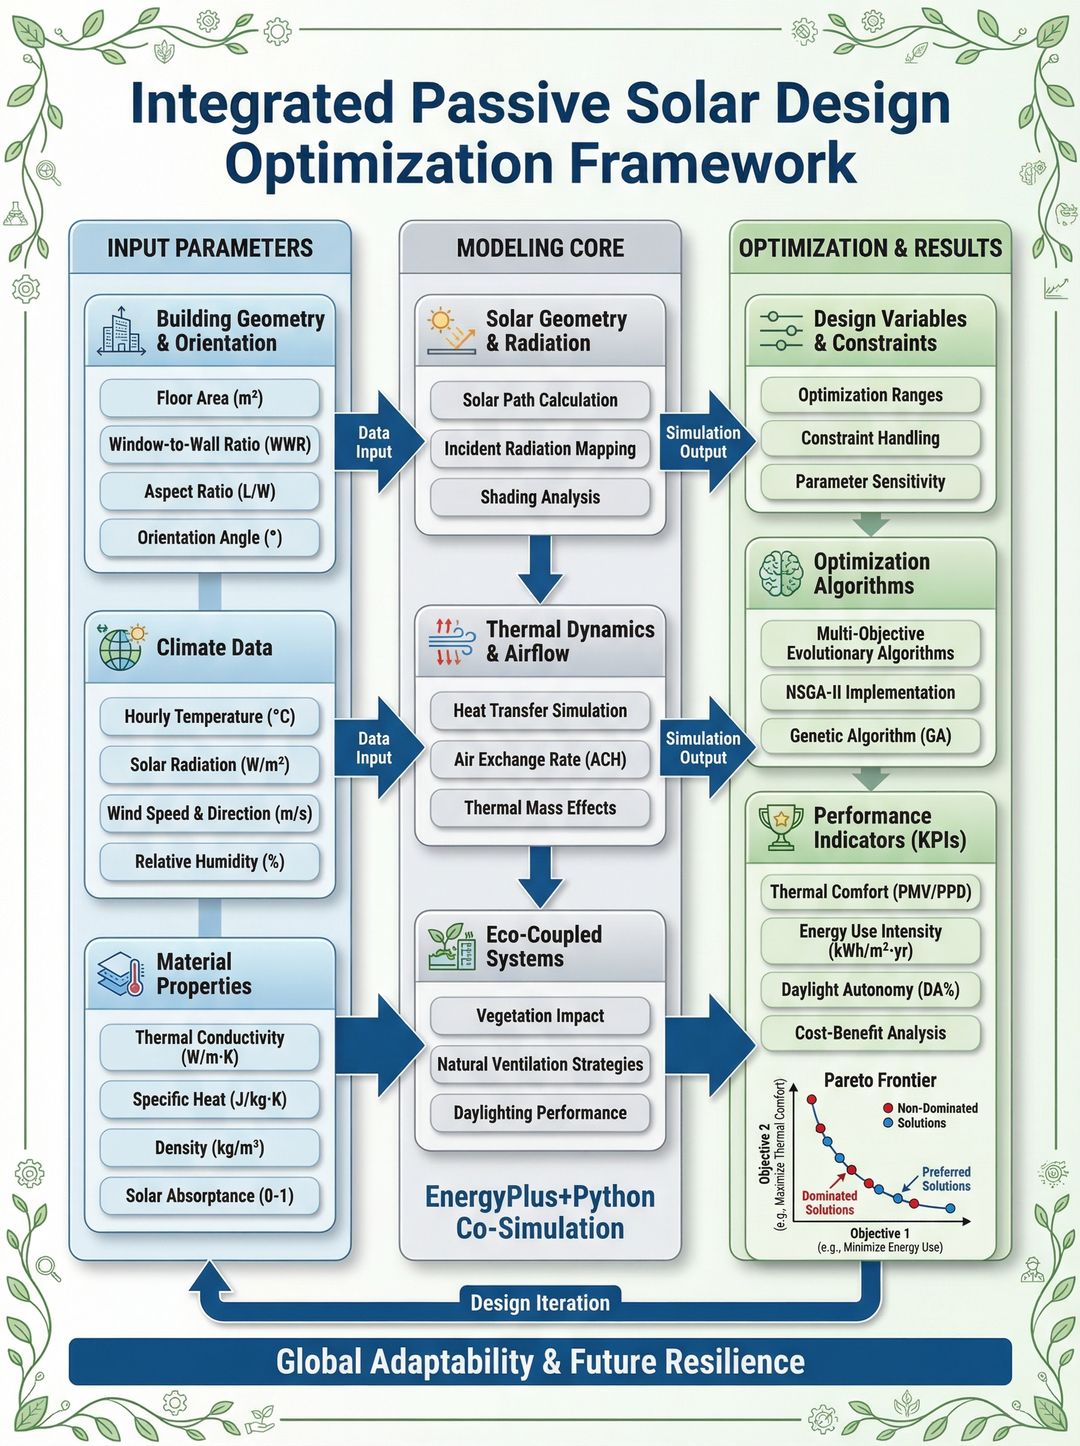
1.2 농업 스트레스 반응
프롬프트: 작물에 미치는 환경 스트레스 영향
Environmental stress and suboptimal planting schedules significantly limit
cauliflower production by disrupting developmental processes. Create a diagram
showing:
- Temperature stress effects on plant physiology
- Water stress indicators and thresholds
- Developmental stage sensitivity windows
- Yield loss pathways
- Mitigation strategies (irrigation, shading)
Include both stress mechanism and management response panels.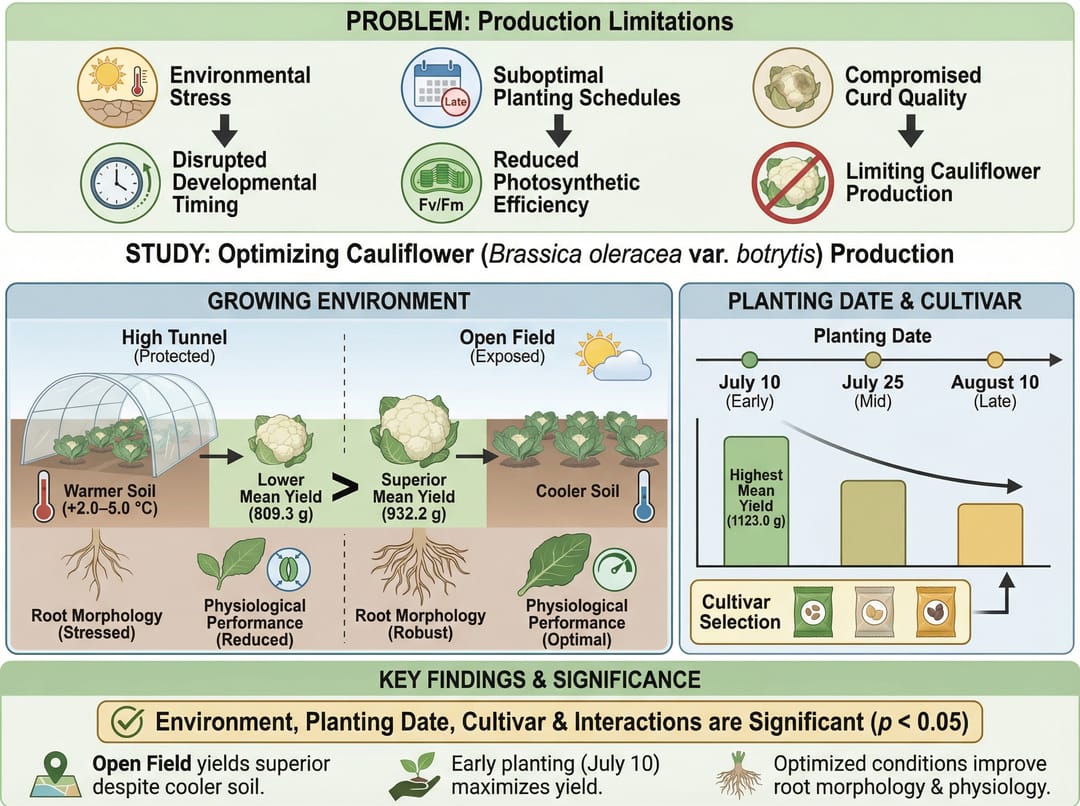
2. 생지화학적 순환
2.1 토양 질소 과정
프롬프트: 농경지 토양 질화 메커니즘
Draw a schematic diagram illustrating the mechanism of the nitrification process
in farmland soil. With ammonia oxidation as the central process, show:
- NH4+ to NO2- conversion (ammonia-oxidizing bacteria)
- NO2- to NO3- conversion (nitrite-oxidizing bacteria)
- Environmental factors affecting rates (pH, temperature, moisture)
- Coupling with denitrification
- N2O emission pathways
Use soil profile cross-section with microbial community visualization.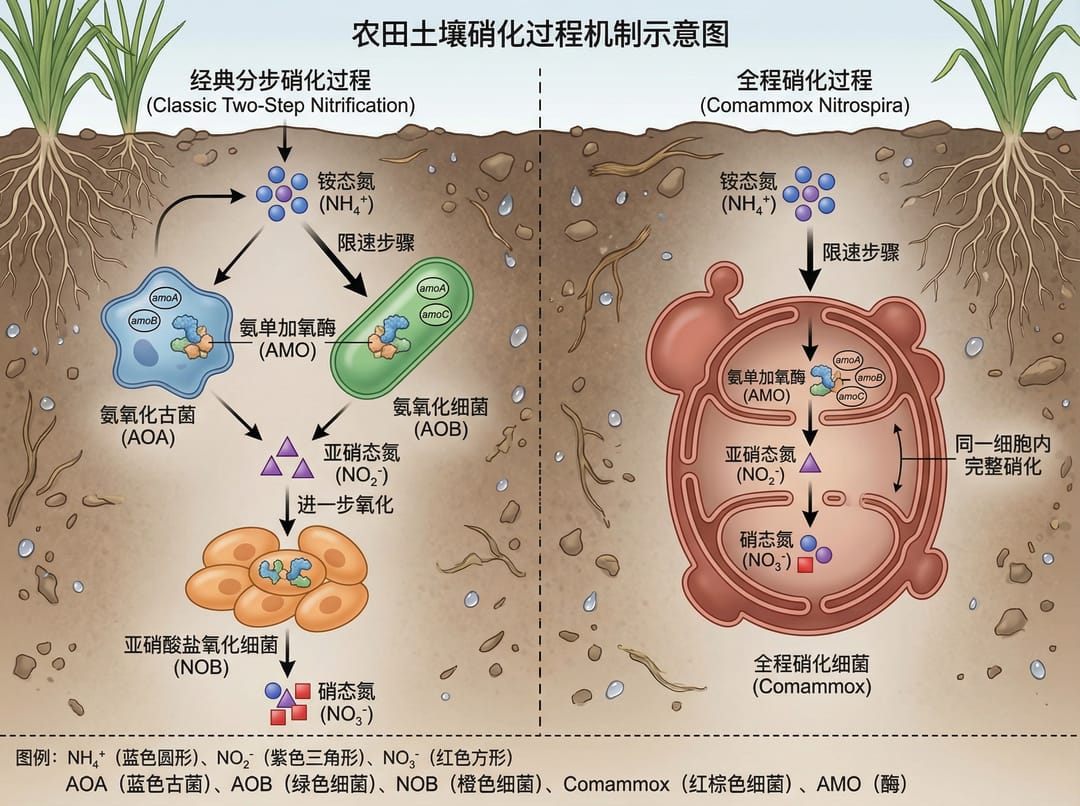
3. 신종 오염 물질 (Emerging Contaminants)
3.1 오염원 및 경로
프롬프트: 신종 오염 물질의 기원
Emerging contaminants originate from diverse sources, with their release closely
linked to human production and lifestyle activities. Create an illustration showing:
- Pharmaceutical sources (hospitals, households, manufacturing)
- Personal care product pathways
- Agricultural chemical inputs
- Industrial discharge points
- Transport through water, soil, and air
- Exposure routes to ecosystems and humans
Use a circular or network diagram style.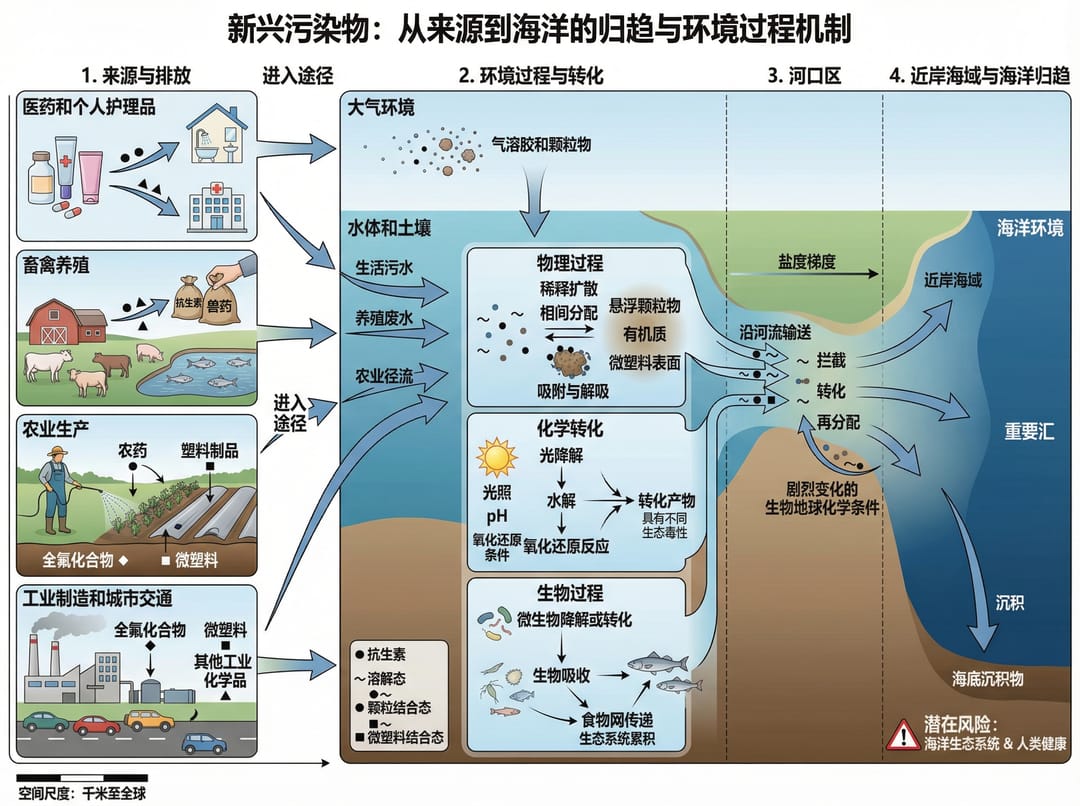
3.2 해양 먹이망 전이
프롬프트: 해양 시스템 내 PPCPs의 영양 단계 전이
Could you help me generate a technical roadmap? I am a graduate student studying
the trophic transfer of PPCPs (pharmaceuticals and personal care products) in
marine food webs. Show:
- Primary producer uptake mechanisms
- Bioaccumulation at each trophic level
- Biomagnification factors
- Metabolic transformation pathways
- Human exposure through seafood consumption
- Research methodology workflow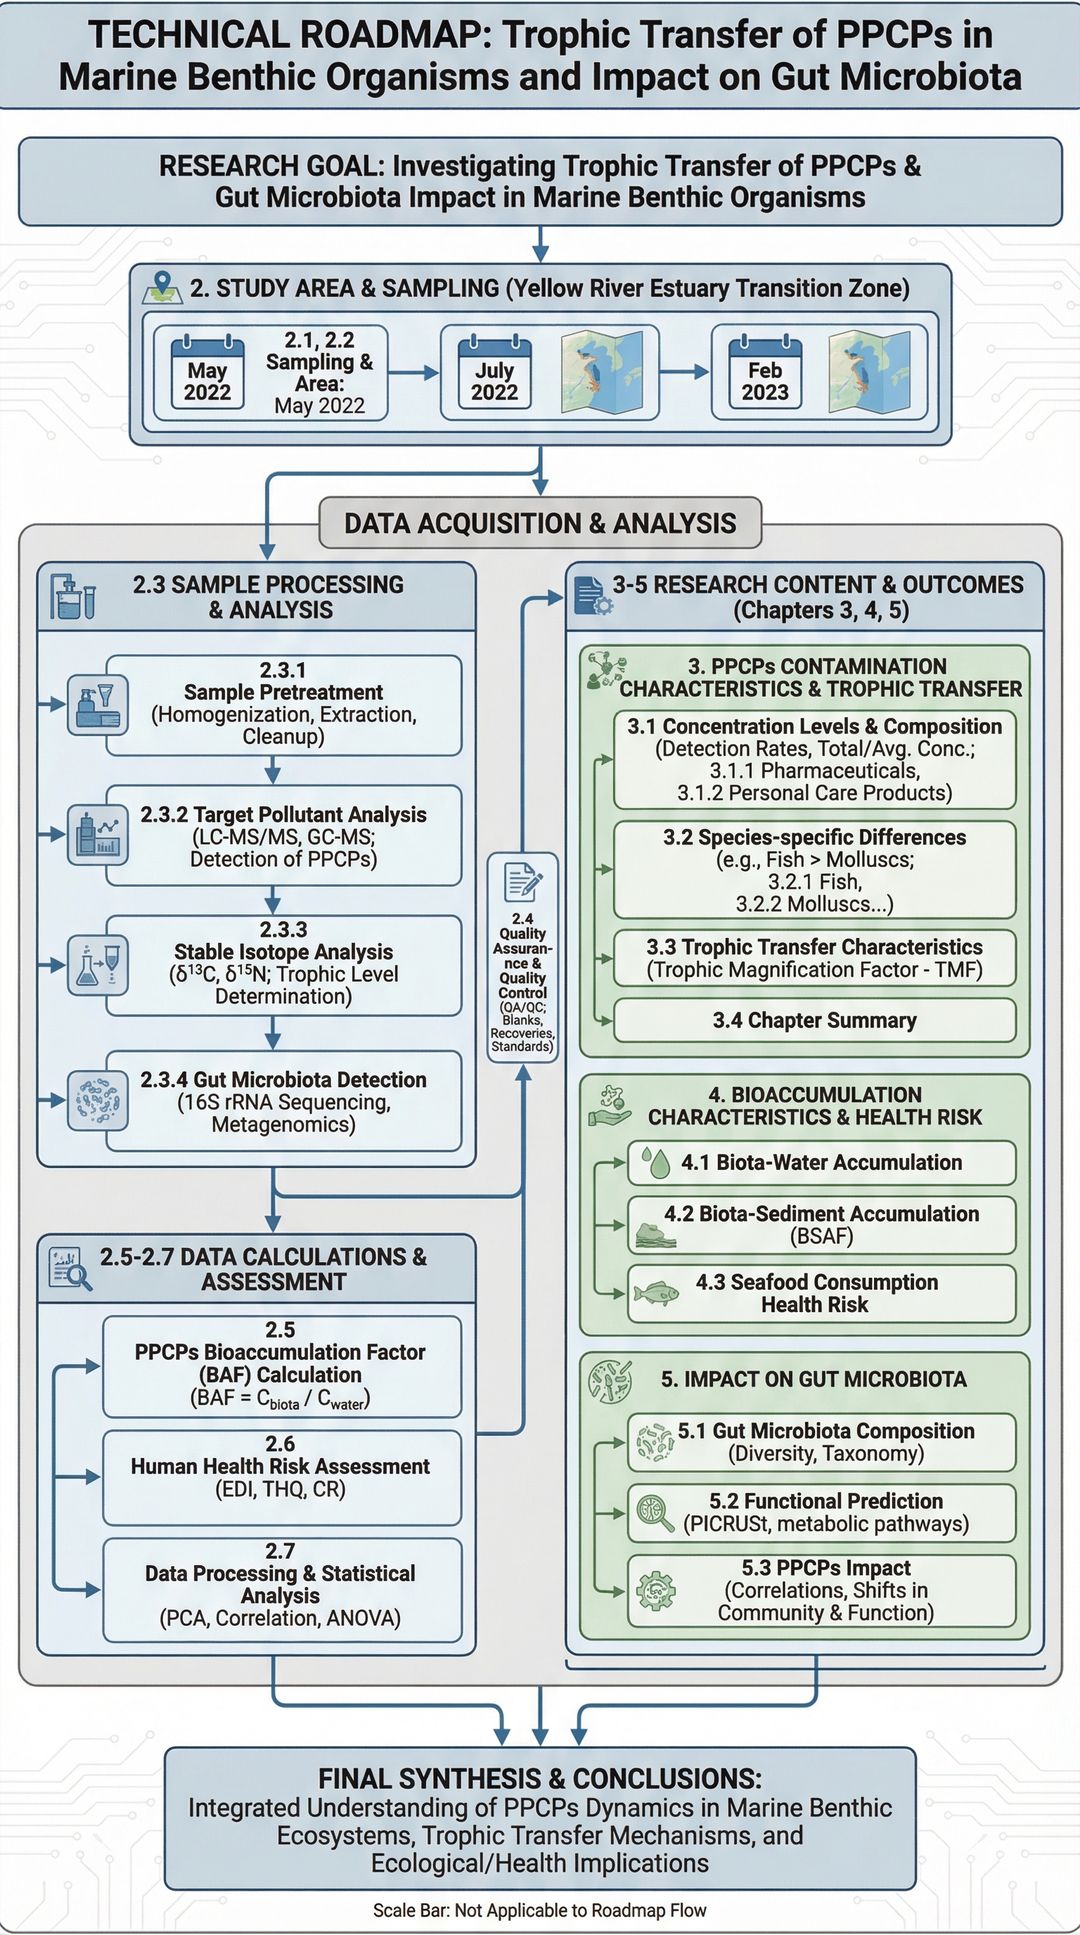
3.3 생태학적 과정 및 건강 위험
프롬프트: PPCPs 생태 및 건강 위험 프레임워크
This study focuses on the ecological processes and health risks of emerging
contaminants, specifically pharmaceuticals and personal care products in aquatic
environments. Create a framework diagram showing:
- Source identification and quantification
- Environmental fate and transport
- Ecological toxicity pathways
- Human health risk assessment
- Regulatory framework and monitoring
Use a hierarchical or flow-based structure.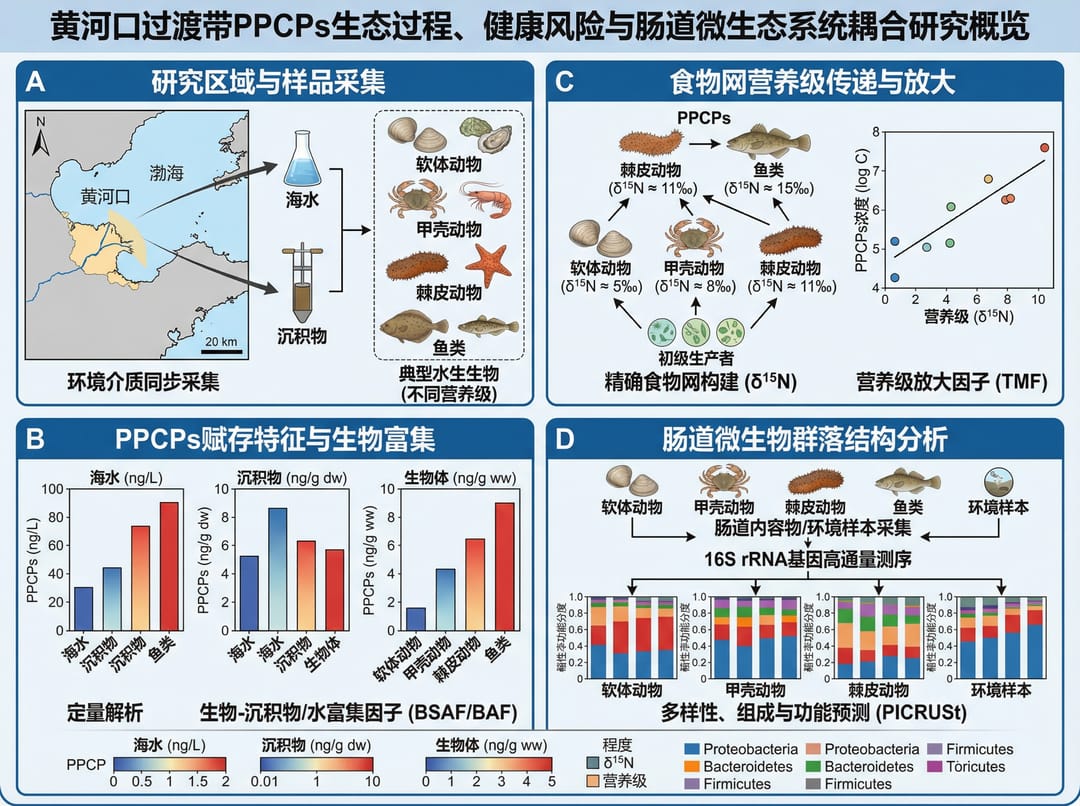
4. 지역 환경 연구
4.1 하구 생태계
프롬프트: 황하 하구 기술 로드맵
Generate a technology roadmap. This study focuses on the ecologically sensitive
Yellow River Estuary transition zone as a case study. Include:
- Study area characterization
- Research objectives and hypotheses
- Sampling and monitoring strategy
- Data analysis methods
- Expected outcomes and applications
- Timeline and milestones
Use a professional research roadmap format.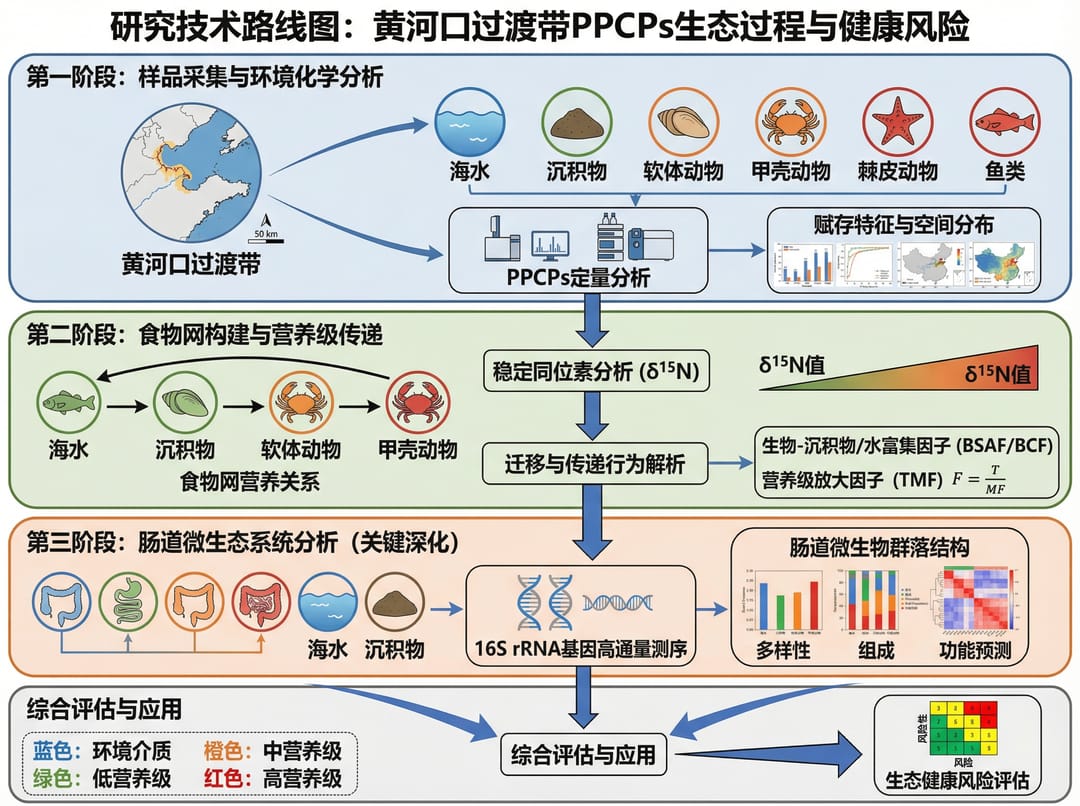
5. 문제-해결 프레임워크
5.1 원형 인포그래픽
프롬프트: 풍식 문제 연쇄 반응
Scientific illustration, circular infographic format.
Top Half: Problem Cascade illustrating the effects of wind erosion:
- Soil loss and degradation
- Nutrient depletion
- Vegetation damage
- Air quality impacts

Bottom Half: Solution Framework showing:
- Windbreak establishment
- Cover cropping
- Tillage management
- Monitoring and assessment
Use a professional circular infographic with clear visual hierarchy.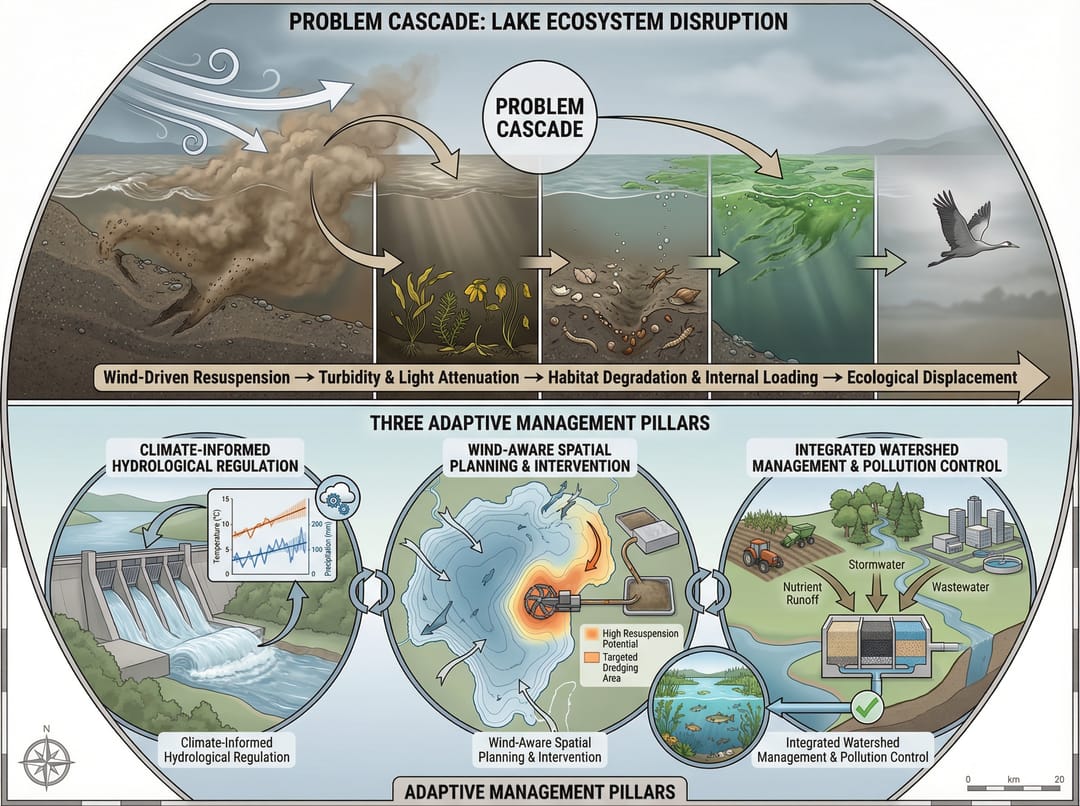
6. 인프라 및 지속 가능성
6.1 노반 재료 활용
프롬프트: 노반 충전재 연구
1.1 Research Significance
The efficient utilization of roadbed filling materials is a concrete
implementation of key transportation sustainability goals. Create a figure showing:
- Material sources (recycled, natural, industrial byproducts)
- Processing and treatment methods
- Performance requirements and testing
- Environmental benefits quantification
- Life cycle assessment framework
Use a research significance diagram style.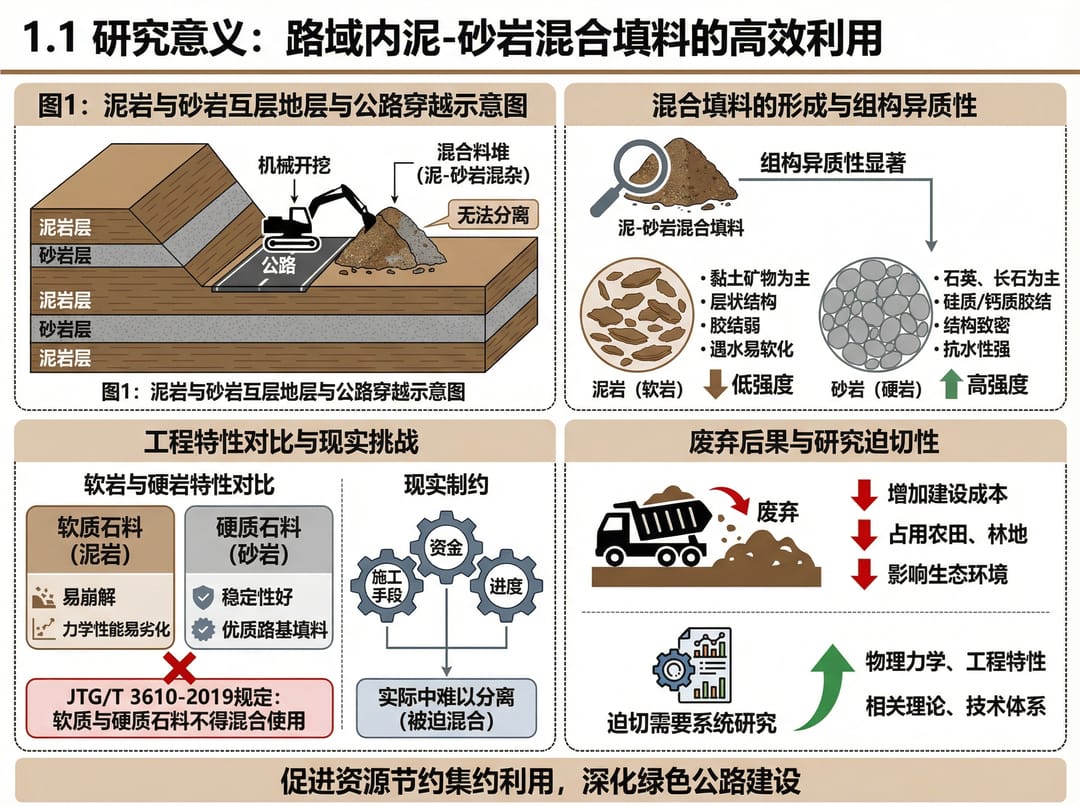
7. 환경 과학 다이어그램을 위한 모범 사례
다이어그램 유형별 필수 요소
| 다이어그램 유형 | 필수 구성 요소 |
|---|---|
| 생지화학적 순환 | 저장소, 플럭스(유속), 변환 과정, 미생물 매개체 |
| 오염 경로 | 오염원, 이동 매체, 수용체, 노출 경로 |
| 생태계 연구 | 영양 단계, 에너지 흐름, 영양분 순환, 종간 상호작용 |
| 지속 가능성 프레임워크 | 투입, 산출, 피드백 루프, 지표 |
환경 과학 프롬프트 팁
- 규모(Scale) 포함: 시간적 규모(일간, 계절간, 연간) 및 공간적 규모(지역적, 광역적, 글로벌)
- 정량적 데이터 표시: 플럭스 비율, 농도, 백분율 등
- 불확실성 표시: 해당되는 경우 오차 막대(Error bars)나 신뢰 구간 표시
- 표준 참조: EPA, WHO 또는 지역 규제 기준치 언급
- 공인된 기호 사용: 과정 및 구획에 대한 표준 기호 사용
환경 과학 다이어그램 제작 시작하기
SciDraw AI의 AI 삽화 도구를 사용하여 다음 프롬프트들을 시도해 보세요: