
心电图(ECG)图表是需求最高的医学视觉资料之一,因为学习者需要同时满足三个要素:波形的准确性、标注的清晰度以及并排对比。通用的图像提示词通常在这三方面都会失败。
本指南将为你提供一套实用的 ECG 提示词系统,以及 30 个可以直接在 SciDraw AI 中使用的模板。
使用场景:医学教育幻灯片、考试复习讲义、床旁教学以及可用于发表的论文概念图。
为什么 ECG 提示词通常会失败
大多数提示词过于简短,例如:“画一个三度房室传导阻滞的心电图”。这通常会生成艺术化的线条,缺失标注,或者在临床上间期不一致。
一个强大的 ECG 提示词应包含:
- 临床情景(什么心律或病理改变)
- 波形规则(PR、QRS、ST、T 波的具体表现)
- 版面结构(单条带 vs 并排对比)
- 标注要求(导联名称、箭头、间期标签)
- 教学背景(学生水平和预期的学习目标)
准确 ECG 图表的提示词公式
使用此结构:
Create a medical teaching ECG diagram of [condition].
Layout: [single strip / 2-panel / 4-panel comparison], white background.
Show leads: [lead II / V1-V6 / 12-lead summary].
Waveform rules: [PR/QRS/ST/T specifics].
Add labels: [key findings, arrows, interval values].
Style: clean textbook-style vector, high contrast, publication-ready.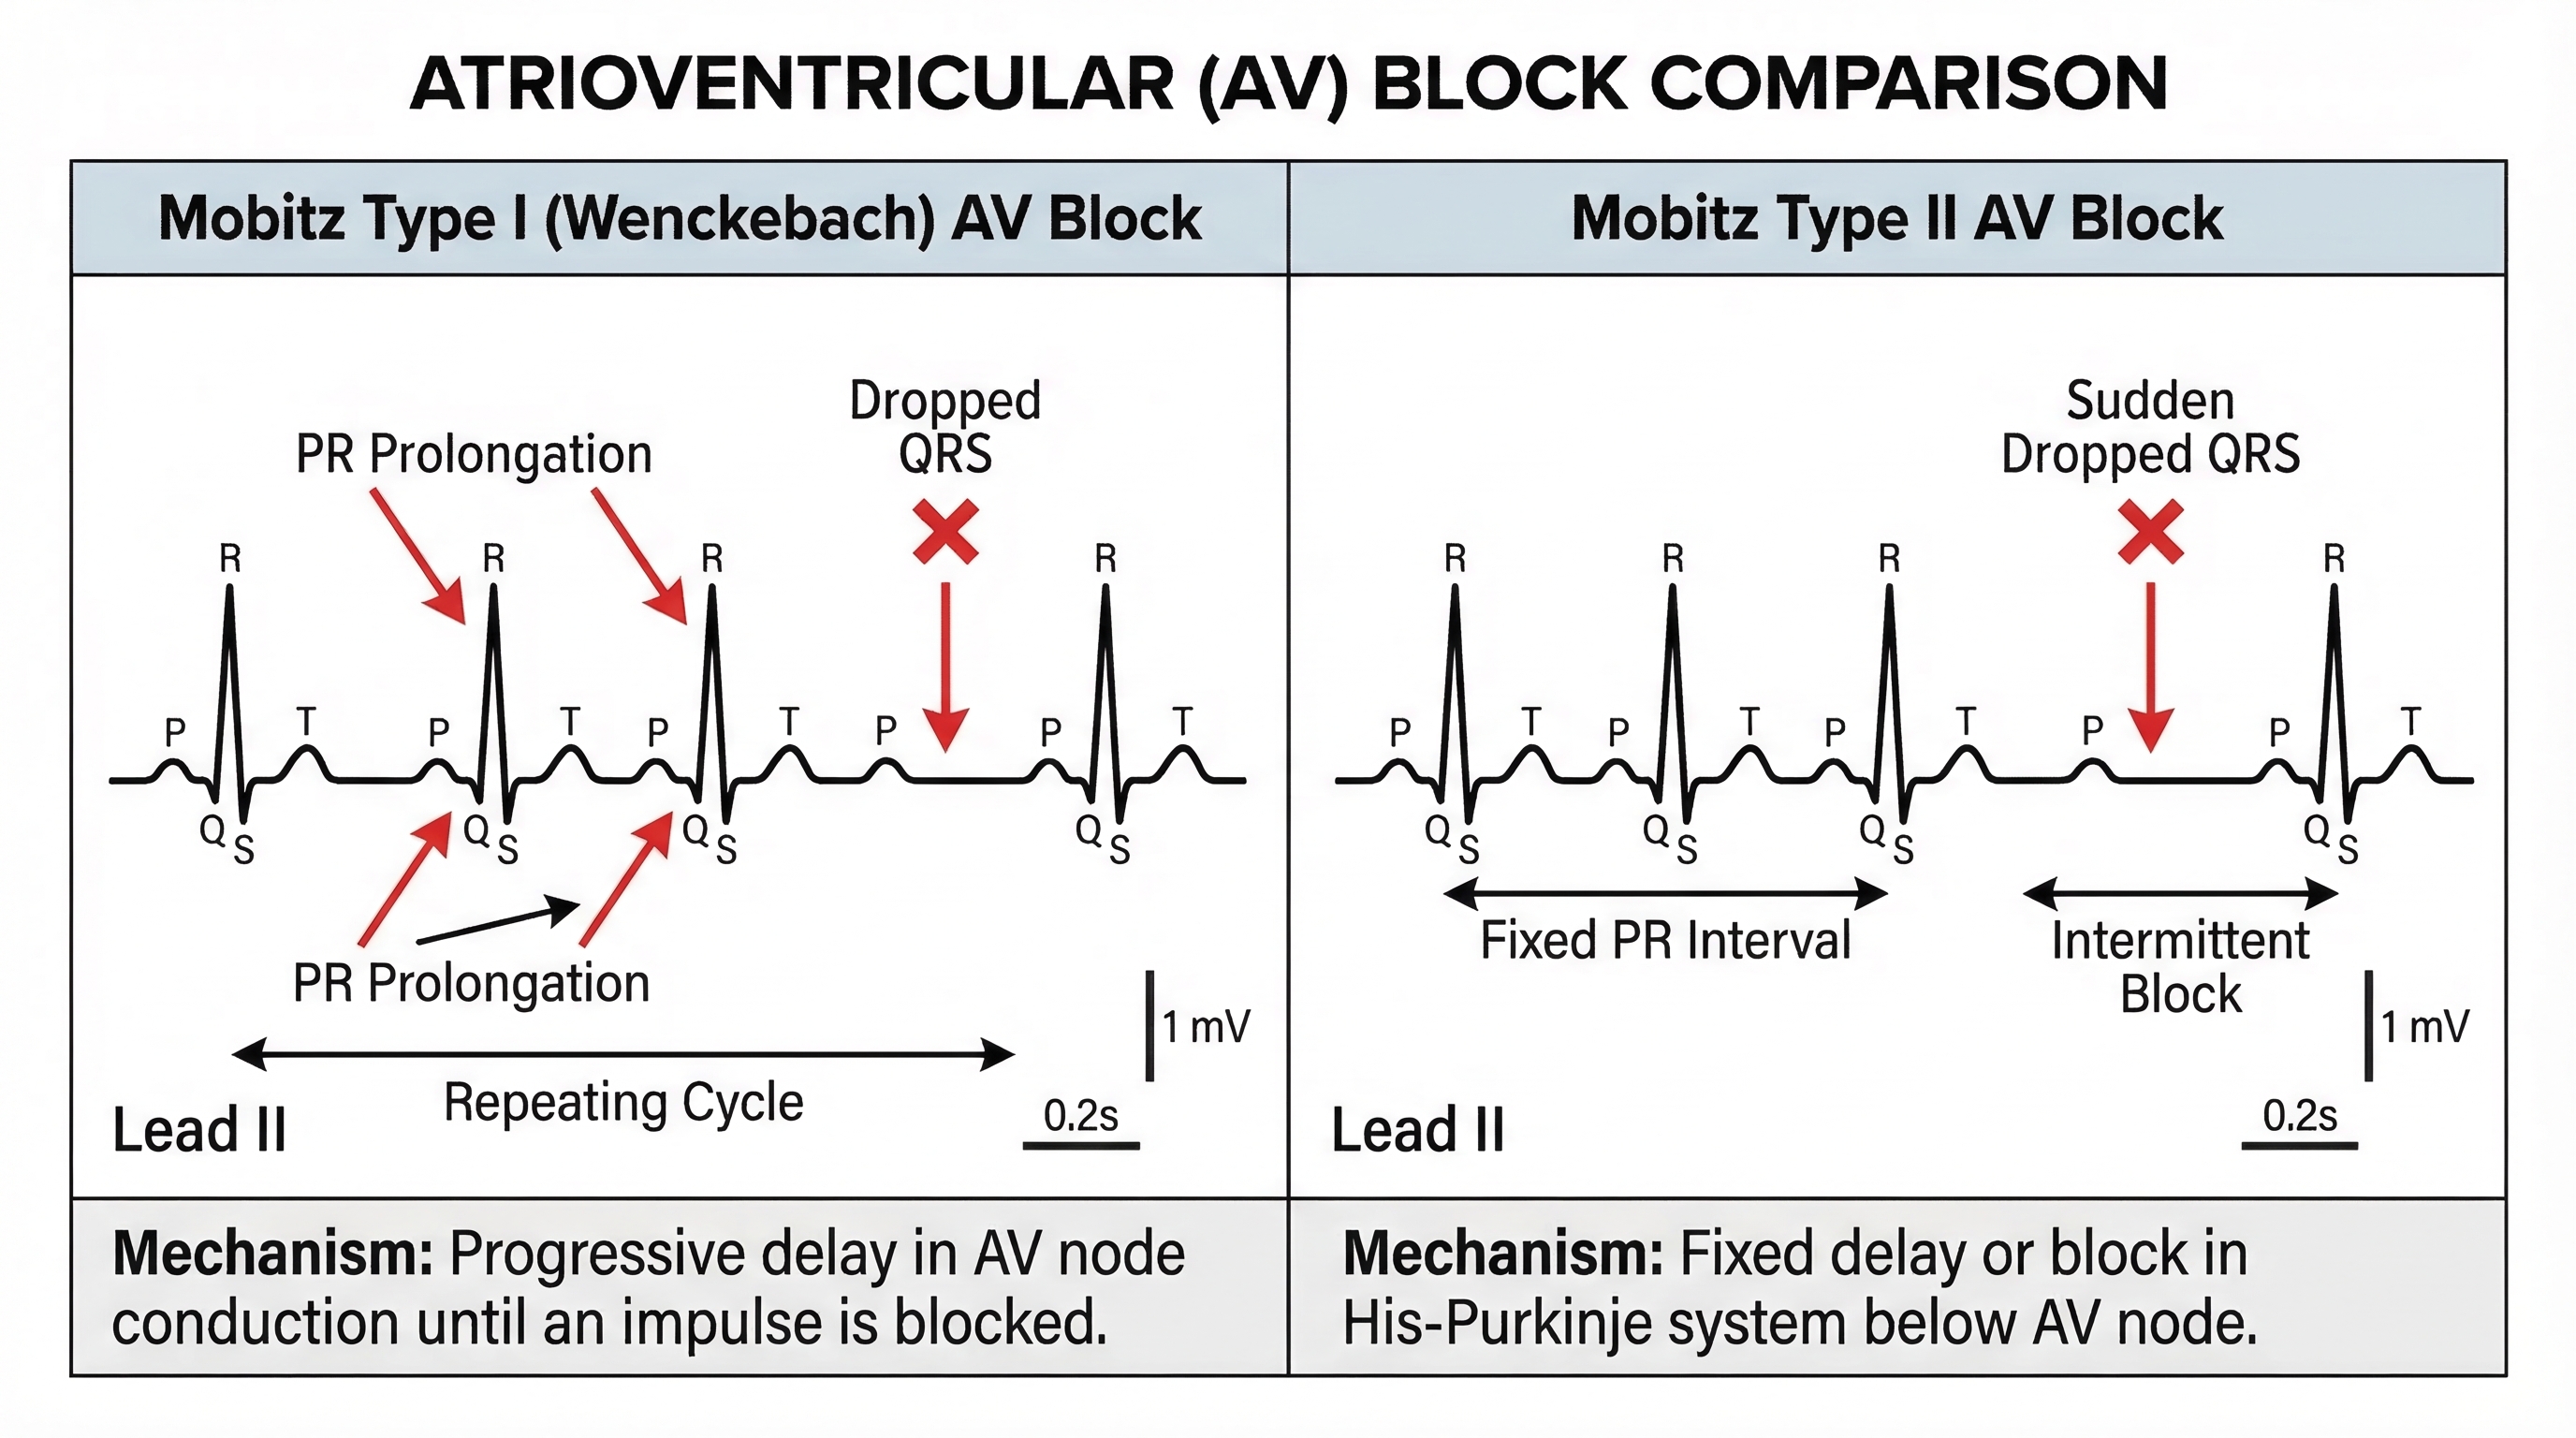
30 个 ECG 提示词模板
1) 传导阻滞
Third-degree AV block ECG teaching diagram, 2-panel layout.
Panel A: normal sinus rhythm reference. Panel B: complete AV dissociation with
independent P waves and QRS escape rhythm. Label PR inconsistency, slow
ventricular rate, and AV dissociation arrows. Clean textbook style.
Mobitz I vs Mobitz II comparison ECG, side-by-side.
Left: progressive PR prolongation before dropped QRS. Right: fixed PR with
intermittent non-conducted P wave. Add interval callouts and color-coded labels.First-degree AV block ECG, lead II strip with normal morphology but prolonged
PR interval >200 ms. Add measurement bars and label thresholds.2) 缺血与心肌梗死
STEMI localization ECG chart, 4-panel grid.
Inferior, anterior, lateral, and posterior patterns with affected leads and
reciprocal changes labeled. Include artery correlation notes.
NSTEMI vs STEMI ECG teaching figure, 2-panel comparison.
Left: NSTEMI ST depression/T inversion pattern. Right: STEMI ST elevation with
contiguous leads. Add decision labels for emergency pathway.Hyperacute T wave progression to ST elevation timeline in acute MI, 3-stage
horizontal diagram with clear temporal arrows.3) 心律失常识别
Atrial fibrillation ECG teaching figure, irregularly irregular rhythm,
no discrete P waves, variable R-R intervals. Add rhythm strip markers.
Atrial flutter ECG with sawtooth flutter waves and 2:1 conduction example.
Include lead II emphasis and comparison inset with sinus rhythm.SVT vs ventricular tachycardia quick differentiation chart with QRS width,
rate range, and AV relationship labels.4) 波形形态与电解质
T-wave morphology atlas ECG panel: peaked T wave, inverted T wave,
biphasic T wave, and hyperacute T wave with labels and clinical hints.
Hyperkalemia progression ECG sequence: peaked T, PR prolongation,
QRS widening, sine-wave morphology. Four-stage panel with arrows.Osborn wave (J wave) educational ECG figure in hypothermia context,
with notch labeling at J point and differential notes.5) 教学与评估版面
ECG interpretation checklist infographic for medical students.
Sections: rate, rhythm, axis, intervals, morphology, ischemia signs.
Include icon-based flow and quick examples.
12-lead ECG systematic reading workflow, top-to-bottom algorithm chart with
branch decisions and common pitfalls.ECG exam review summary page with mini-strips and key diagnostic clues,
optimized for one-page print handout.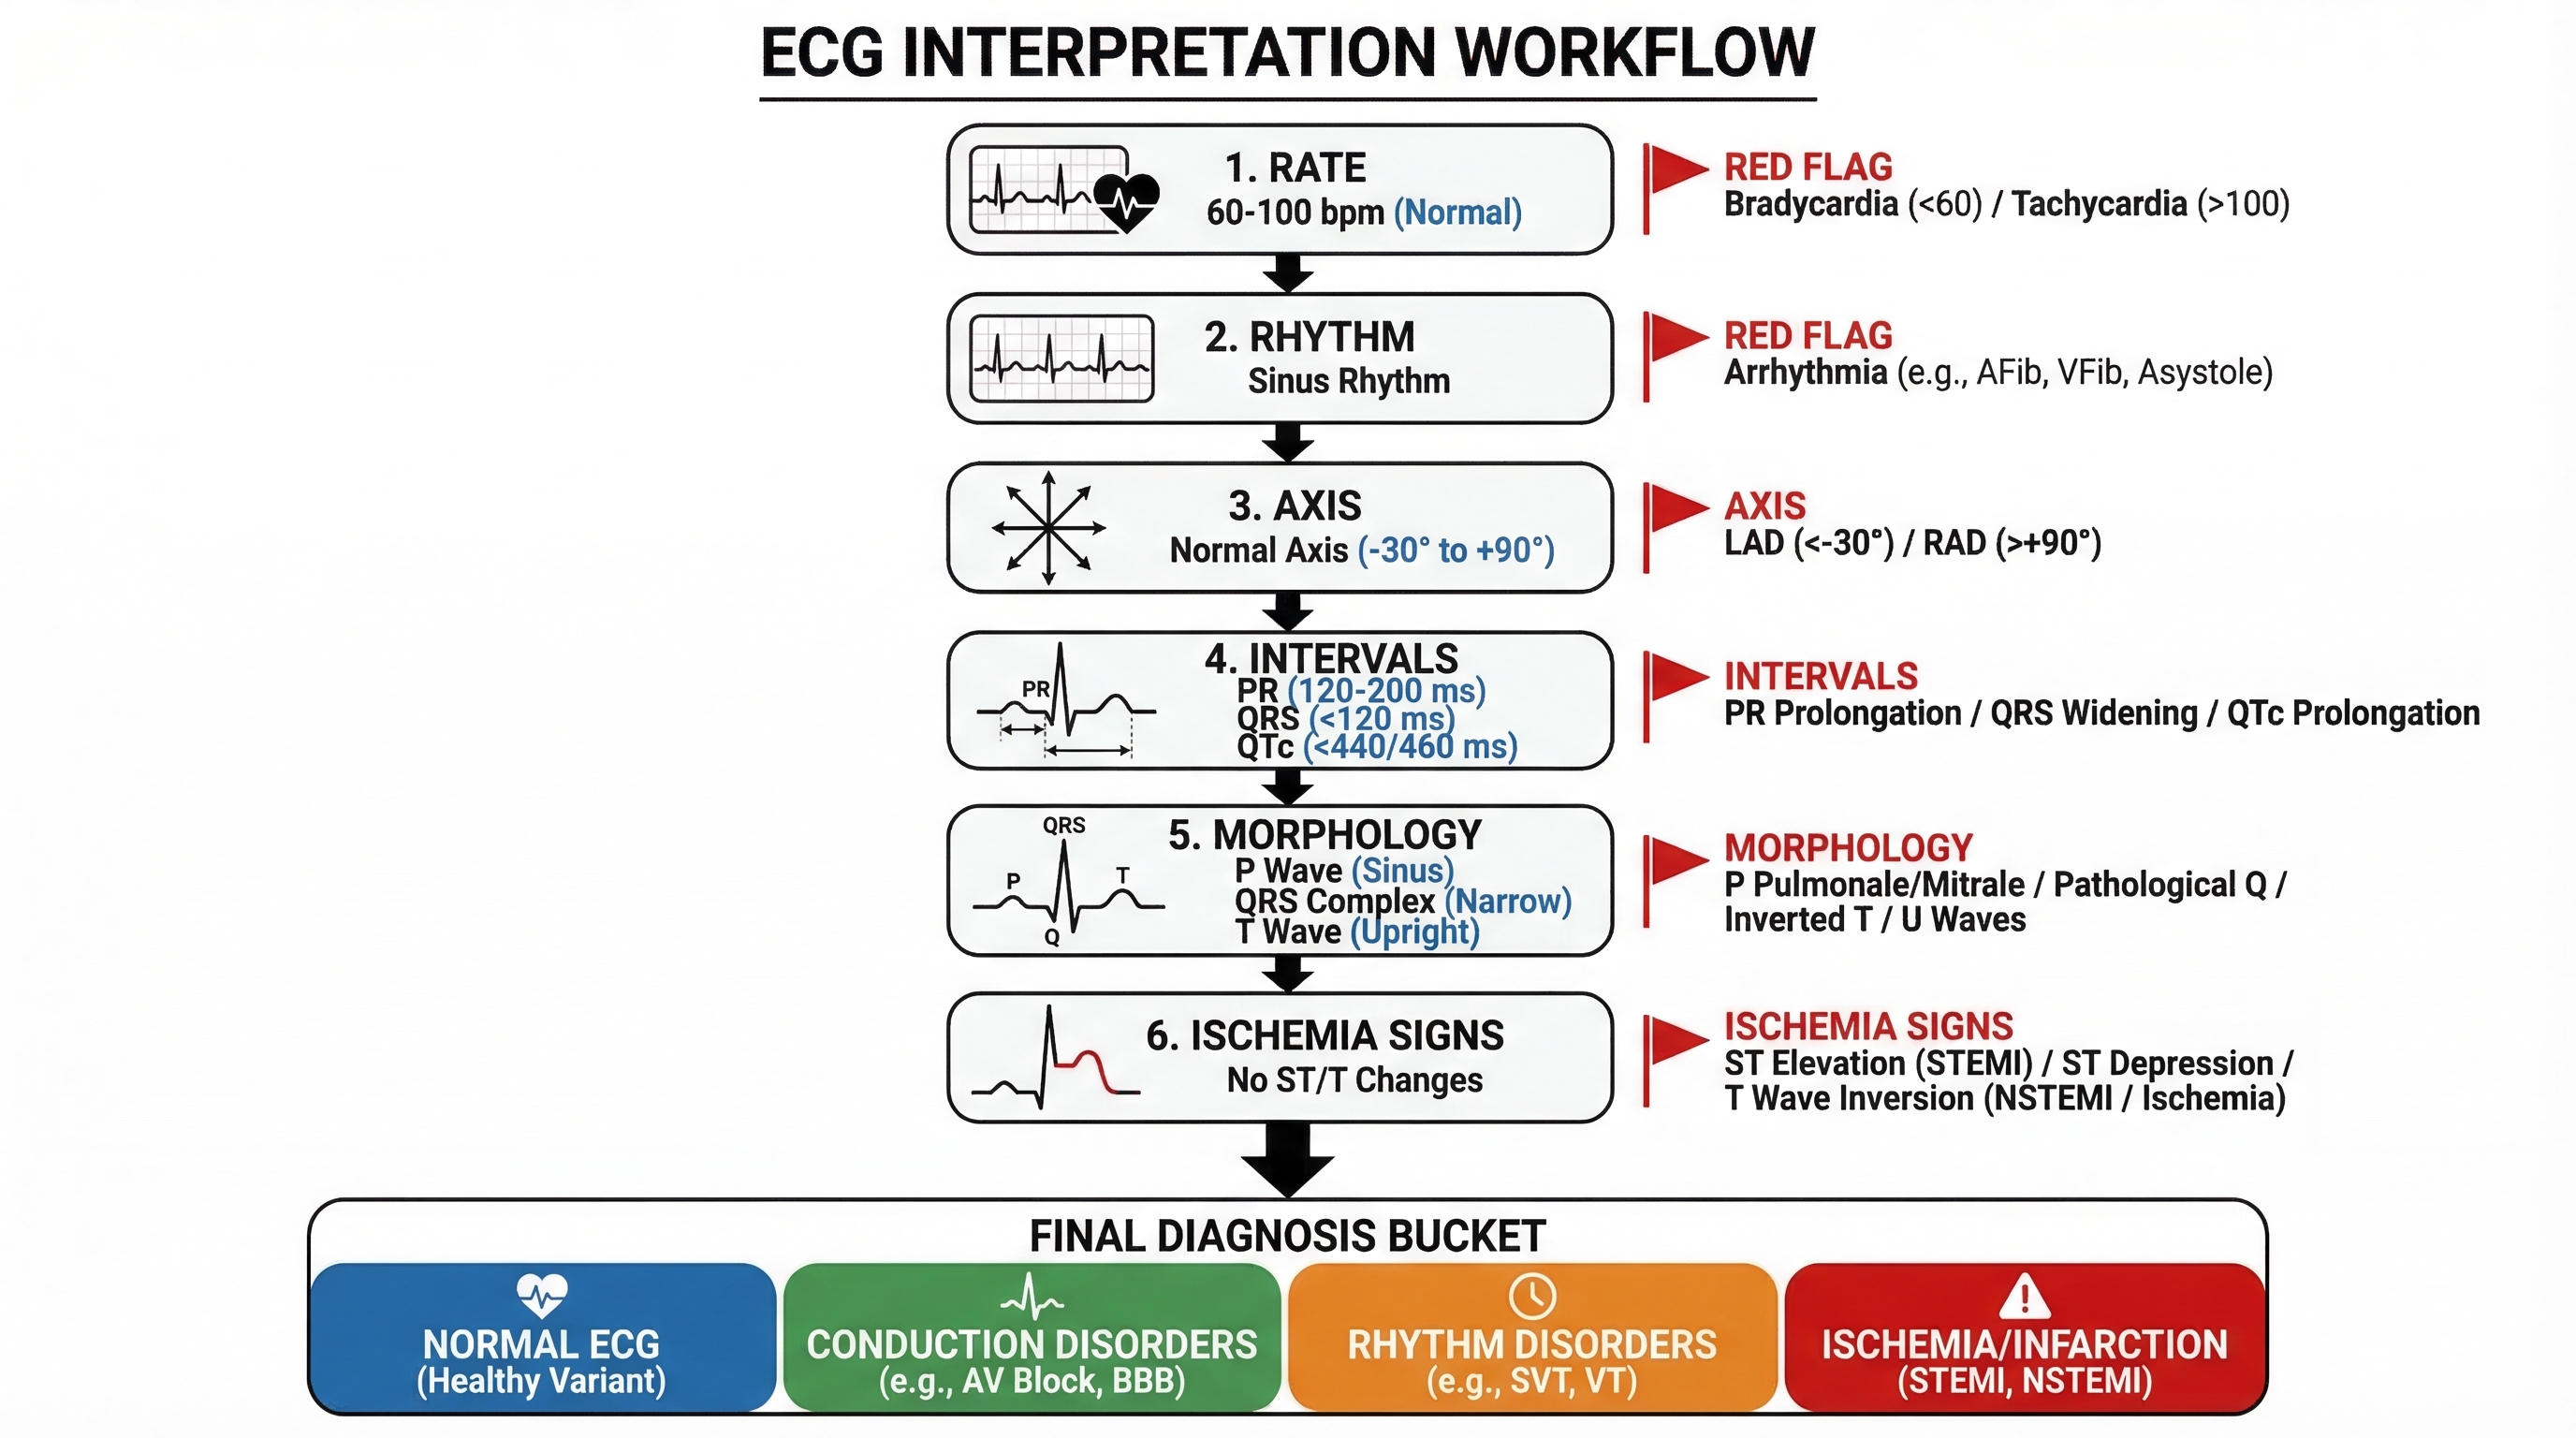
你可以通过仅替换疾病名称和波形规则来调整每个模板。
导出前的质量检查清单
- 波形在临床上是否合理?
- 导联名称和标注在幻灯片比例下是否清晰可读?
- 对比布局是否清晰地回答了一个教学问题?
- 间期数值和诊断线索是否进行了明确的标注?
- 配色方案是否足够简洁,以满足投影和打印的需求?
最终建议
如果你的输出结果看起来“美观但模糊”,请添加更严格的波形约束和明确的标注要求。在 ECG 视觉资料中,精准度胜过装饰性。
准备好生成你自己的 ECG 教学图表了吗?


")
")