Free Plasmid Map Maker
Create a labeled circular plasmid map from plain text
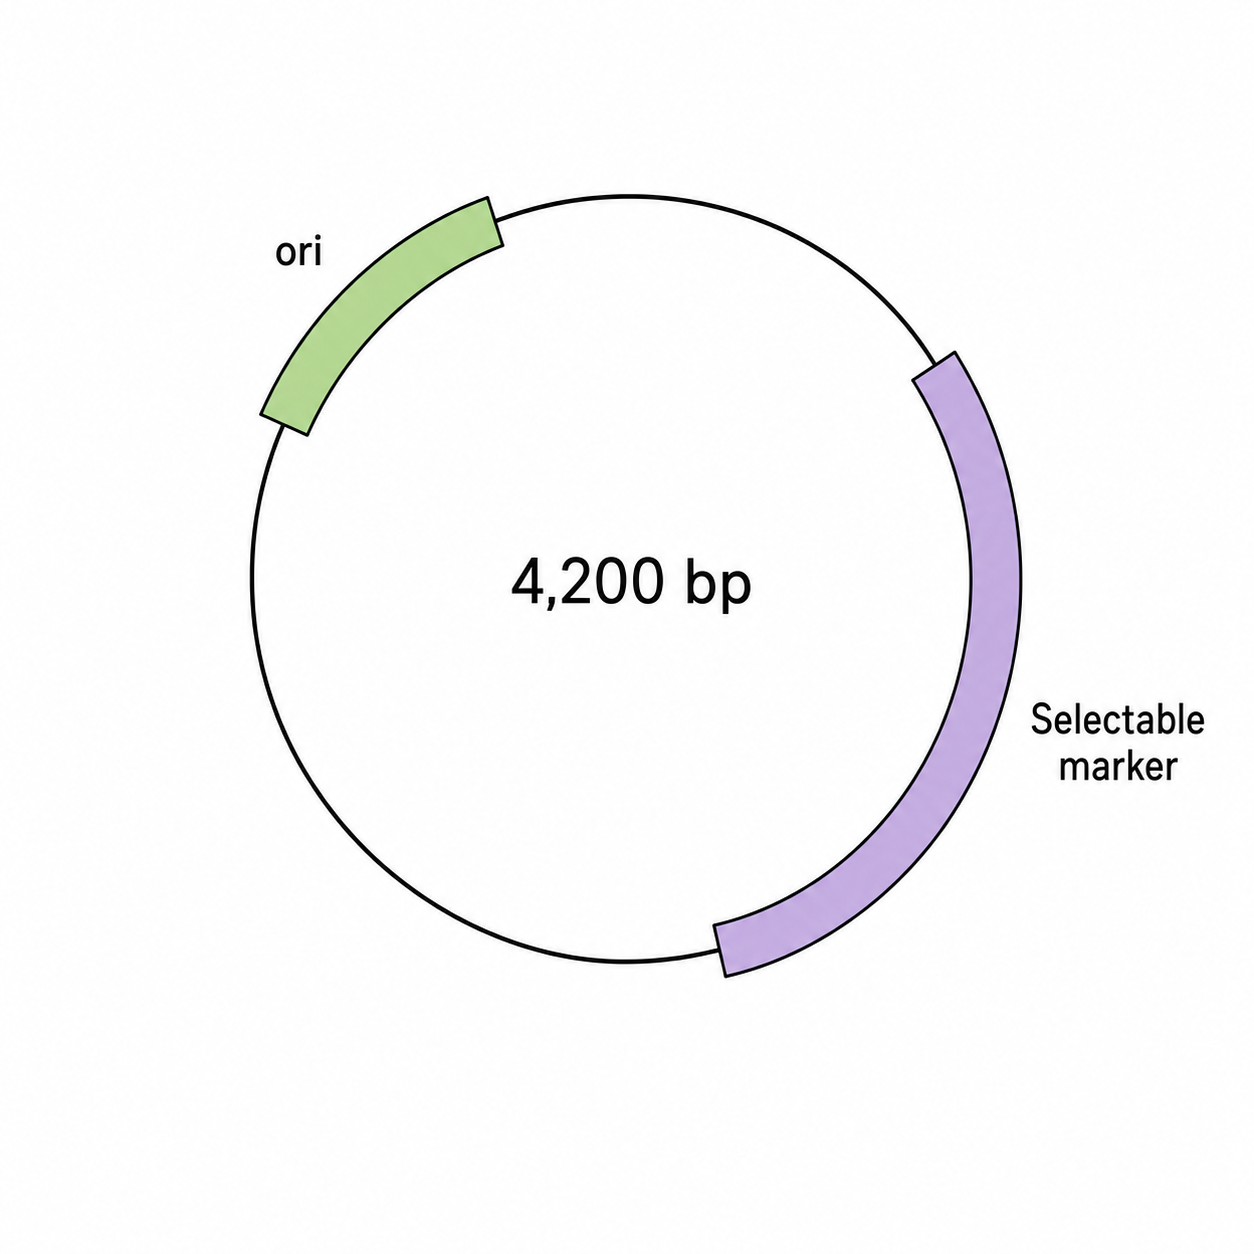
Describe your vector's total size, origin of replication, selectable marker, multiple cloning site, promoter, and insert, and AI draws a clean, publication-ready plasmid map — ideal for cloning notes, lab notebooks, and molecular biology papers.
Plasmid map examples
Click any example to load its prompt, or use it as a starting point for your own plasmid map.
What is a plasmid map?
A plasmid map is a circular diagram of a cloning or expression vector that shows its key features as labeled arcs and arrows around the ring. A typical plasmid map marks the origin of replication (ori), a selectable marker such as AmpR or KanR, the multiple cloning site (MCS) with its restriction sites, a promoter, the gene or insert of interest, terminators, and any affinity tags. The total length is given in base pairs (bp), restriction enzyme sites are placed at their cut positions, and arrows point in the direction of transcription. SciDraw AI turns your text description into a clean, labeled plasmid map so you do not have to draw the circle and arcs by hand.
Why use a plasmid map maker?
- Get a labeled circular plasmid map in seconds instead of drawing arcs and arrows by hand.
- Show exactly the features you need — ori, marker, MCS, promoter, insert, and tags.
- Place restriction sites and bp positions clearly for cloning notes and protocols.
- Produce tidy vector diagrams for papers, posters, theses, and lab notebooks.
- Communicate a construct's layout to collaborators without specialized drawing software.
How to make a plasmid map
Describe your vector in plain language: give its total size in base pairs, name the origin of replication and selectable marker, and list the promoter, insert, terminator, and any tags you want shown as arrows. Add the restriction sites you want marked and their approximate positions. Then generate, and SciDraw AI draws a clean circular plasmid map with labeled arcs, directional arrows, and restriction sites. Refine the prompt and regenerate until the plasmid map matches your construct.
What a plasmid map shows
- Origin of replication (ori) that lets the plasmid copy itself in the host
- A selectable antibiotic-resistance marker such as AmpR or KanR
- The multiple cloning site (MCS) with its restriction enzyme sites
- A promoter driving expression of the gene or insert of interest
- The total plasmid size labeled in base pairs (bp)
- Directional arrows showing the direction of transcription
Plasmid map FAQ
What is a plasmid map?
A plasmid map is a circular diagram of a cloning or expression vector. It shows the plasmid's key features as labeled arcs and arrows — the origin of replication (ori), a selectable marker, the multiple cloning site with restriction sites, a promoter, the gene or insert, terminators, and tags — together with the total size in base pairs. It is the standard way to summarize how a vector is built and where each element sits.
What features does a plasmid map show?
A plasmid map typically shows the origin of replication (ori) that lets the vector replicate, a selectable marker such as AmpR or KanR for antibiotic selection, the multiple cloning site (MCS) where inserts are cloned, a promoter that drives expression, the gene or insert of interest, terminators, and affinity tags. Each feature is drawn as a labeled arc or arrow, and arrows point in the direction of transcription.
Why are restriction sites and bp positions shown?
Restriction enzyme sites are marked at their base-pair cut positions because they define where a vector can be cut and ligated during cloning. Showing the sites and their bp positions makes it clear which enzymes give unique cuts, where an insert can be placed in the multiple cloning site, and how to plan a digest. The total size in bp also lets you predict fragment sizes on a gel.
How do I make a plasmid map online?
Type a short description of your vector, such as a 5 kb expression plasmid with an ori, an AmpR marker, a T7 promoter driving a His-tagged gene, and EcoRI and BamHI sites. SciDraw AI then draws a clean circular plasmid map with labeled arcs, directional arrows, and restriction sites. You can adjust the wording and regenerate until the plasmid map matches your construct.
Is the plasmid map maker free?
Yes, you can start for free. Create an account and you receive free credits to generate plasmid maps right away, with paid plans available if you need to make many vector maps and plasmid diagrams on a regular basis.
Can I use it for research papers and lab notebooks?
Yes. The plasmid maps are well suited to figures for papers, posters, theses, lab notebooks, and teaching. They are meant for illustration and communication, so for actual cloning you should still verify the real sequence, sites, and reading frame in dedicated plasmid-editing software before ordering primers or running a digest.
Explore More Tools
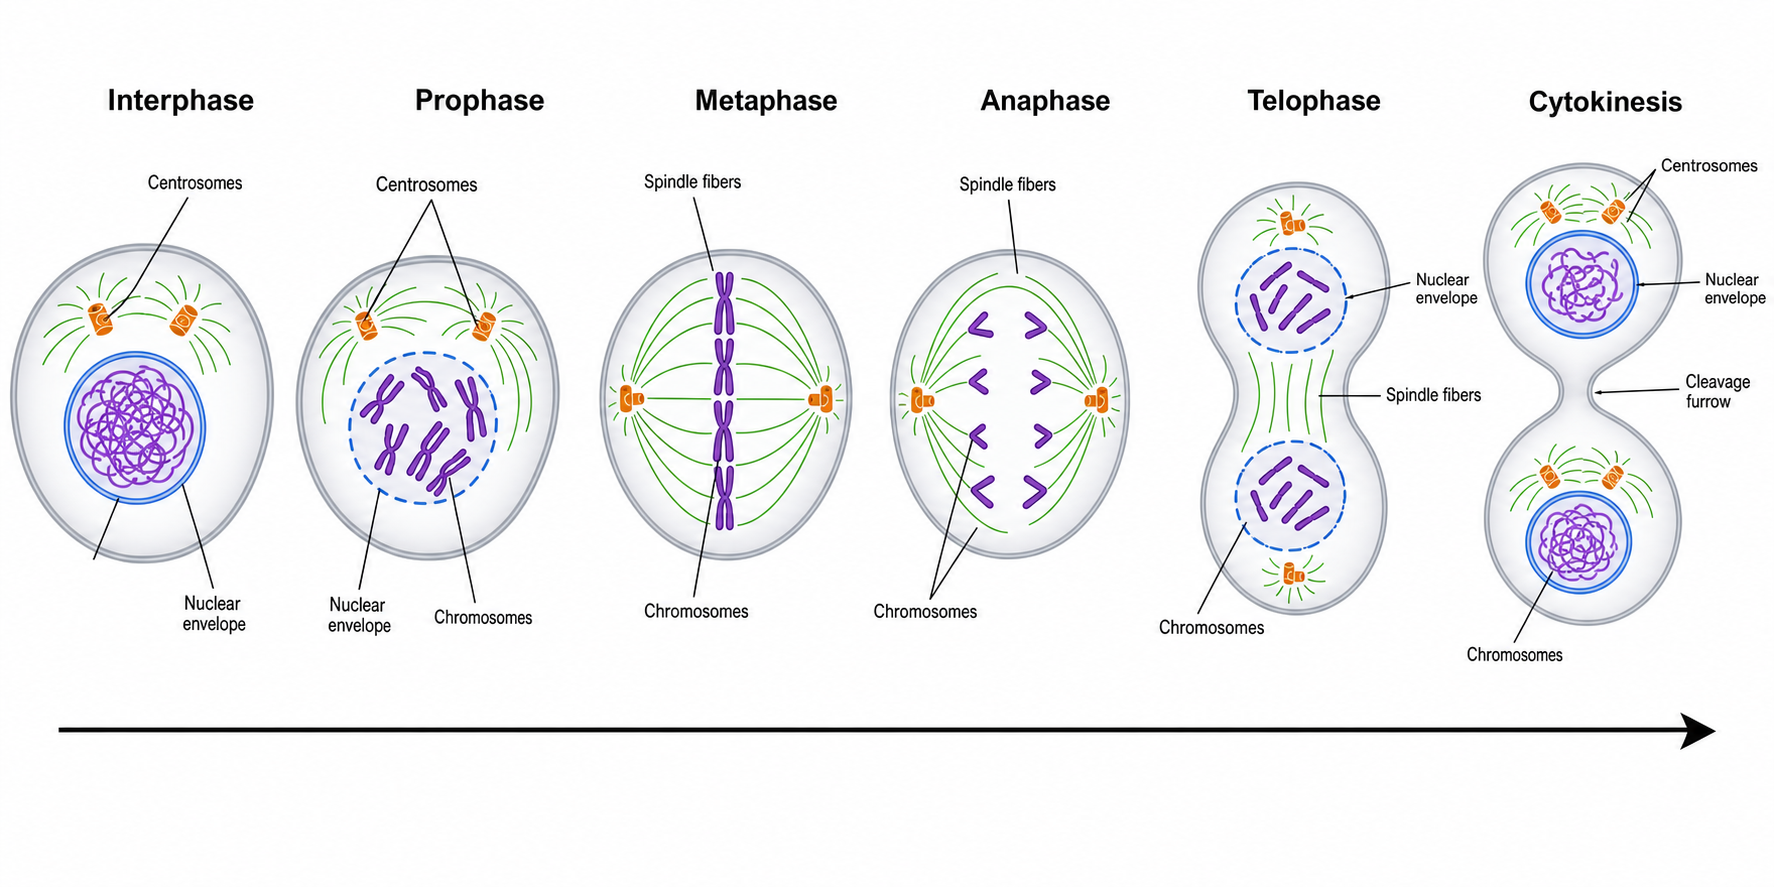
Mitosis Diagram Generator
Draw labeled phases of mitosis — prophase, metaphase, anaphase, telophase — in order.
Try it free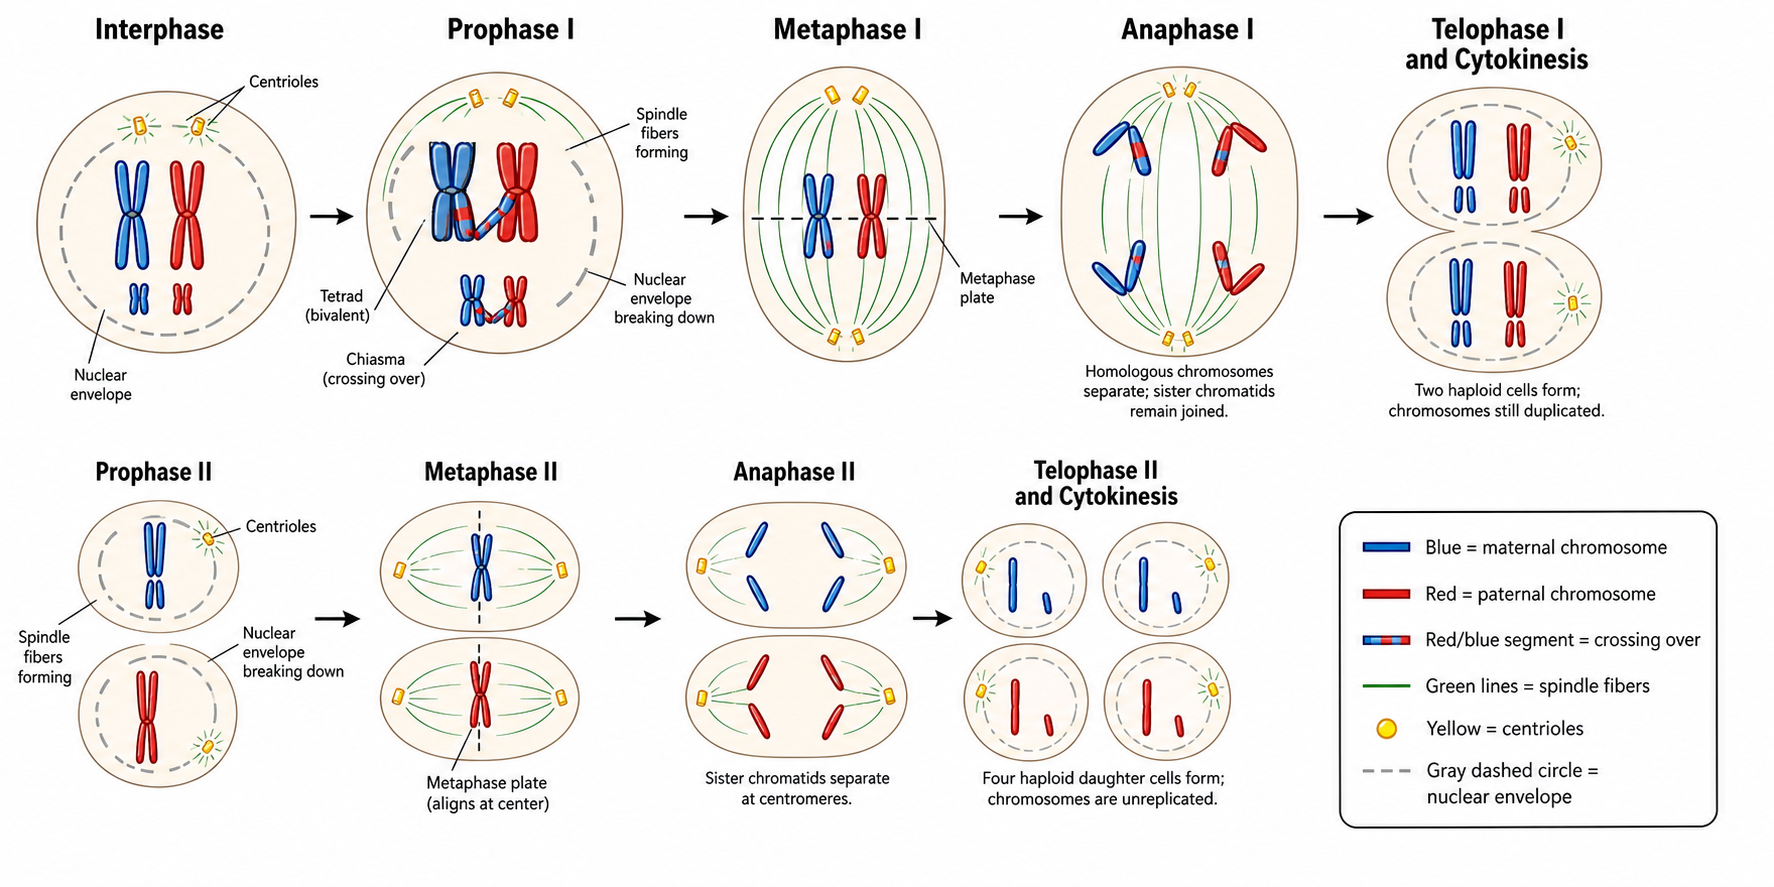
Meiosis Diagram Generator
Create labeled meiosis diagrams, the phases of meiosis I and II, and crossing over.
Try it free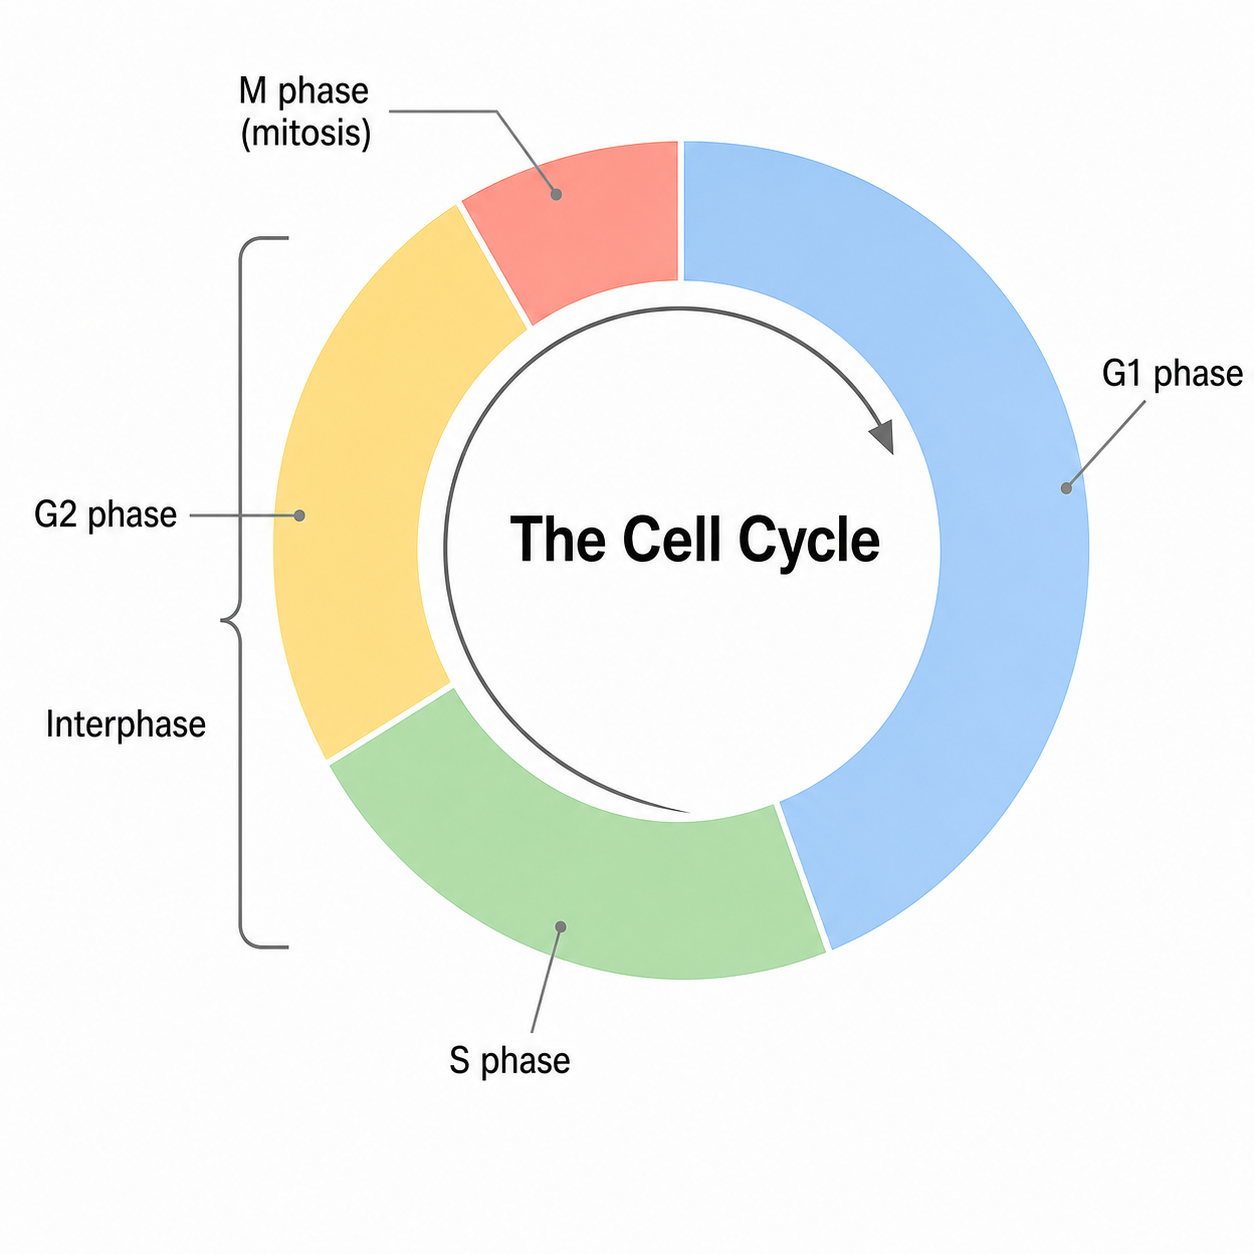
Cell Cycle Diagram Generator
Make labeled cell cycle diagrams with interphase, G1, S, G2, the M phase and checkpoints.
Try it freeDraw your plasmid map now
Describe your vector's size, ori, marker, MCS, and promoter and get a clean, labeled circular plasmid map in seconds. Start free with SciDraw AI.