
많은 팀이 목적에 맞지 않는 그림 유형을 사용합니다. 그 결과는 대개 비슷합니다. 시각적으로는 "보기 좋지만" 핵심 메시지를 전달하는 데는 실패한 이미지입니다.
이 가이드는 과학적 커뮤니케이션을 위한 올바른 그림 형식을 선택하는 데 도움을 줍니다. 각 유형별로 다음 내용을 제공합니다:
- 사용 시기
- 포함해야 할 내용
- 바로 사용할 수 있는 프롬프트 한 개
- 생성된 예시 한 개
1) Graphical Abstract (그래픽 초록)
연구 전체 이야기(문제, 방법, 결과)를 한 화면에 요약해야 할 때 사용하세요.
적합한 용도:
- 저널 투고
- 논문 랜딩 페이지
- 연구 하이라이트의 소셜 공유
Prompt template
Create a graphical abstract for [study topic].
Three connected panels: problem context, core method, key outcome.
Use concise English labels, directional arrows, and high information density.
Clean white background, publication-ready scientific style.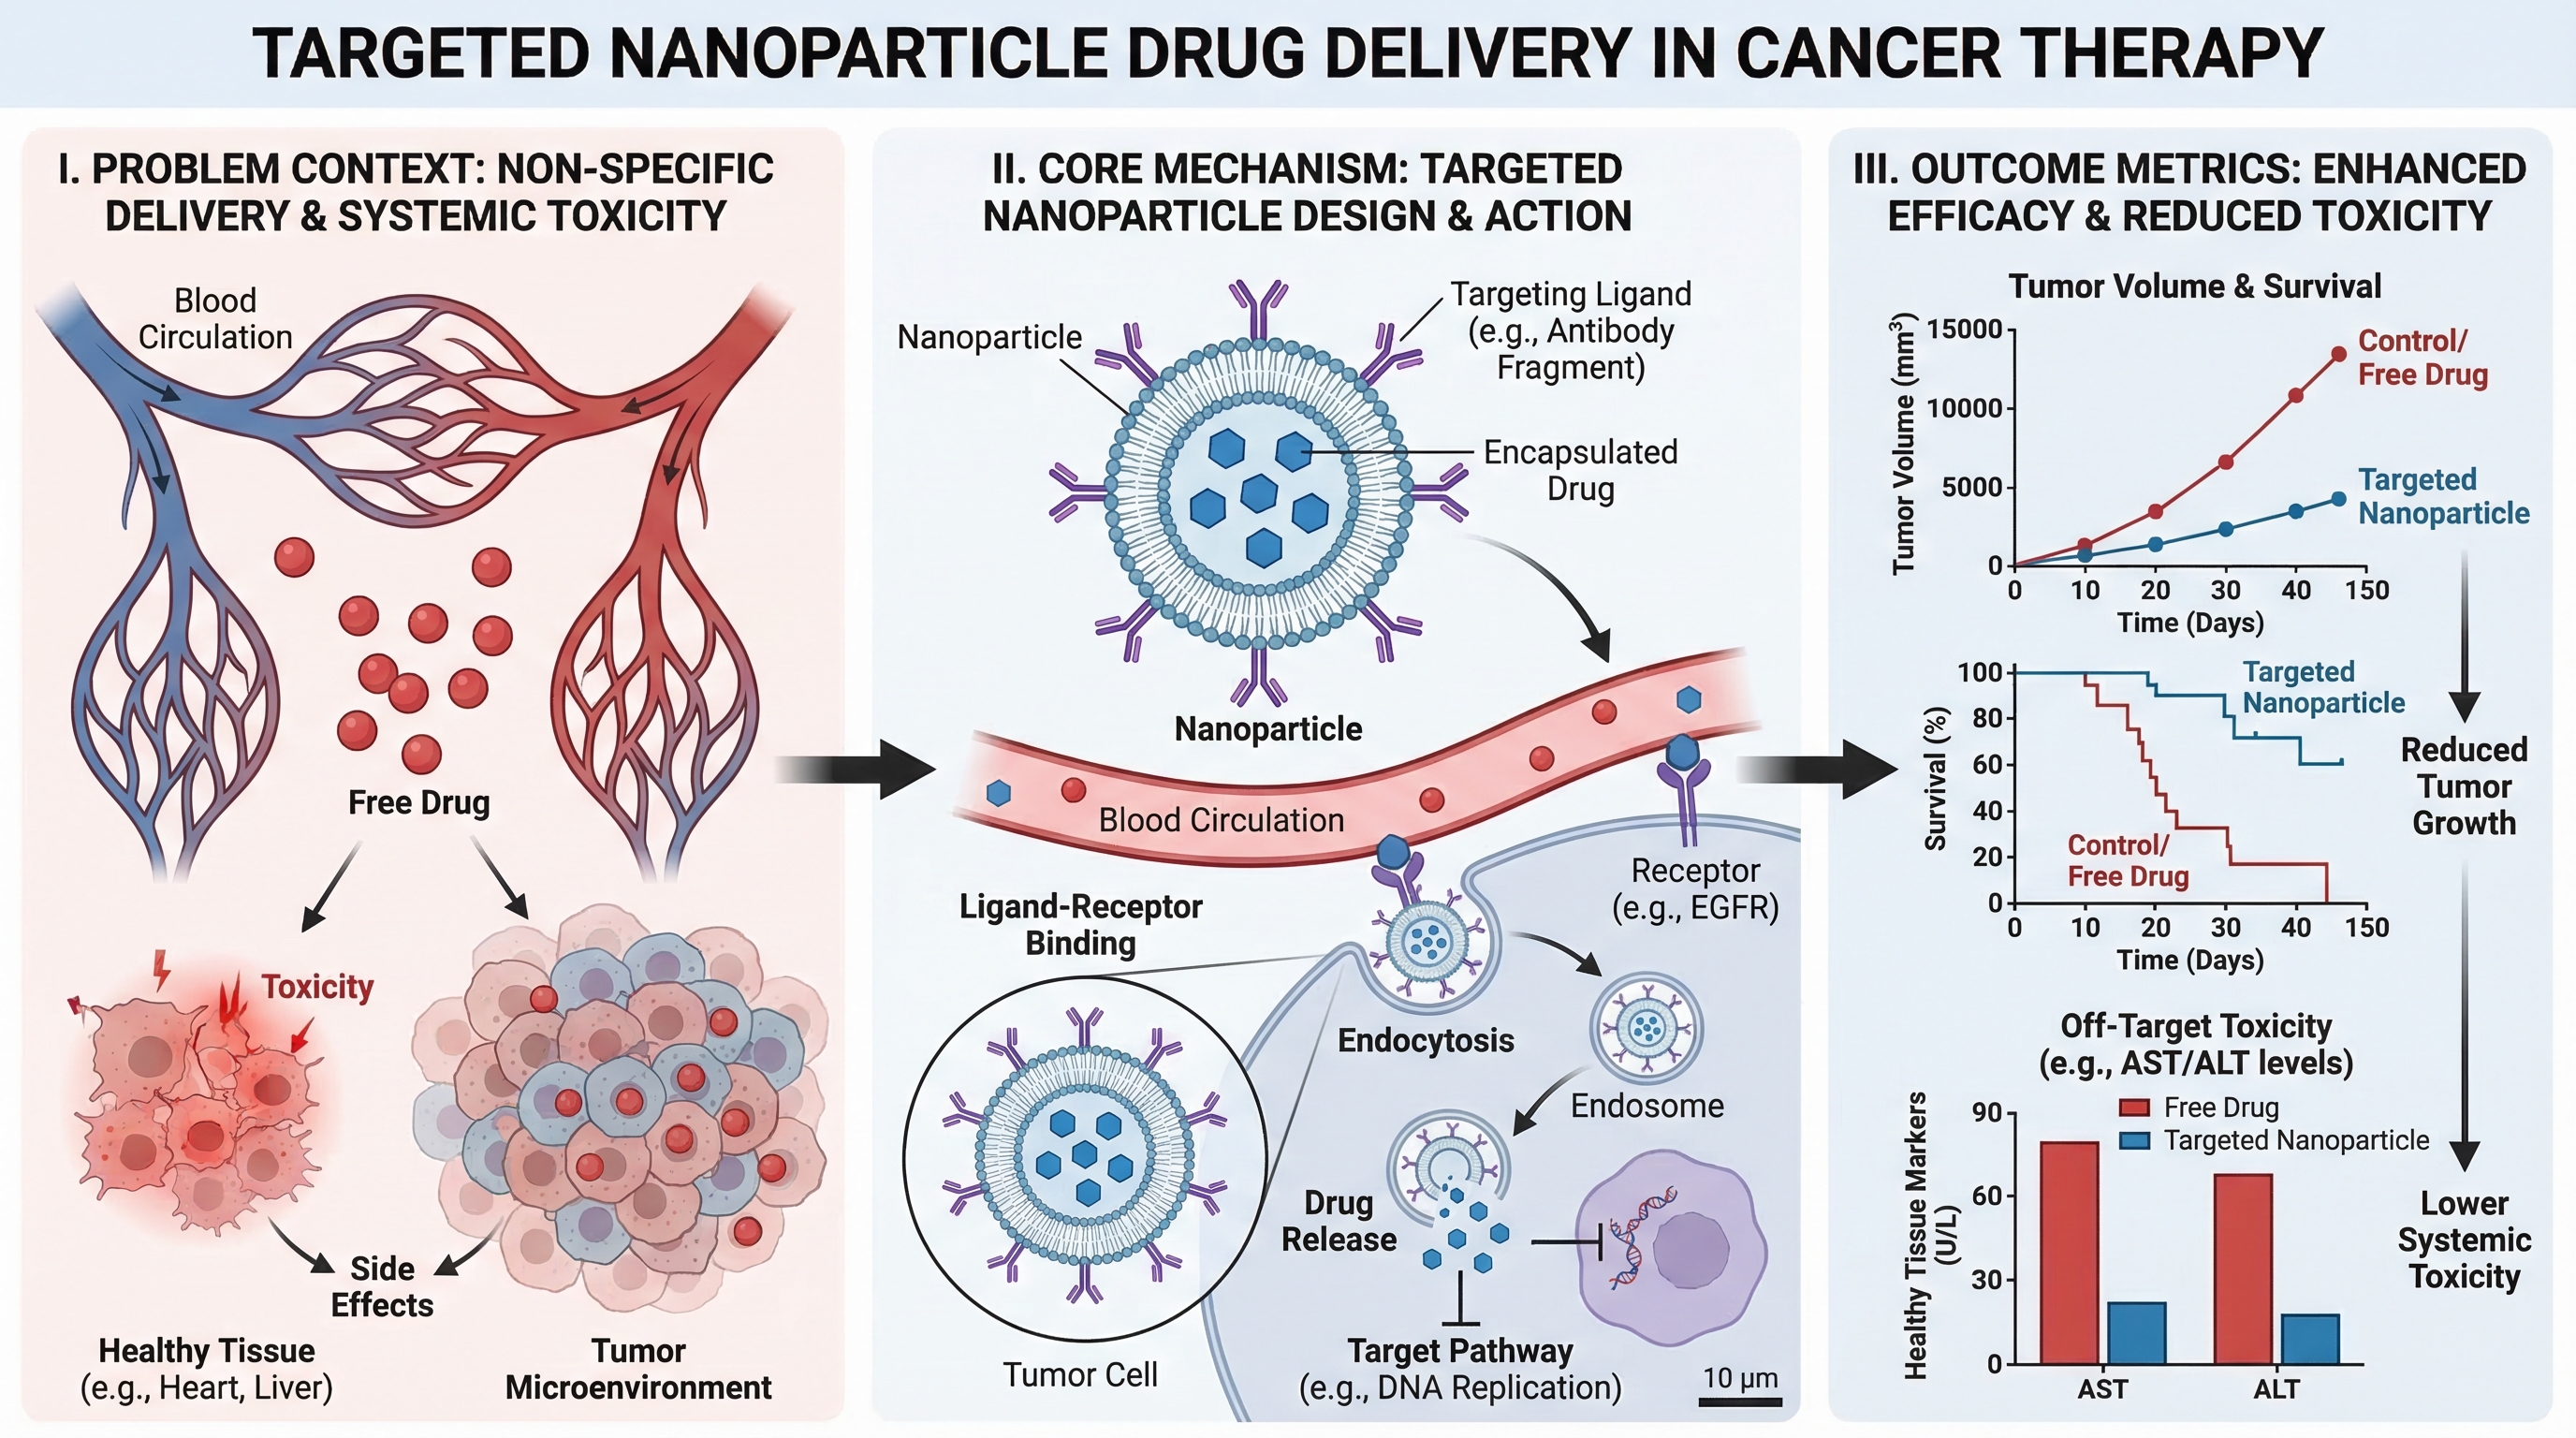
2) Mechanism Diagram (메커니즘 다이어그램)
분자, 세포 또는 시스템 수준에서 무언가가 "어떻게" 작동하는지 단계별로 설명해야 할 때 사용하세요.
적합한 용도:
- 논문의 메커니즘 섹션
- 연구비 지원 근거 도표
- 약물 작용 설명
Prompt template
Create a mechanism diagram for [process].
Show numbered causal steps from trigger to downstream effect.
Include key actors, arrows, inhibition/activation markers, and concise labels.
White background, textbook-level scientific clarity.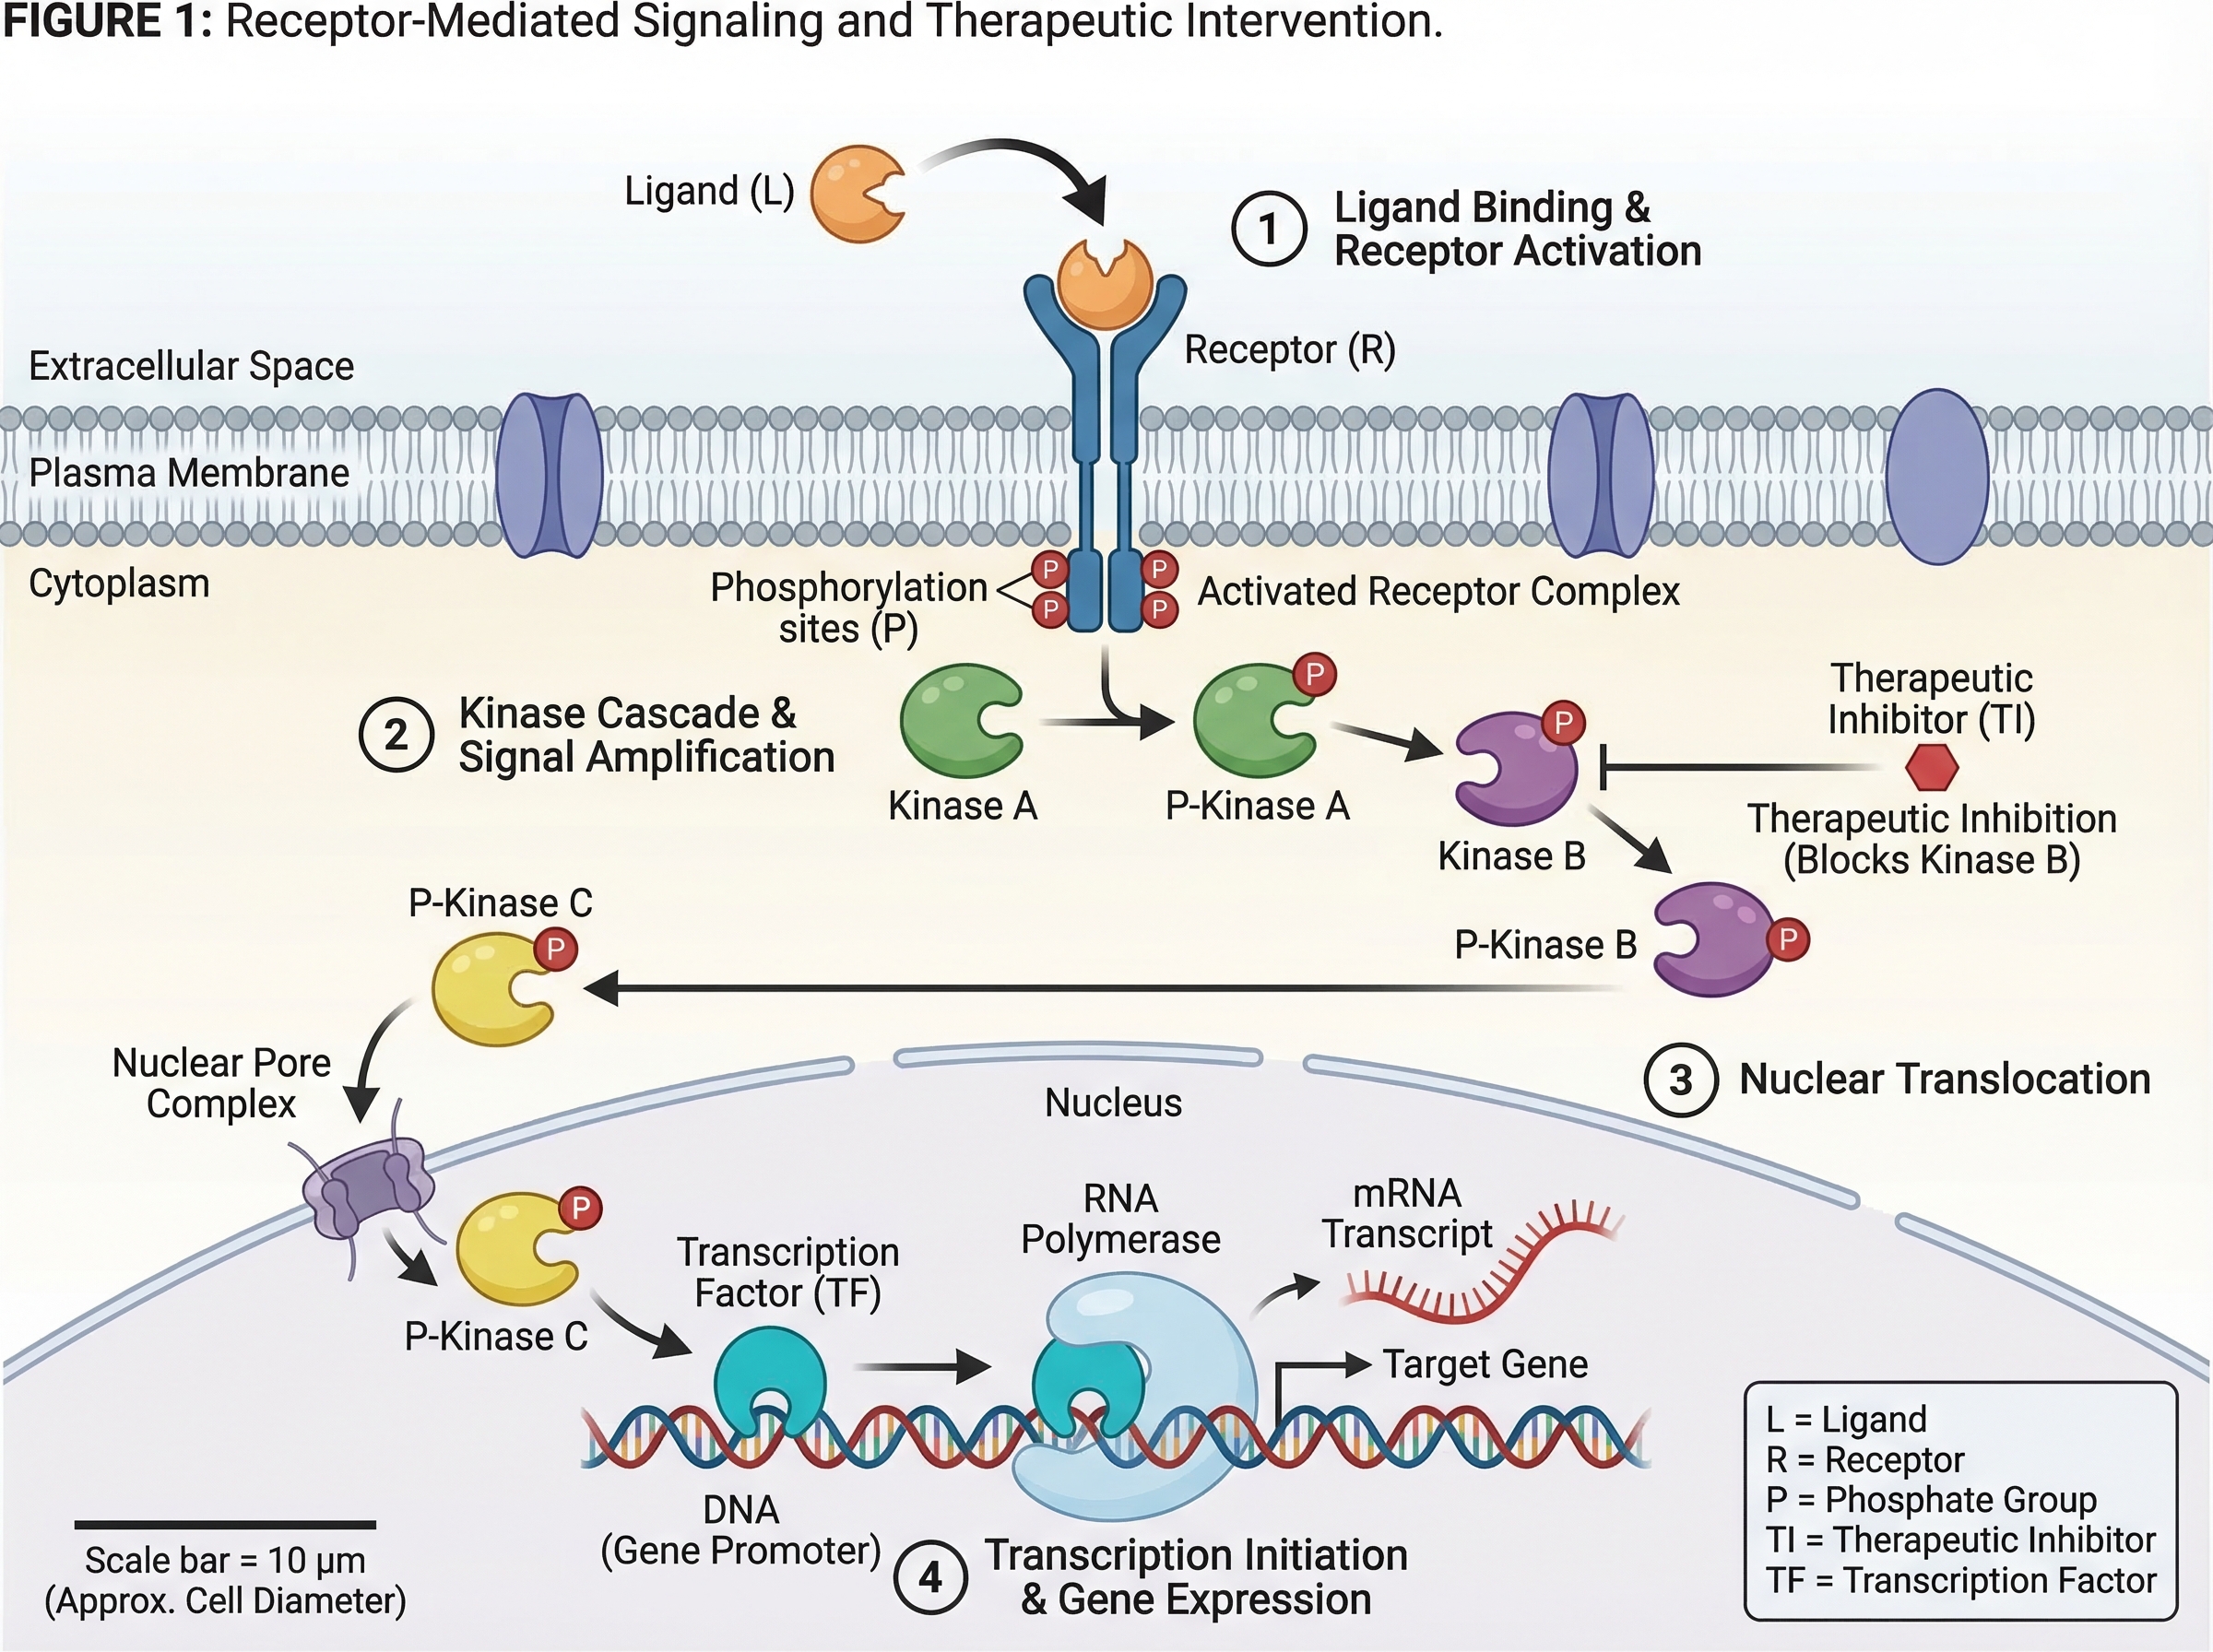
3) Pathway Diagram (패스웨이 다이어그램)
여러 생물학적 또는 기술적 경로에 걸친 분기 관계와 상호작용(crosstalk)을 보여줘야 할 때 사용하세요.
적합한 용도:
- 신호 전달 경로 요약
- 시스템 생물학 해석
- 다요인 인과 모델
Prompt template
Create a pathway diagram for [topic].
Map upstream inputs, branch nodes, cross-talk links, and final outputs.
Use color-coded branches, legend, and concise English labels.
High readability, publication-ready style.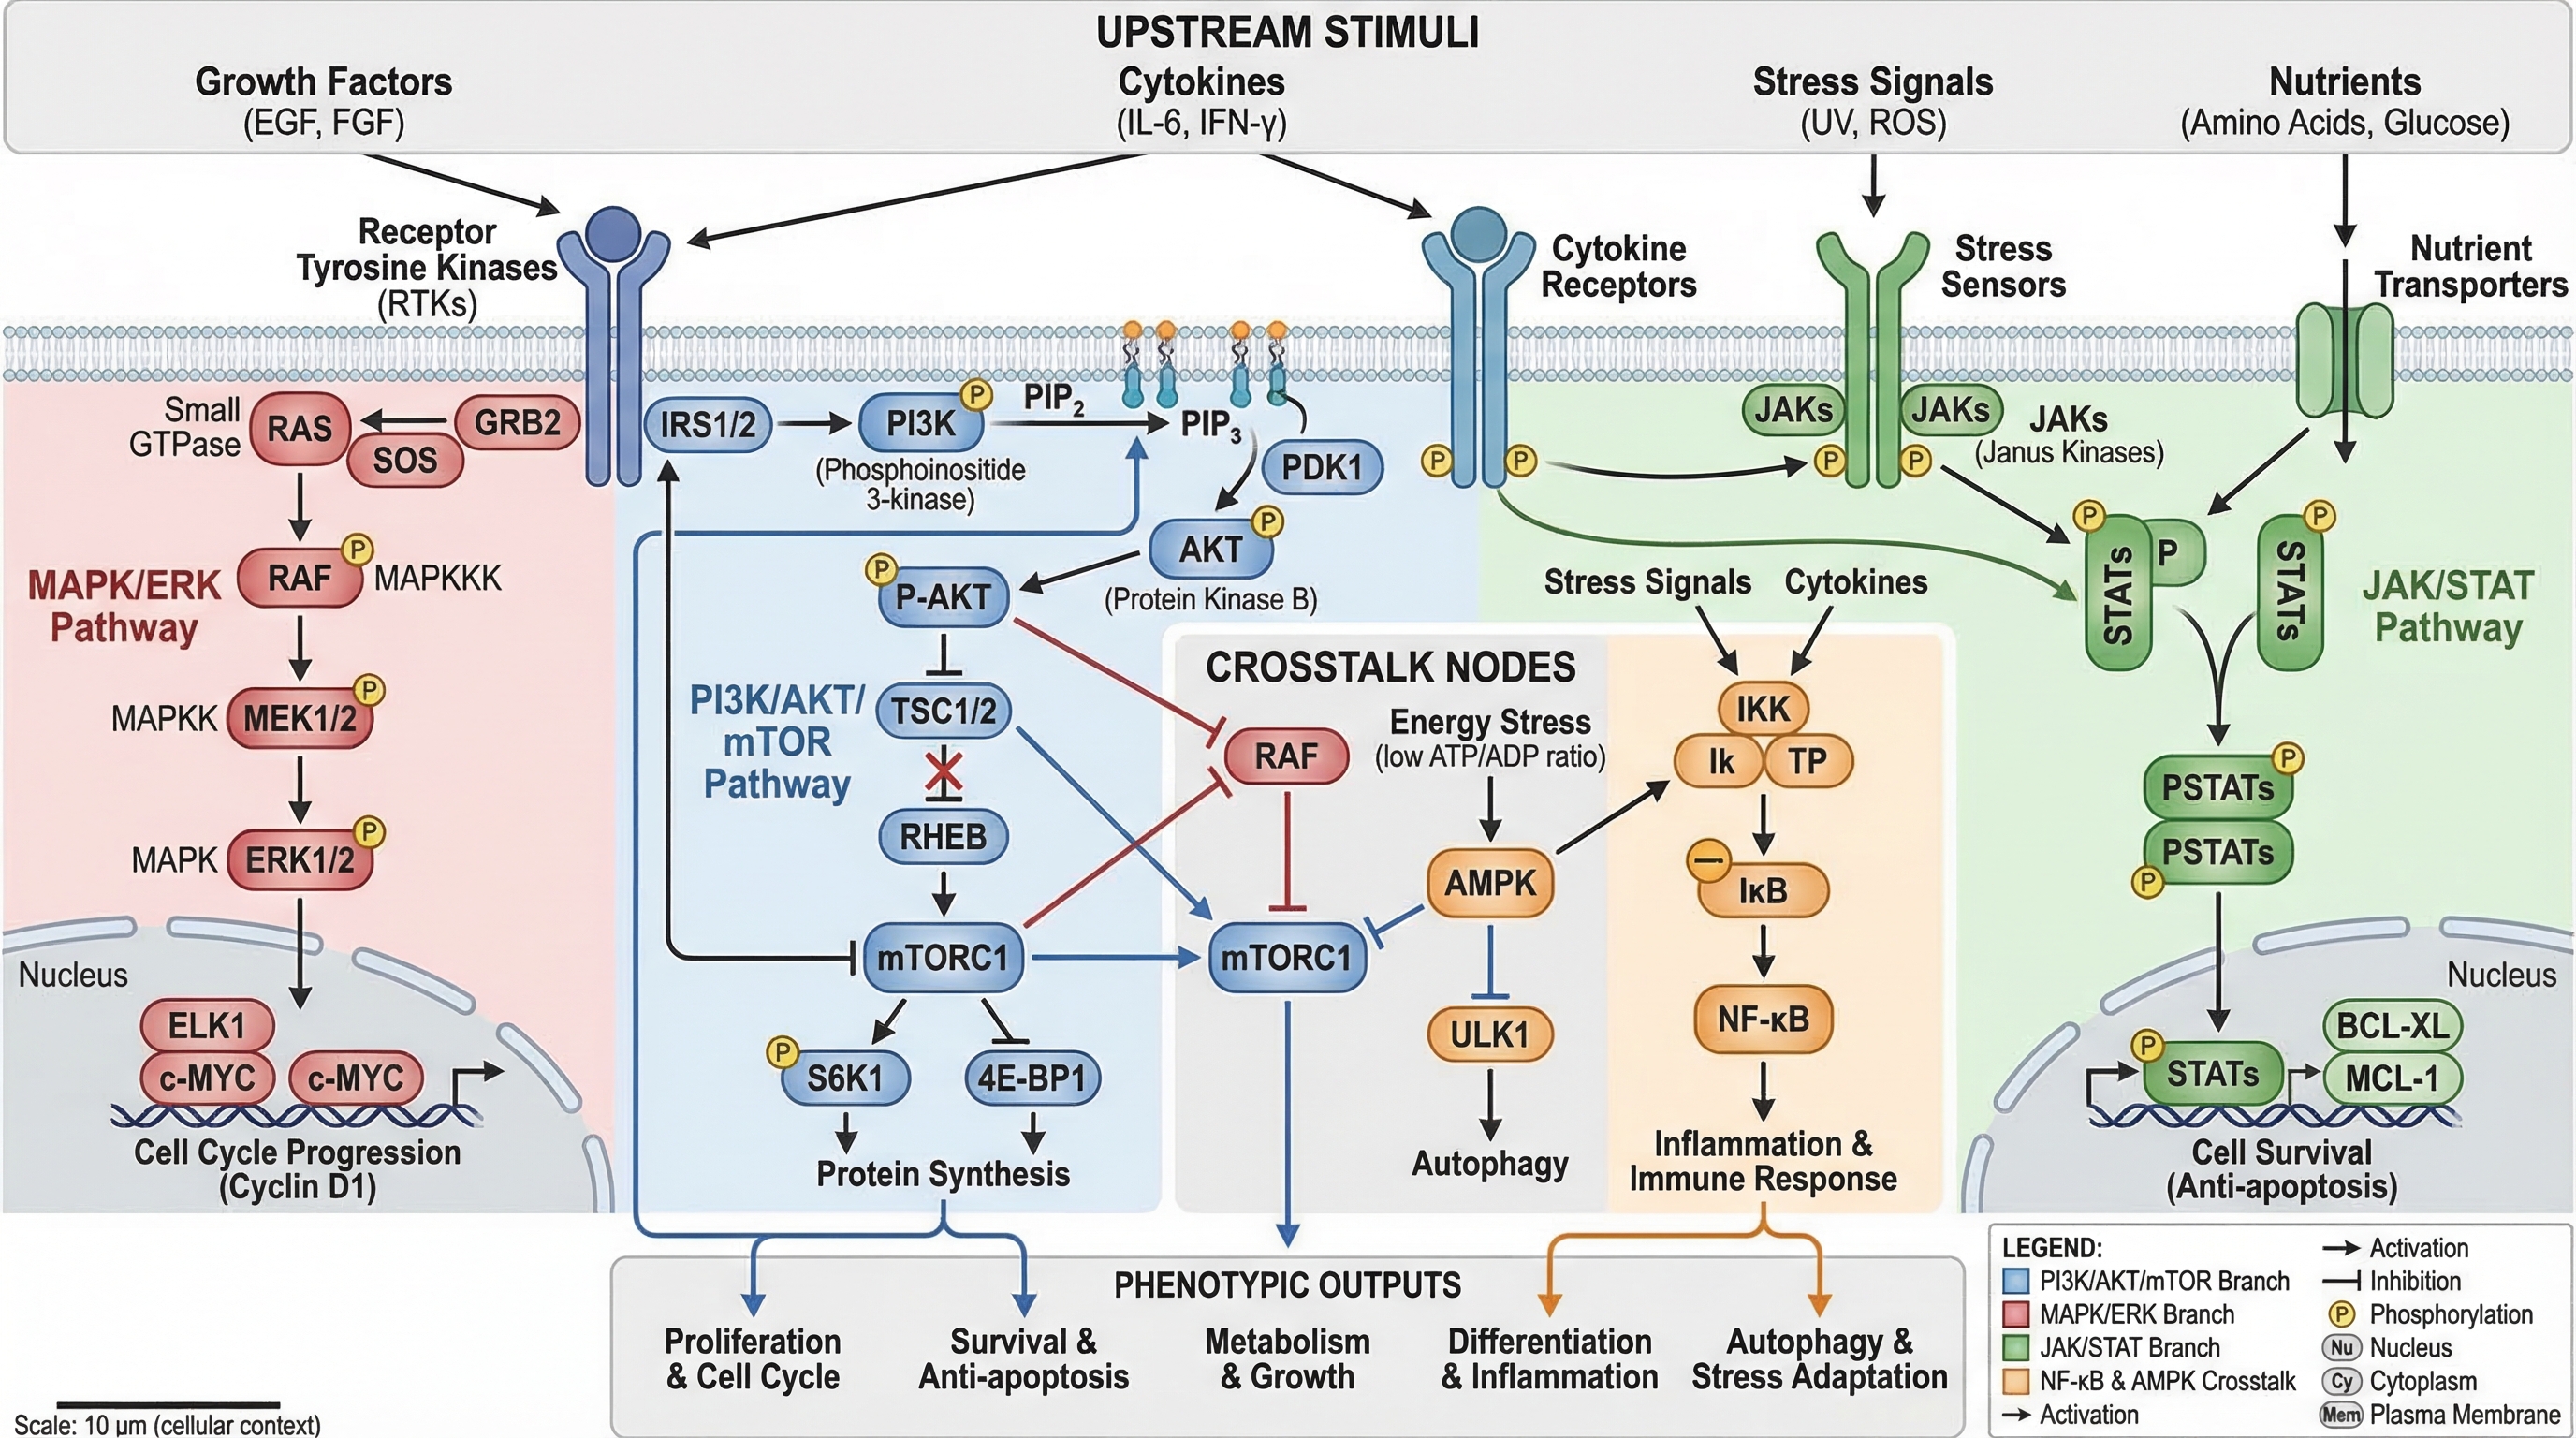
4) Workflow Diagram (워크플로우 다이어그램)
운영 순서(무엇이 먼저 일어나고, 다음에 무엇이 오며, 어떤 조건에서 발생하는지)를 보여줘야 할 때 사용하세요.
적합한 용도:
- 방법론(Methods) 섹션
- 표준 작업 절차(SOP) 문서화
- 재현성 및 교육
Prompt template
Create a workflow diagram for [process].
Show end-to-end steps from input to output, with decision nodes and checkpoints.
Include artifacts produced at each stage and concise labels.
Clean white background, process-centric layout.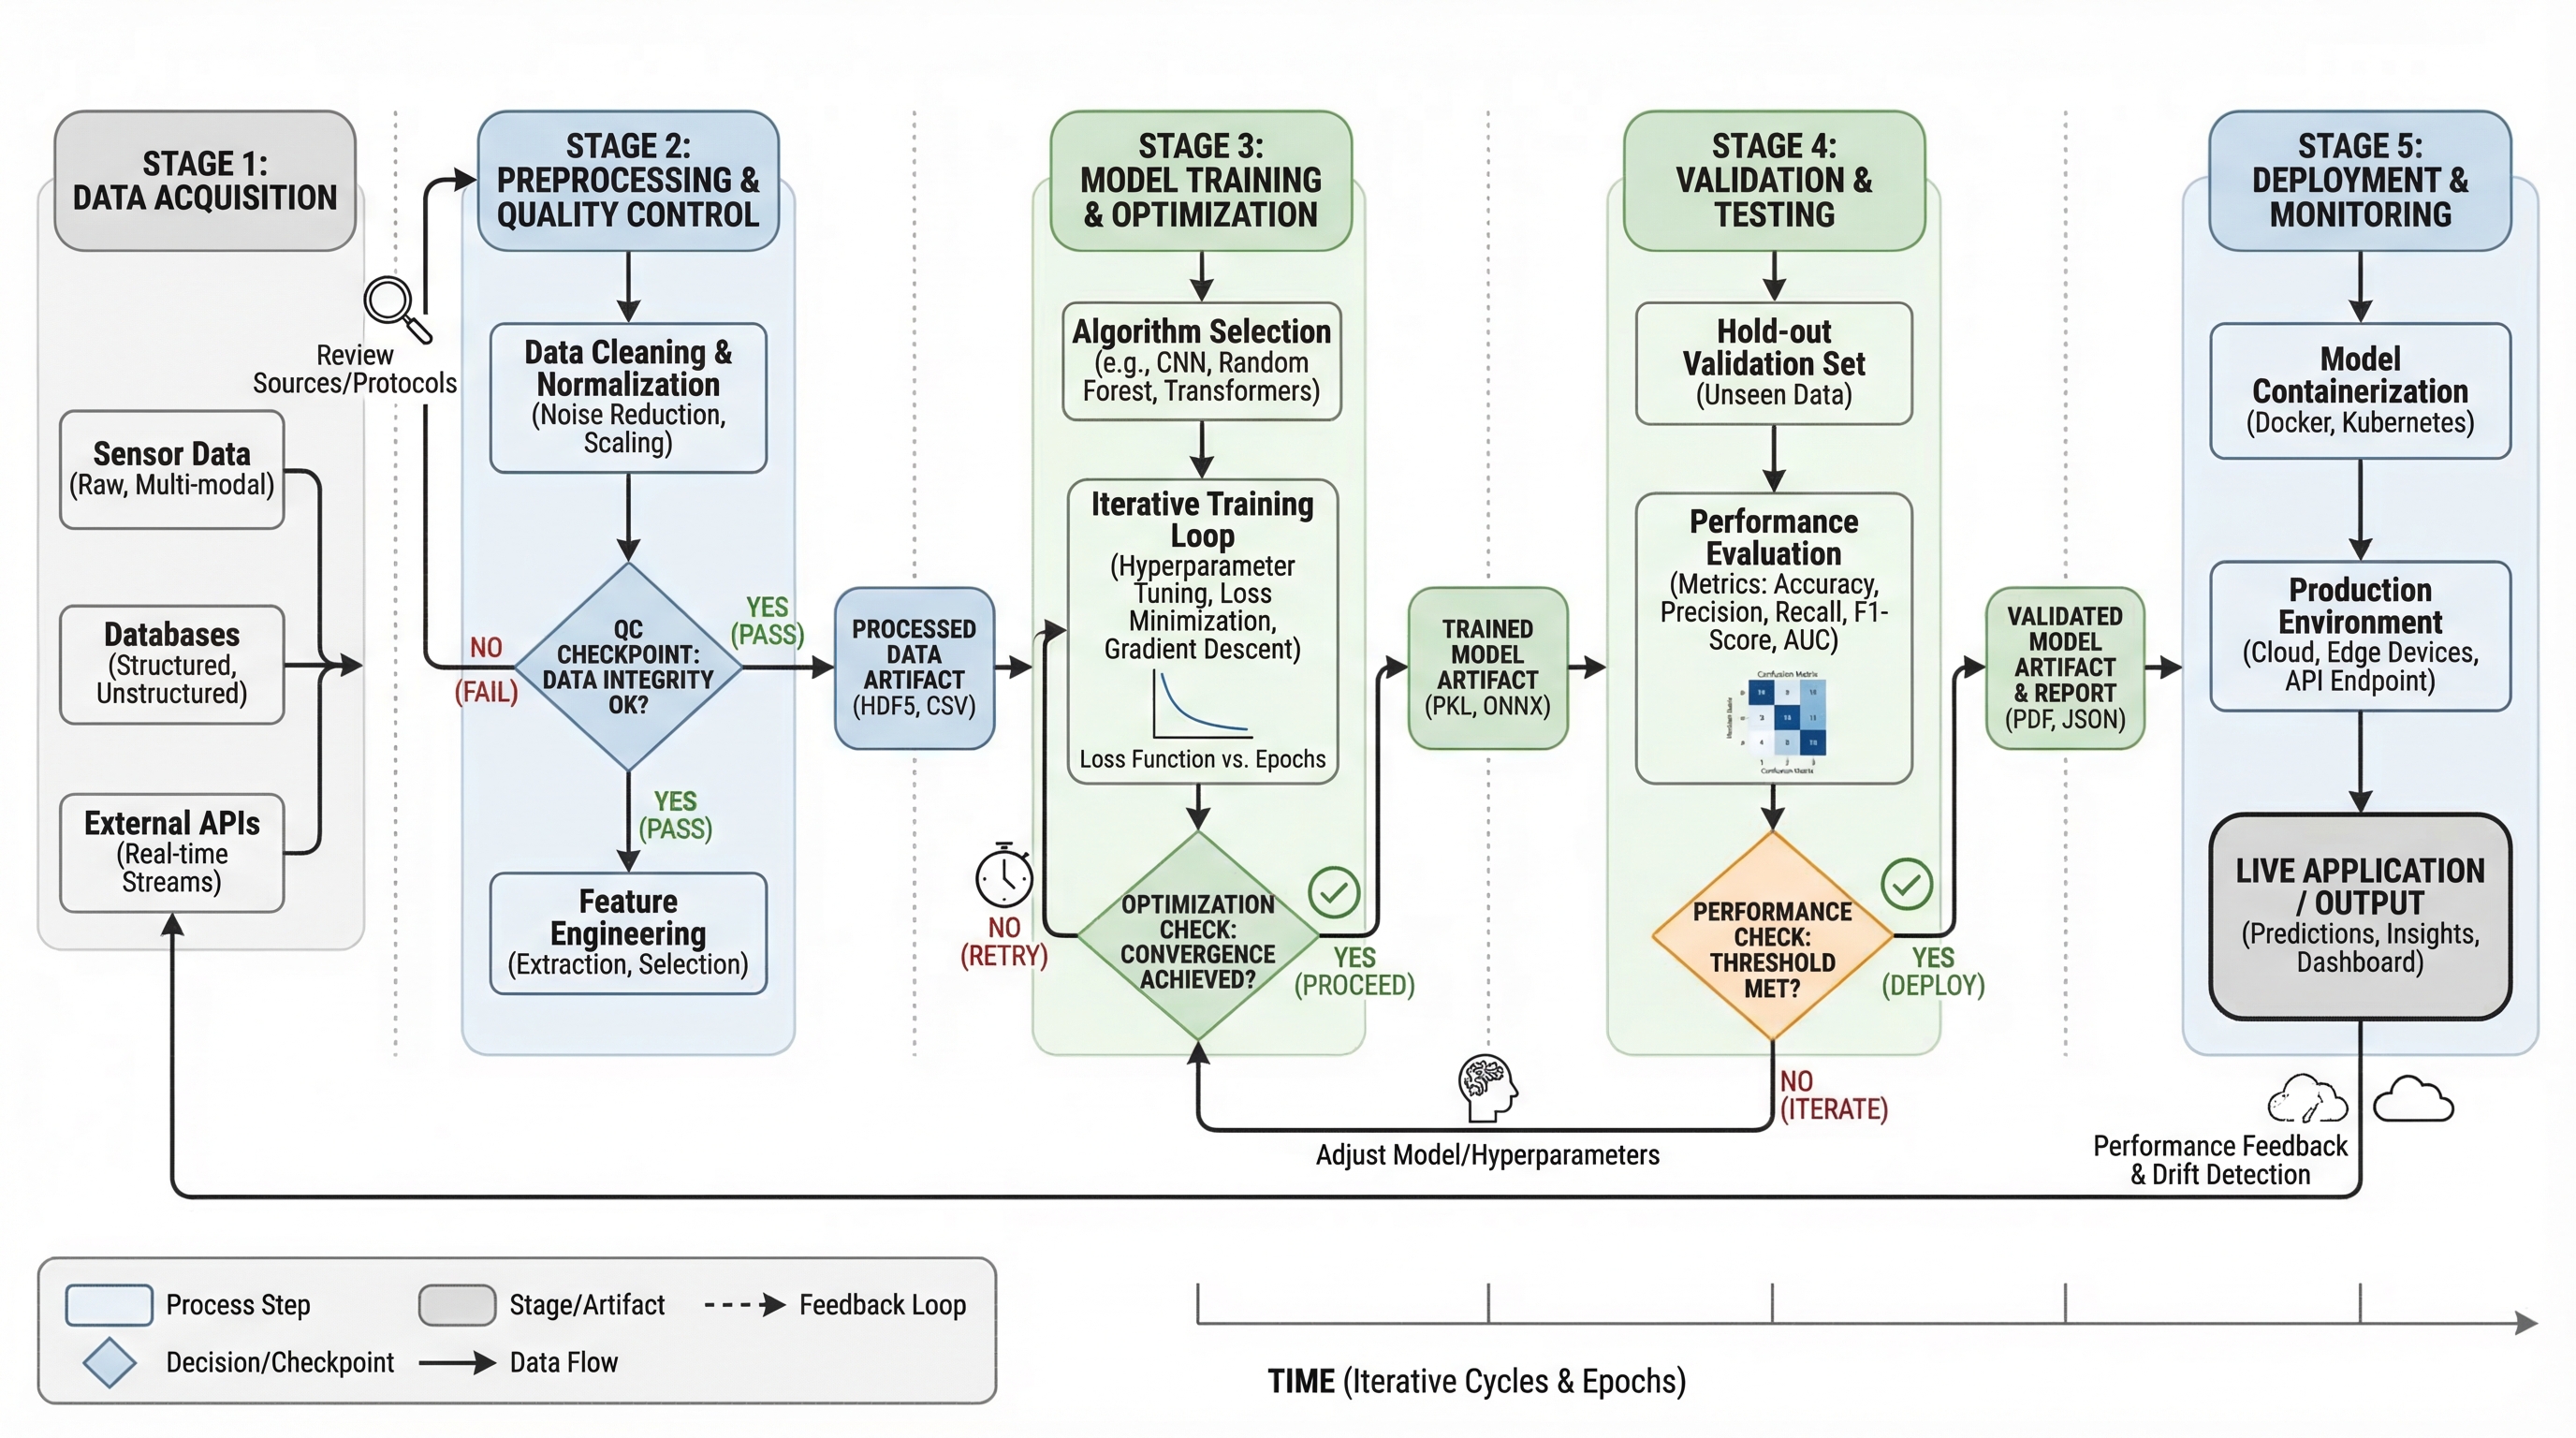
5) Architecture Diagram (아키텍처 다이어그램)
시간 순서에 따른 단계 대신 시스템 구조와 구성 요소 간의 상호작용을 보여줘야 할 때 사용하세요.
적합한 용도:
- 플랫폼 문서화
- AI/ML 시스템 커뮤니케이션
- 제안서 및 기술 설계 검토
Prompt template
Create a system architecture diagram for [platform].
Use layered structure (data, service, model, application).
Show key modules, interfaces, and data/control flows.
Concise labels, modern technical style, white background.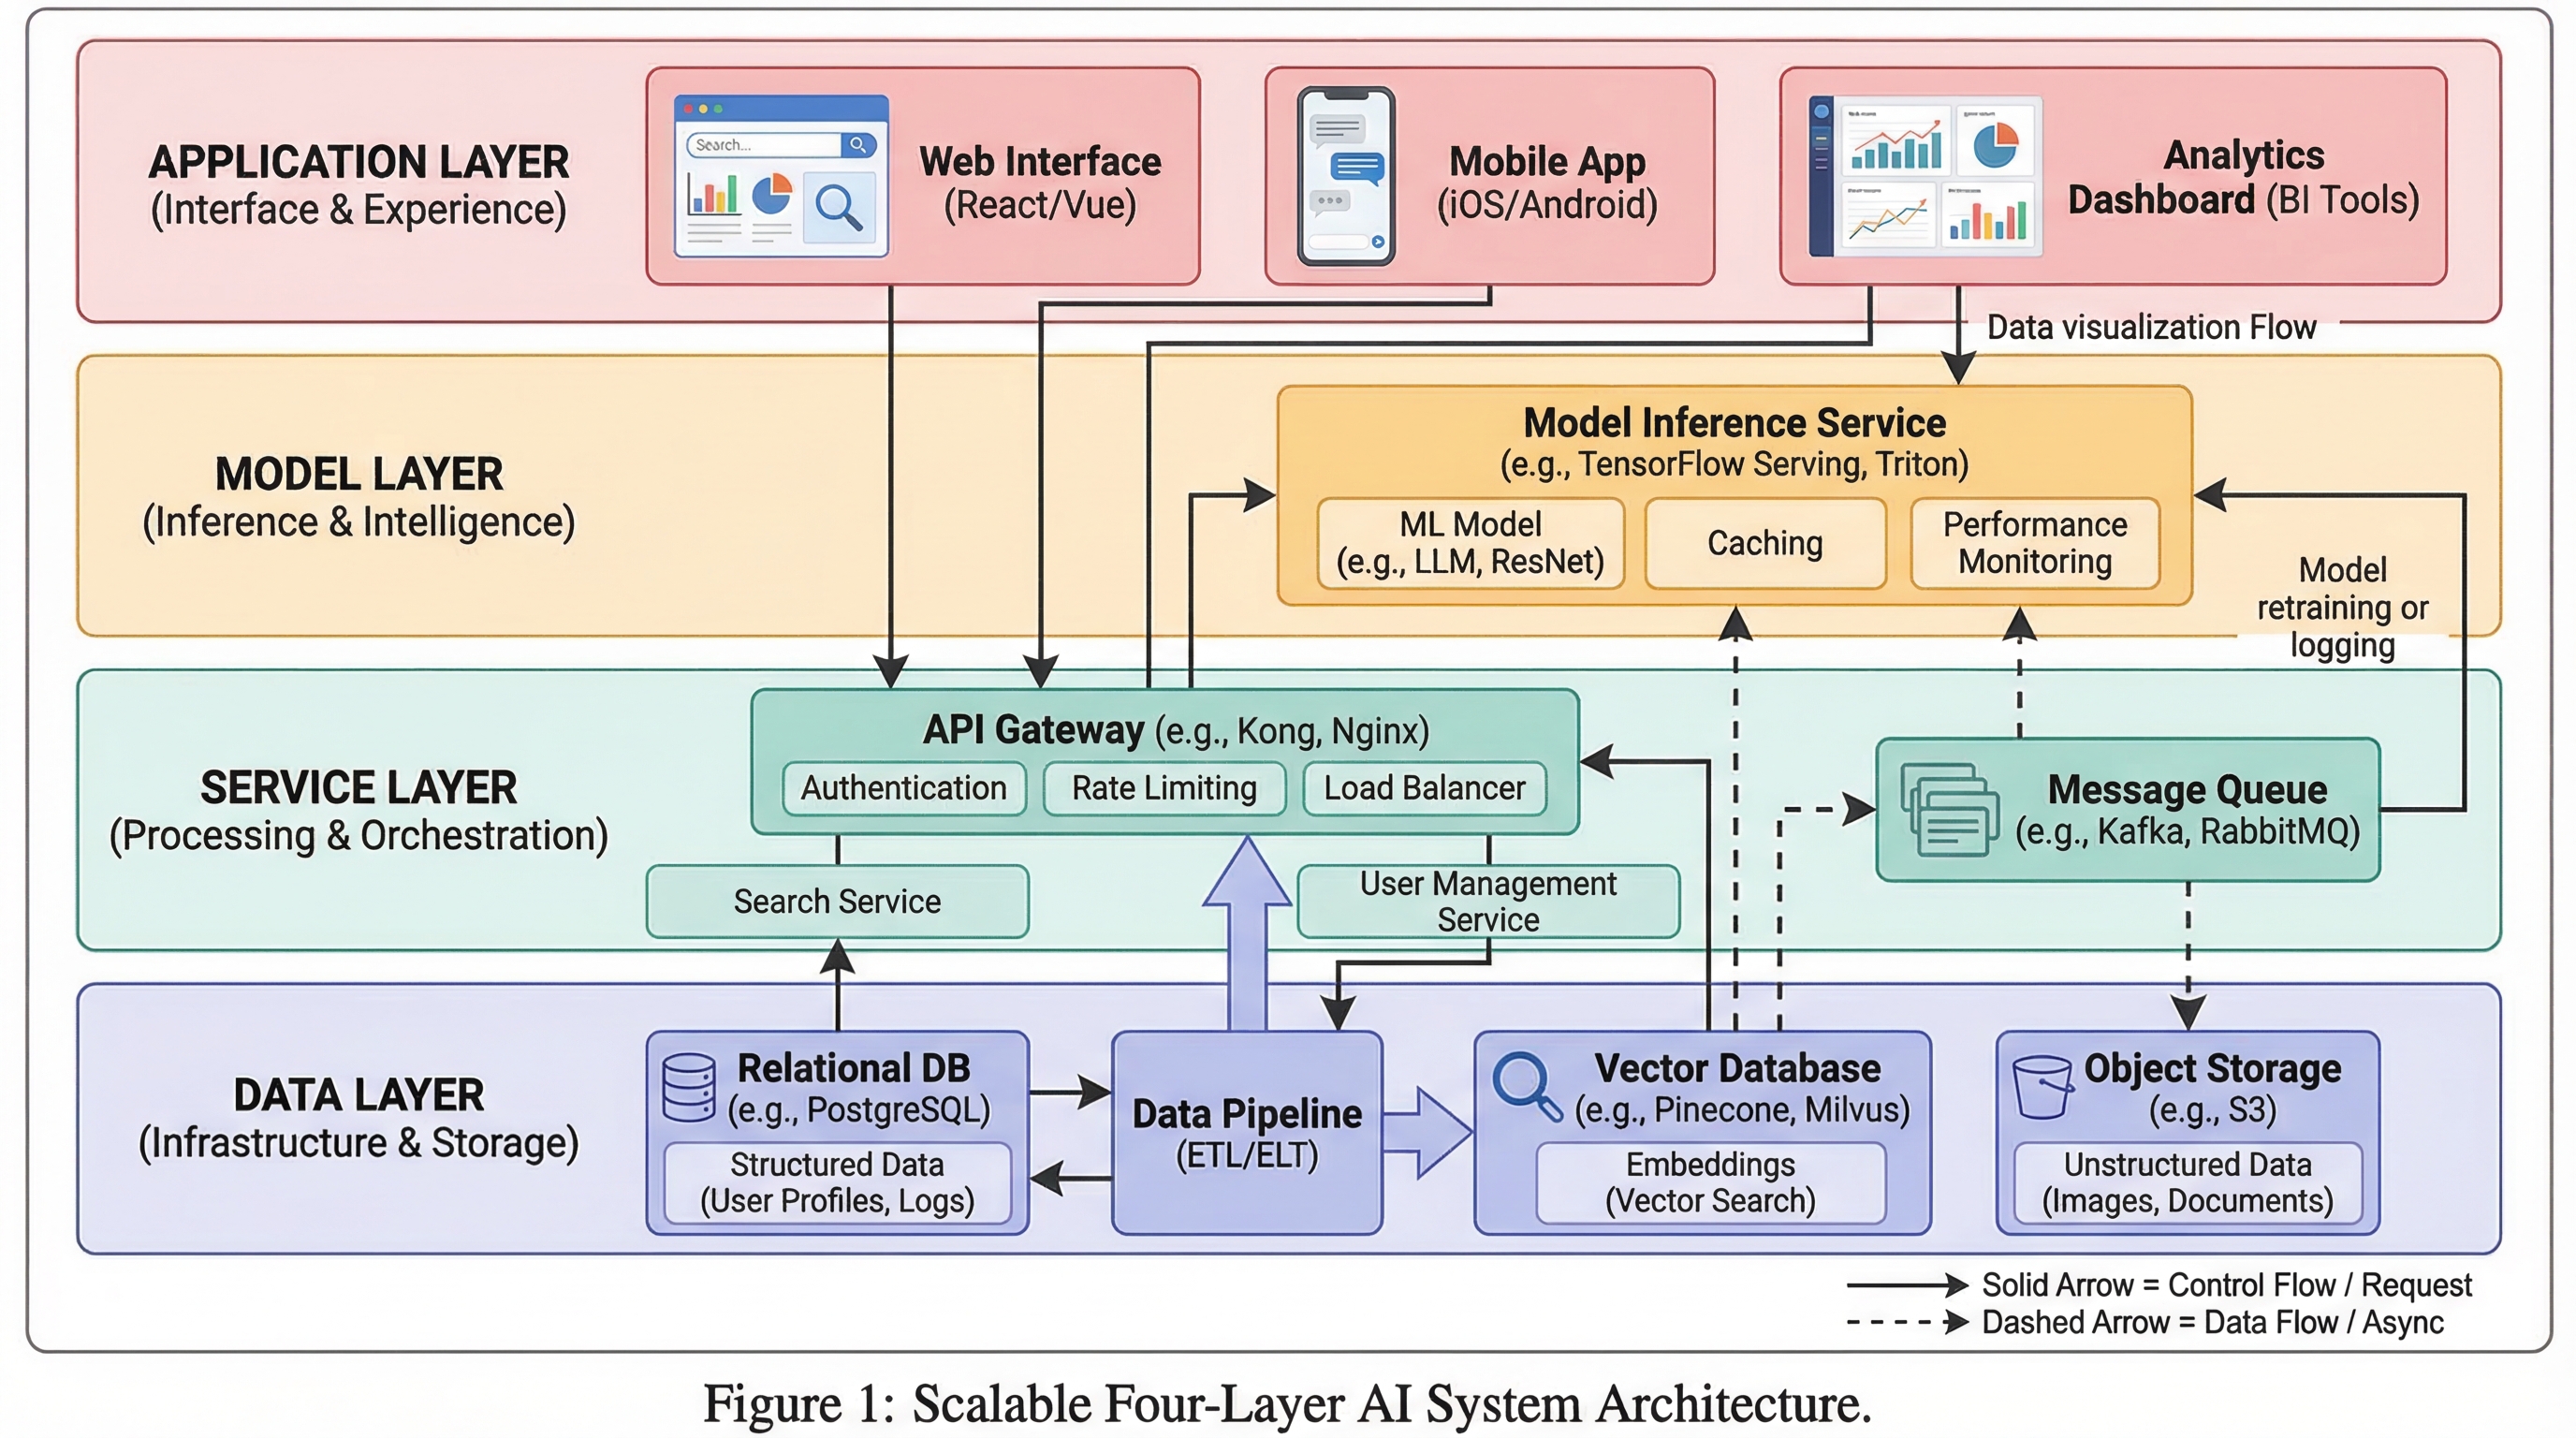
6) Comparison Figure (비교 도표)
핵심 메시지가 차이점(기존 vs 신규, 기준선 vs 개선됨, 방법 A vs 방법 B)일 때 사용하세요.
적합한 용도:
- 절제 연구(ablation)/결과 설명
- 심사위원 대상 명확성 확보
- 의사 결정 지원 슬라이드
Prompt template
Create a comparison figure for [A] vs [B].
Two-column aligned layout with matched dimensions.
Include key metrics, strengths/limitations, and callout arrows.
Clean white background, objective scientific presentation style.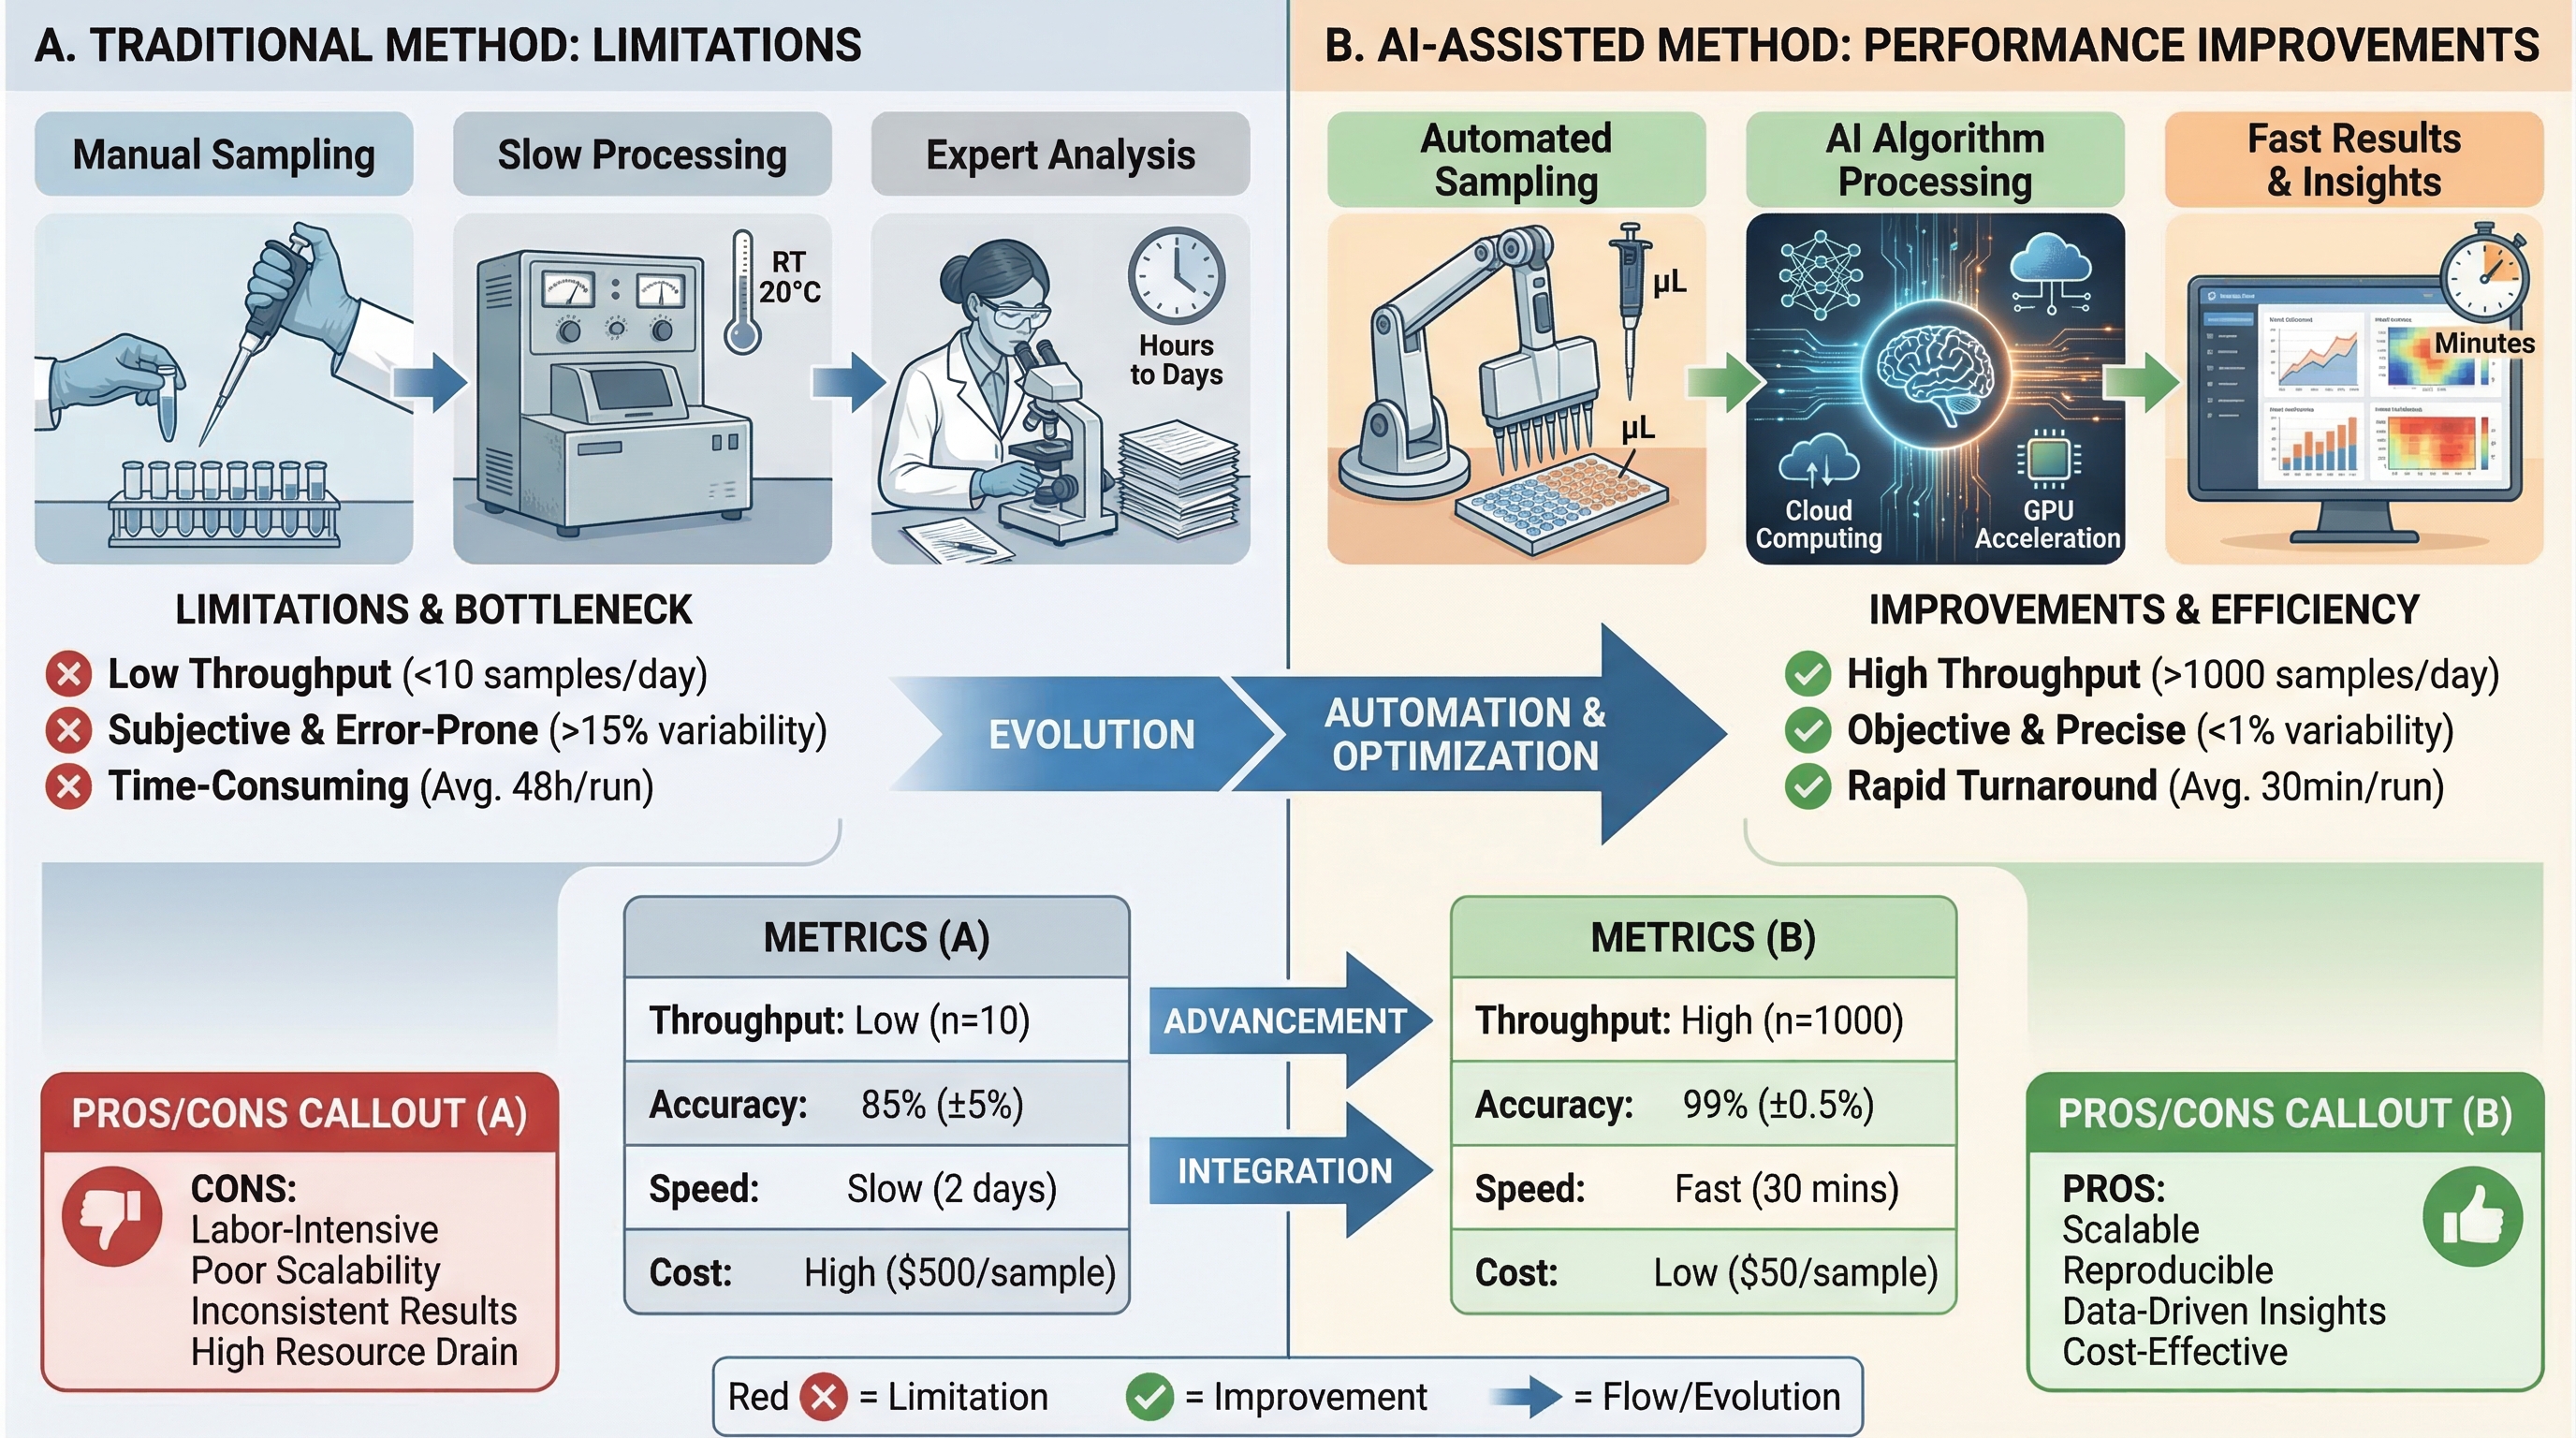
7) Infographic (인포그래픽)
비전문가 독자를 위한 고수준의 종합 정보나 빠른 의사 결정 커뮤니케이션이 필요할 때 사용하세요.
적합한 용도:
- 요약 보고서(Executive summary)
- 컨퍼런스 포스터 스니펫
- 부서 간 팀 업데이트
Prompt template
Create a scientific infographic for [topic].
Include key metric cards, trend summary, category breakdown, and takeaways.
Use icon-supported sections, concise English labels, and strong visual hierarchy.
Readable at presentation distance, white background.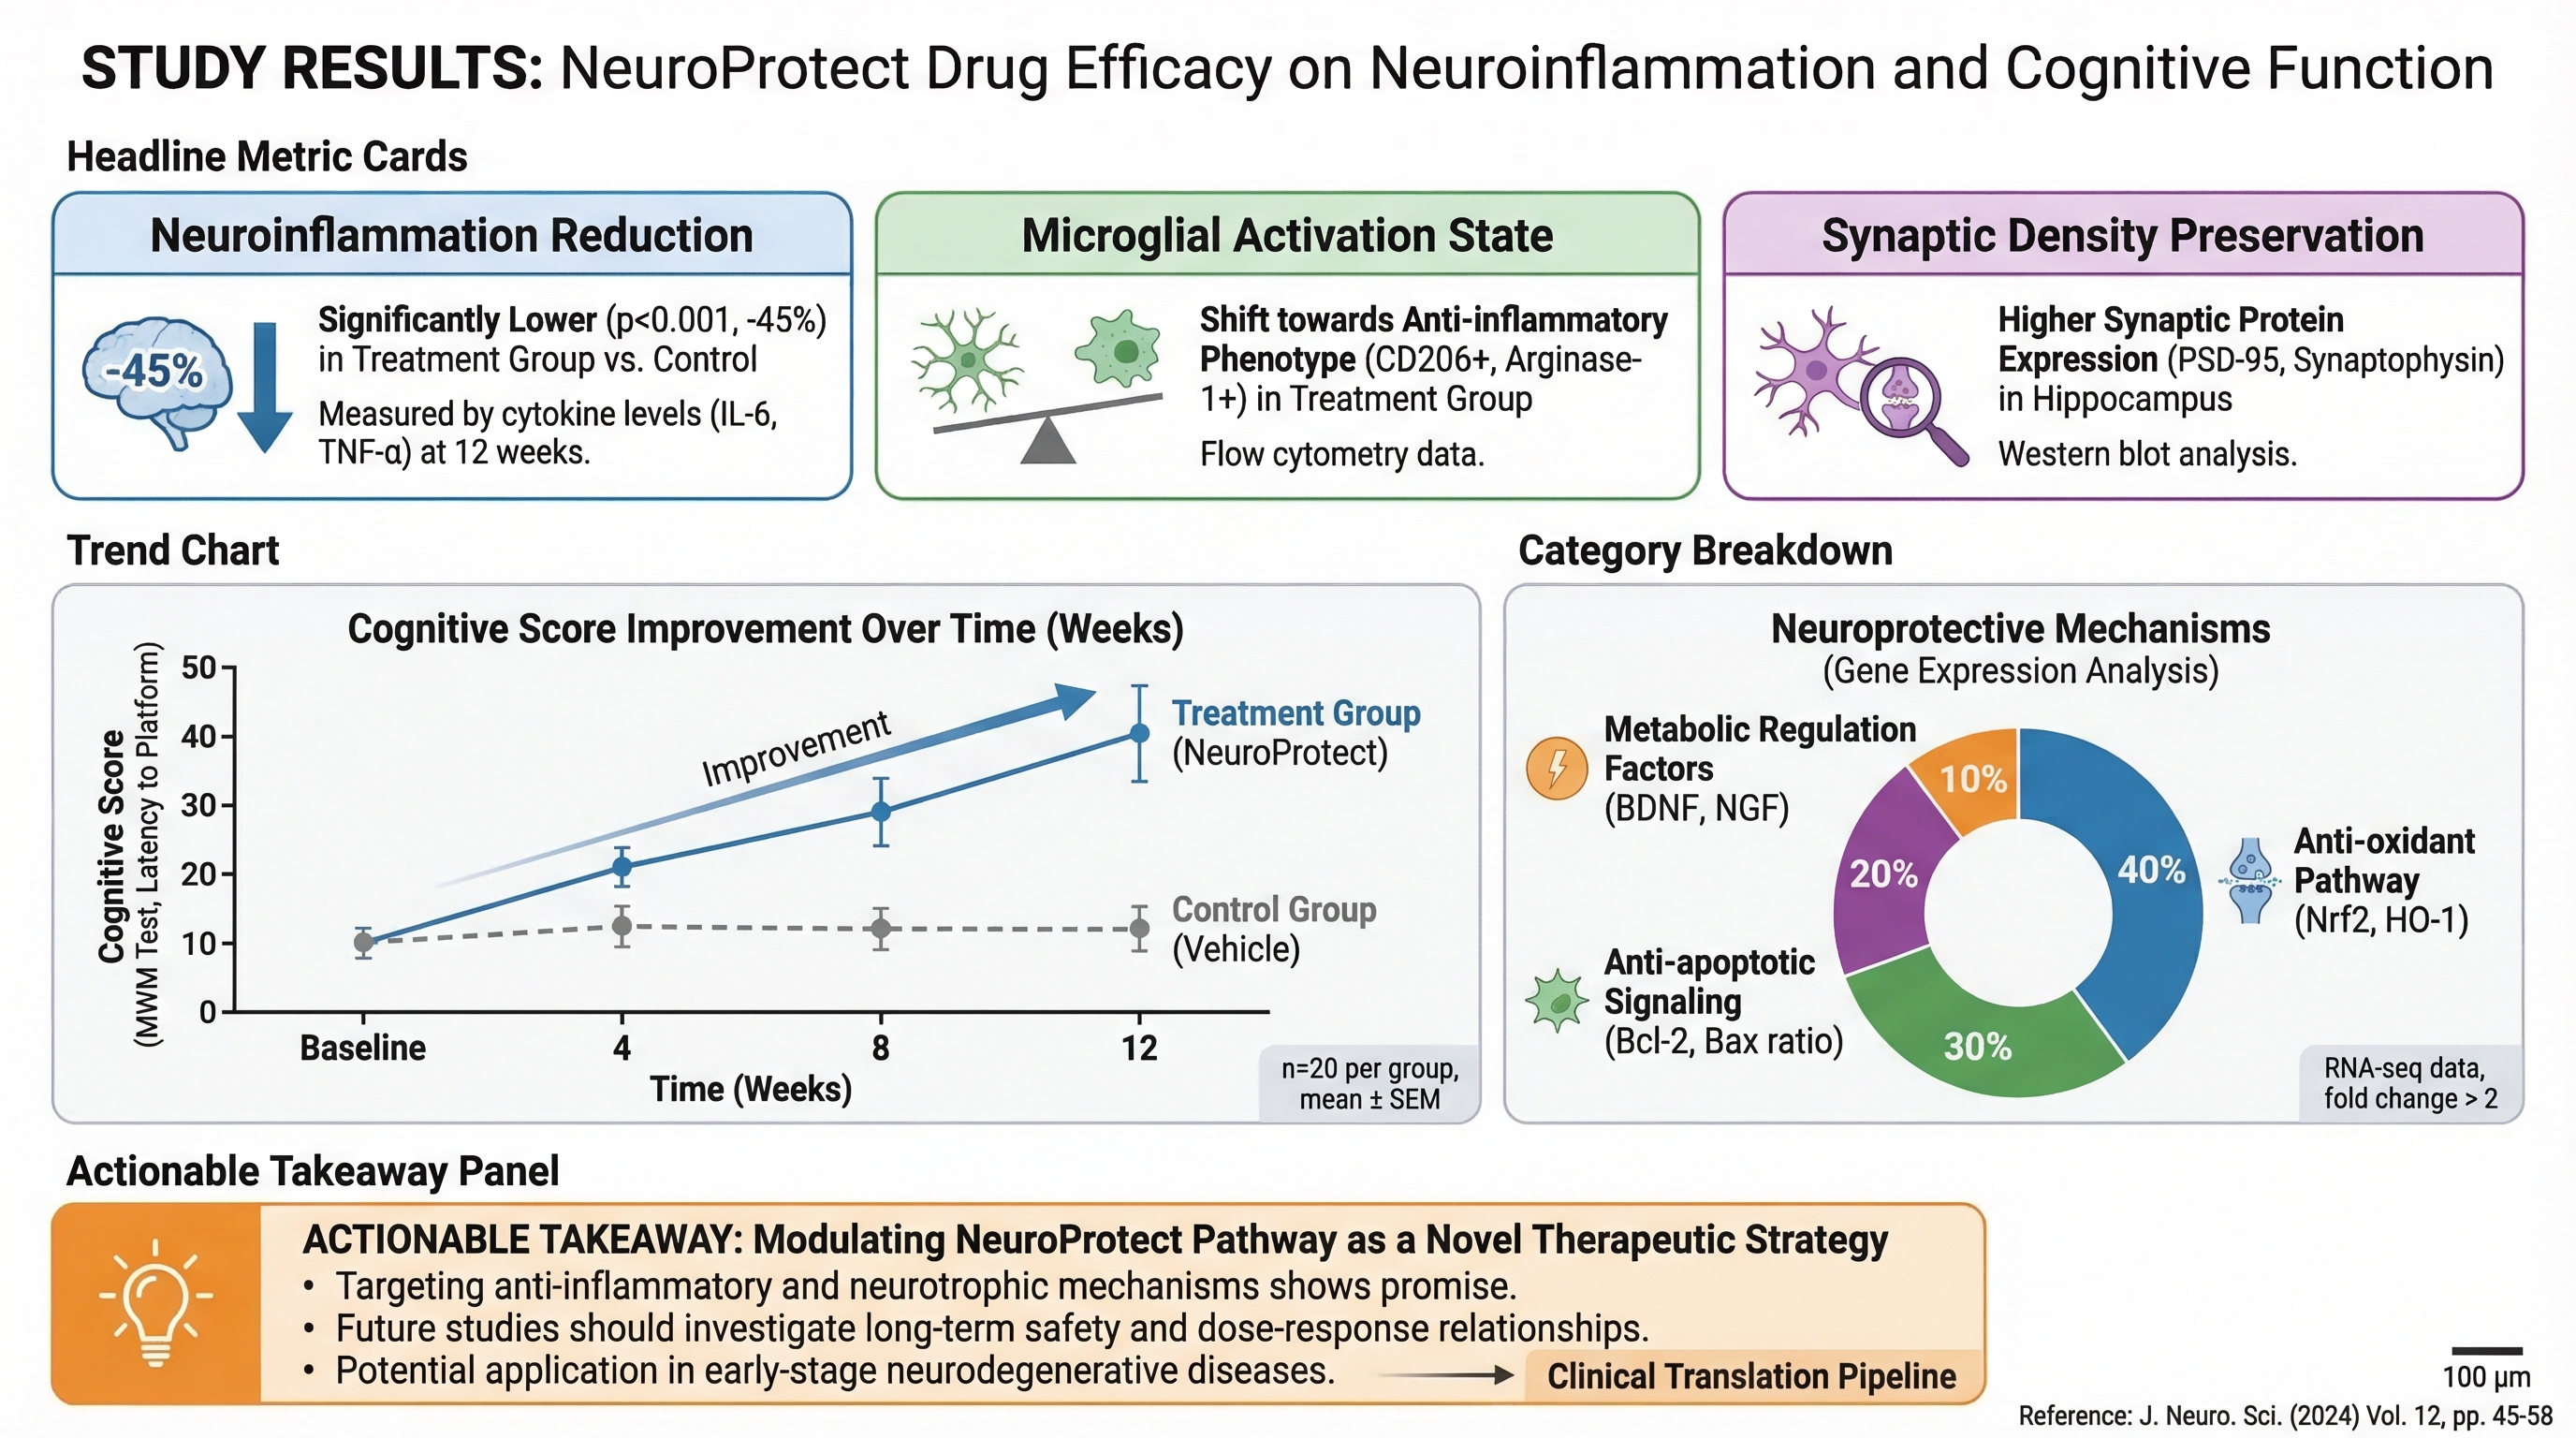
빠른 선택 규칙
가장 중요한 질문이 다음과 같다면:
- "전체 이야기가 무엇인가?" → Graphical Abstract
- "어떻게 작동하는가?" → Mechanism
- "분기들이 어떻게 상호작용하는가?" → Pathway
- "프로세스 순서가 어떻게 되는가?" → Workflow
- "시스템이 어떻게 구축되었는가?" → Architecture
- "무엇이 더 나은가/다른가?" → Comparison
- "사람들이 무엇을 빨리 기억해야 하는가?" → Infographic
먼저 올바른 유형을 선택한 다음 스타일을 최적화하세요. 이것만으로도 색상을 수정하는 것보다 그림의 명확성을 훨씬 더 높일 수 있습니다.
관련 도구
- 워크플로우 다이어그램 생성기 — AI로 워크플로우 다이어그램 생성
- 메커니즘 도표 생성기 — AI로 메커니즘 및 경로 도표 생성
- 모식도 생성기 — AI로 실험 모식도 생성
- AI 아키텍처 다이어그램 생성기 — AI로 시스템 아키텍처 도표 생성
- 세포 일러스트레이션 생성기 — AI로 세포생물학 일러스트 생성
- 재료과학 도표 생성기 — AI로 재료과학 도표 생성
- 임상 일러스트레이션 생성기 — AI로 의학 및 임상 일러스트 생성
- 그래피컬 초록 제작 도구 — AI로 비주얼 초록 생성


