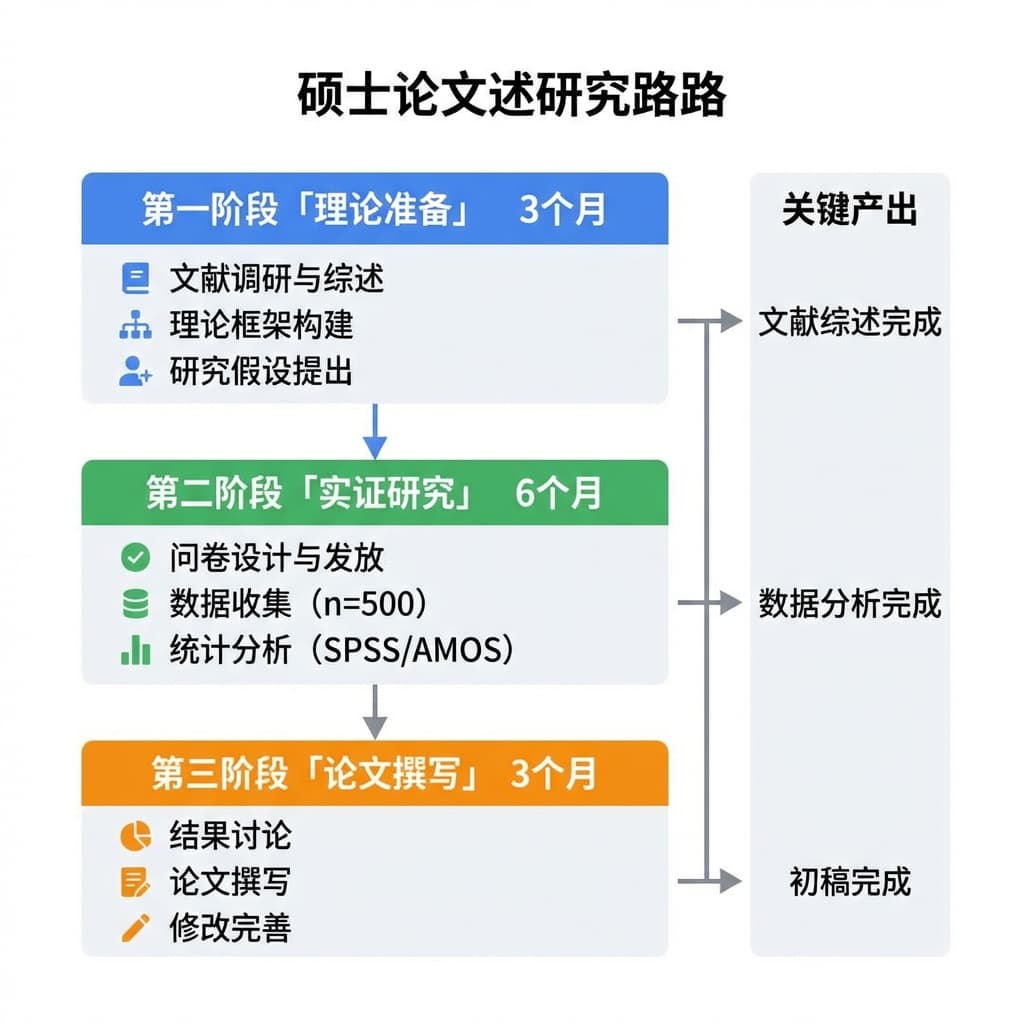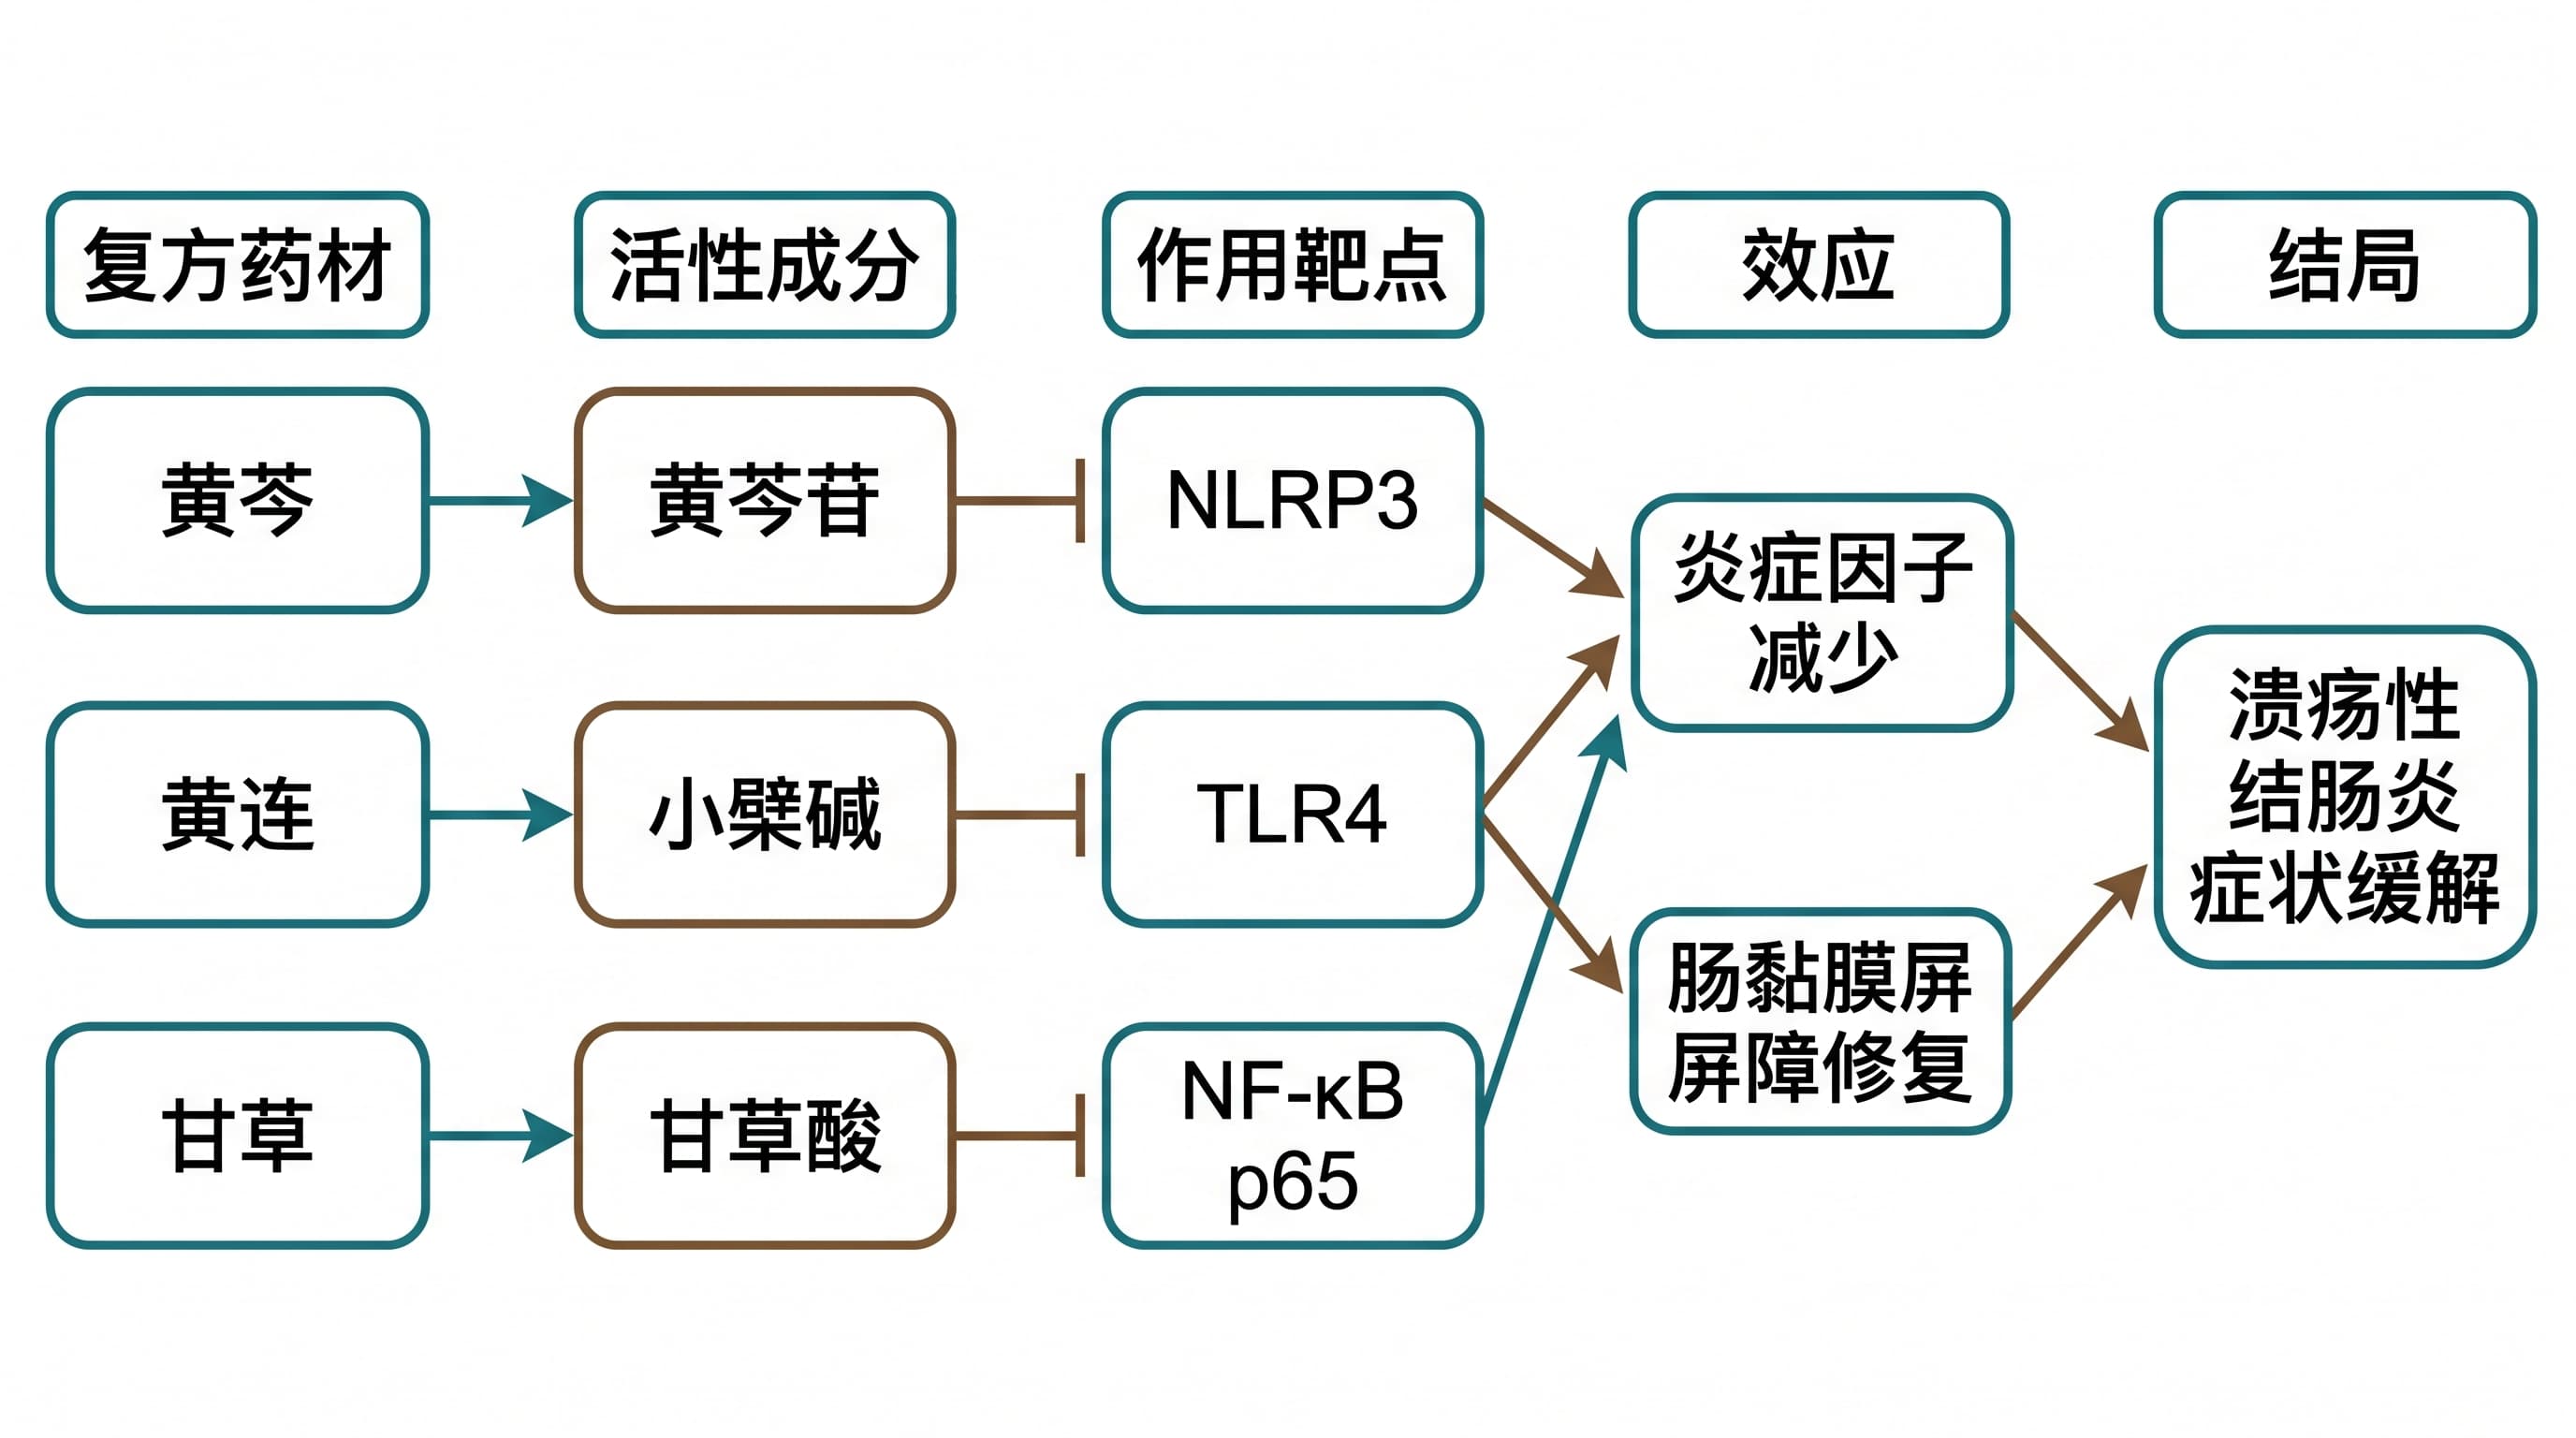
💡 SciDraw AI Advantage: AI Generation → SVG Vector Export → Free Editing in PPT/AI. Try Now →
Introduction: Why Do Grant Applications Need Professional Diagrams?
In major research grant applications such as the National Natural Science Foundation of China (NSFC), National Social Science Foundation of China (NSSFC), and Ministry of Education Humanities and Social Sciences Fund, high-quality scientific diagrams are often a key factor in determining success.
Reviewers need to read numerous proposals in a short time. A clear, professional technical roadmap or research framework can:
- Quickly convey research ideas: Help reviewers understand your research design within seconds
- Demonstrate professionalism: Reflect the applicant's academic proficiency and project planning capabilities
- Highlight innovations: Visually emphasize the unique value of your research
- Enhance persuasiveness: Proposals with well-integrated graphics are more readable and attractive
However, traditional scientific illustration methods have many pain points:
| Pain Point | Description |
|---|---|
| ⏱️ Time-consuming | Manual drawing with Visio or PPT takes hours or even days |
| 🎨 High design skills required | Color schemes, layouts, and typography require professional design knowledge |
| 🔄 High revision costs | Significant rework needed when advisors or team members suggest changes |
| 📐 Inconsistent formatting | Difficult to maintain consistent chart styles in collaborative work |
SciDraw AI's AI scientific illustration feature was designed to solve these problems. Simply describe your research content, and AI can generate professional scientific charts in seconds, with SVG vector format export for free editing in PowerPoint or Adobe Illustrator.
Different Requirements for Three Major Grant Types
Different types of research grants have different emphases on diagrams. Understanding these differences helps you prepare targeted visual materials.
1. National Natural Science Foundation of China (NSFC)
NSFC focuses on basic research and applied basic research, with reviewers particularly concerned about scientific validity, innovation, and feasibility.
Common Diagram Types:
| Diagram Type | Purpose | Recommended Section |
|---|---|---|
| Technical Roadmap | Show timeline and task breakdown of research plan | Research Proposal |
| Research Scheme Diagram | Present overall research design and methodology framework | Research Content |
| Mechanism Diagram | Explain scientific hypotheses and mechanisms | Project Rationale |
| Experimental Flowchart | Describe specific experimental steps and methods | Research Methods |
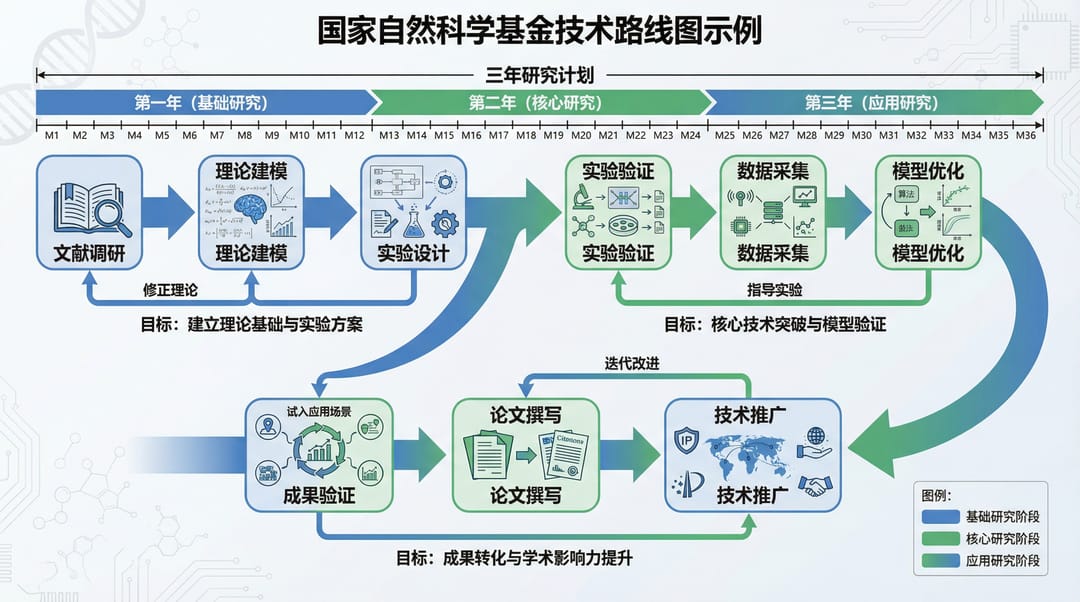
Prompt Template - Technical Roadmap:
NSFC Technical Roadmap, 16:9 landscape format.

Research Topic: [Your research topic]

Three-Year Research Plan:
- Year 1 (Foundation Phase): [Task 1], [Task 2], [Task 3]
- Year 2 (Core Research Phase): [Task 1], [Task 2], [Task 3]
- Year 3 (Application & Validation Phase): [Task 1], [Task 2], [Task 3]

Use different colored modules for each phase, connect with arrows, annotate key milestones and expected outcomes.
Blue-green color scheme, academic professional style, clear timeline layout.
Example Result:
2. National Social Science Foundation of China (NSSFC)
NSSFC focuses on humanities and social science research, with reviewers emphasizing theoretical depth, methodological rigor, and social value.
Common Diagram Types:
| Diagram Type | Purpose | Recommended Section |
|---|---|---|
| Research Framework | Present theoretical framework and logical structure | Research Approach |
| Theoretical Model | Show variable relationships and theoretical hypotheses | Research Content |
| Analysis Pathway | Explain research methods and analysis steps | Research Methods |
| Concept Relationship Diagram | Illustrate core concepts and their interrelationships | Concept Definition |
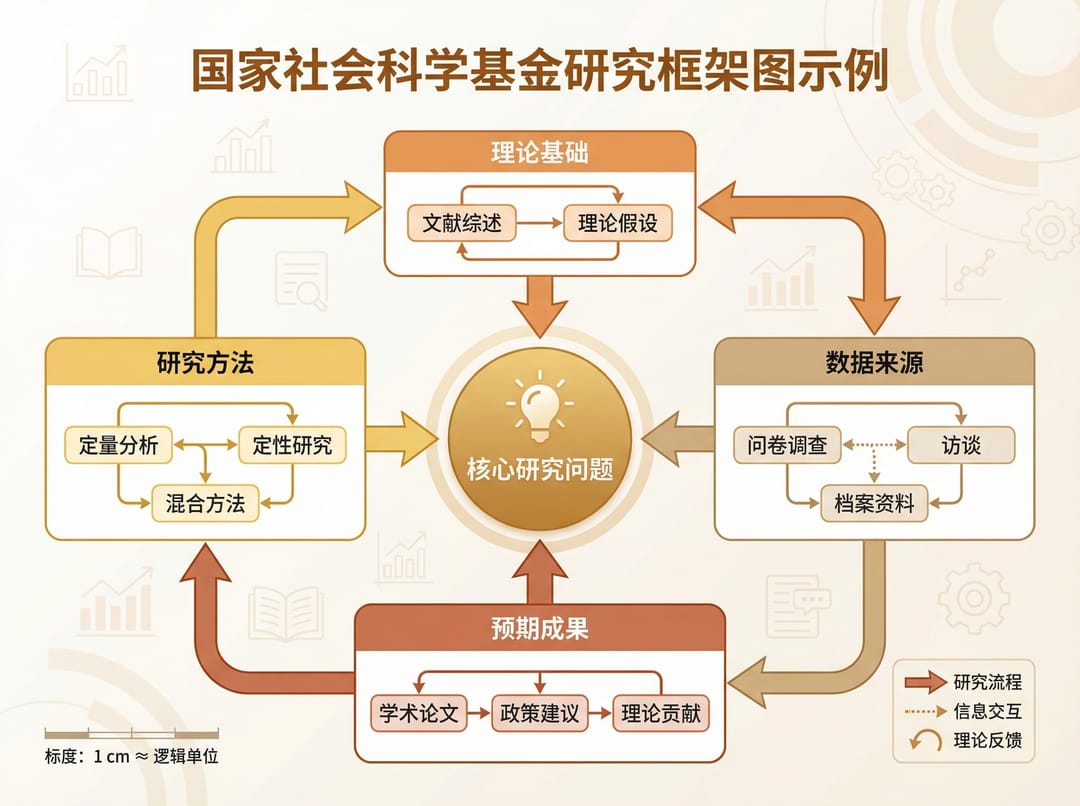
Prompt Template - Research Framework:
NSSFC Research Framework Diagram, 4:3 aspect ratio.

Research Topic: [Your research topic]

Framework Structure:
- Center: Core research question
- Theoretical Foundation: [Theory 1], [Theory 2], [Theory 3]
- Research Dimensions: [Dimension 1], [Dimension 2], [Dimension 3], [Dimension 4]
- Research Methods: Quantitative analysis, Qualitative research, Mixed methods
- Expected Outcomes: Academic papers, Policy recommendations, Theoretical contributions

Clear hierarchical structure, arrows indicating logical relationships, rigorous academic style, warm color scheme.
Example Result:
3. Ministry of Education Humanities and Social Sciences Fund
MOE grants focus on educational reform and humanities/social science research, with particular attention to practical application value.
Common Diagram Types:
| Diagram Type | Purpose | Recommended Section |
|---|---|---|
| Curriculum System Diagram | Present course structure and knowledge system | Teaching Reform Plan |
| Teaching Model Diagram | Show innovative teaching methods and implementation paths | Research Content |
| Reform Process Flowchart | Explain educational reform implementation steps | Research Proposal |
| Competency Development Diagram | Illustrate talent cultivation goals and pathways | Expected Outcomes |
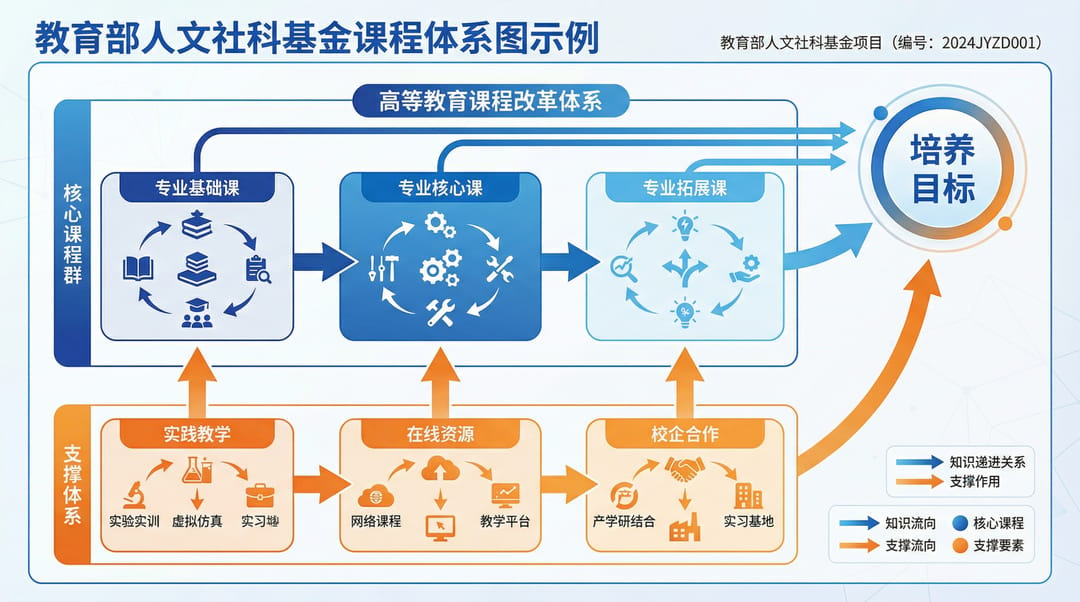
Prompt Template - Curriculum System Diagram:
MOE Curriculum System Diagram, 16:9 landscape format.

Research Topic: [Program Name] Curriculum Reform

Curriculum Structure:
- Core Course Cluster: [Course 1], [Course 2], [Course 3]
- Professional Electives: [Course 1], [Course 2], [Course 3]
- Practical Teaching Components: [Component 1], [Component 2], [Component 3]
- Training Objectives: [Objective 1], [Objective 2], [Objective 3]

Use arrows to show knowledge progression between courses, highlight reform innovations.
Education-themed colors (blue + orange), modern educational style, clear structure.
Example Result:
Core AI Illustration Techniques
Master these techniques to make AI-generated diagrams more precise and professional:
1. Structured Prompts
A good prompt should include these elements:
[Diagram Type] + [Research Topic] + [Specific Content] + [Layout Description] + [Color Style]Comparison Example:
❌ Vague prompt:
Draw a technical roadmap✅ Structured prompt:
NSFC Technical Roadmap, 16:9 landscape format.

Research Topic: Deep Learning-based Medical Image Intelligent Diagnosis System

Three-Year Research Plan:
- Year 1: Dataset construction, model architecture design, benchmark experiments
- Year 2: Multi-modal fusion, clinical validation, performance optimization
- Year 3: System integration, multi-center validation, technology transfer

Timeline from left to right, each phase represented by different colored rounded rectangles.
Blue-purple gradient color scheme, modern tech style.
2. Utilize Hierarchical Structure
Scientific diagrams typically need clear hierarchical structures:
- Top Level: Research objectives or core questions
- Middle Level: Research content or methodological dimensions
- Bottom Level: Specific tasks or expected outcomes
Clearly describe these hierarchical relationships in your prompts for more organized diagrams.
3. Color Scheme Selection
| Research Field | Recommended Colors | Notes |
|---|---|---|
| Science & Engineering | Blue series, Blue-green | Tech-savvy, Professional |
| Medicine | Blue-white, Green series | Clean, Healthy |
| Social Sciences | Warm tones, Orange-blue contrast | Humanistic, Analytical |
| Education | Blue-orange, Green series | Vibrant, Growth-oriented |
4. Format Standards
- Aspect Ratio: Use 16:9 for landscape diagrams, 1:1 or 4:3 for square diagrams
- Typography: Use clear, readable fonts, avoid overly decorative styles
- White Space: Appropriate white space makes diagrams more professional
- Arrows: Use arrows to indicate flow, causality, and progression
Practical Examples
Example 1: NSFC General Project - Technical Roadmap
Research Topic: Key Technologies for AI-based Early Tumor Diagnosis
Prompt:
NSFC General Project Technical Roadmap, 16:9 landscape format.

Research Topic: Key Technologies for AI-based Early Tumor Diagnosis

Four-Year Research Plan:
- Year 1 (Data & Foundation): Multi-center data collection, annotation standards, benchmark dataset construction
- Year 2 (Algorithm Development): Deep learning model design, feature extraction optimization, preliminary validation
- Year 3 (System Integration): Diagnosis system development, clinical testing, performance evaluation
- Year 4 (Promotion & Application): Multi-center validation, technology transfer, outcome dissemination

Mark key milestones with diamonds, distinguish each year with different colors.
Medical technology style, blue-green color scheme, professional and rigorous.
Example 2: NSSFC General Project - Research Framework
Research Topic: Pathways to Enhance SME Innovation Capability in the Digital Economy
Prompt:
NSSFC Research Framework Diagram, 4:3 aspect ratio.

Research Topic: Pathways to Enhance SME Innovation Capability in the Digital Economy

Framework Structure:
- Core Question: How does digital transformation promote SME innovation?
- Theoretical Foundation: Innovation ecosystem theory, Dynamic capabilities theory, Resource-based view
- Research Dimensions: Digital infrastructure, Innovation resource acquisition, Organizational learning, External network embeddedness
- Research Methods: Survey (500 enterprises), Case studies (10 typical enterprises), Econometric analysis
- Expected Outcomes: Theoretical model, Policy recommendations, Practical guidelines

Radial layout from center, interactive arrows between dimensions.
Business blue as main color, accented with warm orange.
Example 3: MOE Youth Project - Teaching Model
Research Topic: OBE-based Engineering Education Curriculum Reform and Practice
Prompt:
MOE Youth Project Teaching Model Diagram, 16:9 landscape format.

Research Topic: OBE-based Engineering Education Curriculum Reform and Practice

Teaching Model Framework:
- Top Layer: Training Objectives (Engineering practice, Innovative thinking, Teamwork)
- Middle Layer: Curriculum System (Theory courses, Practice courses, Innovation courses)
- Bottom Layer: Teaching Methods (Project-driven, Case teaching, Flipped classroom)
- Support: Evaluation System (Process evaluation, Outcome evaluation, Competency evaluation)

Emphasize the closed loop of "Goal-oriented - Curriculum Design - Teaching Implementation - Evaluation Feedback."
Education-themed colors, blue as primary, orange as secondary, modern and clean style.
FAQ and Solutions
Q1: Can AI-generated diagrams be used directly in proposals?
A: Yes, but we recommend the following optimizations:
- Export in SVG format for fine-tuning in PPT or AI
- Ensure text is clear with no typos
- Maintain consistent color schemes across all diagrams in your proposal
- Adjust diagram dimensions according to layout requirements
Q2: How to make diagrams more academically professional?
A: Pay attention to these points:
- Use standardized academic terminology
- Keep colors simple and professional, avoid flashy designs
- Maintain clear hierarchical structure and logical relationships
- Add necessary annotations and legends
Q3: How many diagrams does a proposal need?
A: Recommended quantities:
- NSFC Young Scientists Fund: 2-3 diagrams (technical roadmap is essential)
- NSFC General Project: 3-5 diagrams
- NSSFC General Project: 2-4 diagrams
- MOE Projects: 2-3 diagrams
Q4: What are the advantages of SVG format?
A: SVG is a vector format with these advantages:
- Infinite scalability without quality loss, high print quality
- Editable individual elements in PPT or AI
- Small file size, easy to transfer
- Supports color, font, and layout modifications
Summary
The quality of diagrams in research grant applications directly impacts reviewer impressions. With SciDraw AI's AI scientific illustration feature, you can:
✅ Generate in minutes: Say goodbye to hours of manual drawing ✅ Professional quality: AI understands research contexts and generates academic-style diagrams ✅ Free editing: SVG vector format allows fine-tuning in any design software ✅ Consistent style: Multiple diagrams for the same project maintain unified visual style
Whether it's technical roadmaps for NSFC, research frameworks for NSSFC, or curriculum system diagrams for MOE projects, SciDraw AI helps you quickly generate professional, beautiful scientific illustrations.
Get Started
Ready to enhance your grant proposal quality? Generate your first scientific diagram with SciDraw AI now:
Simply input your research content description, and AI instantly generates professional scientific diagrams. Supports technical roadmaps, research frameworks, mechanism diagrams, flowcharts, and more to help your research grant application succeed!