블로그
저희 팀의 최신 소식과 업데이트
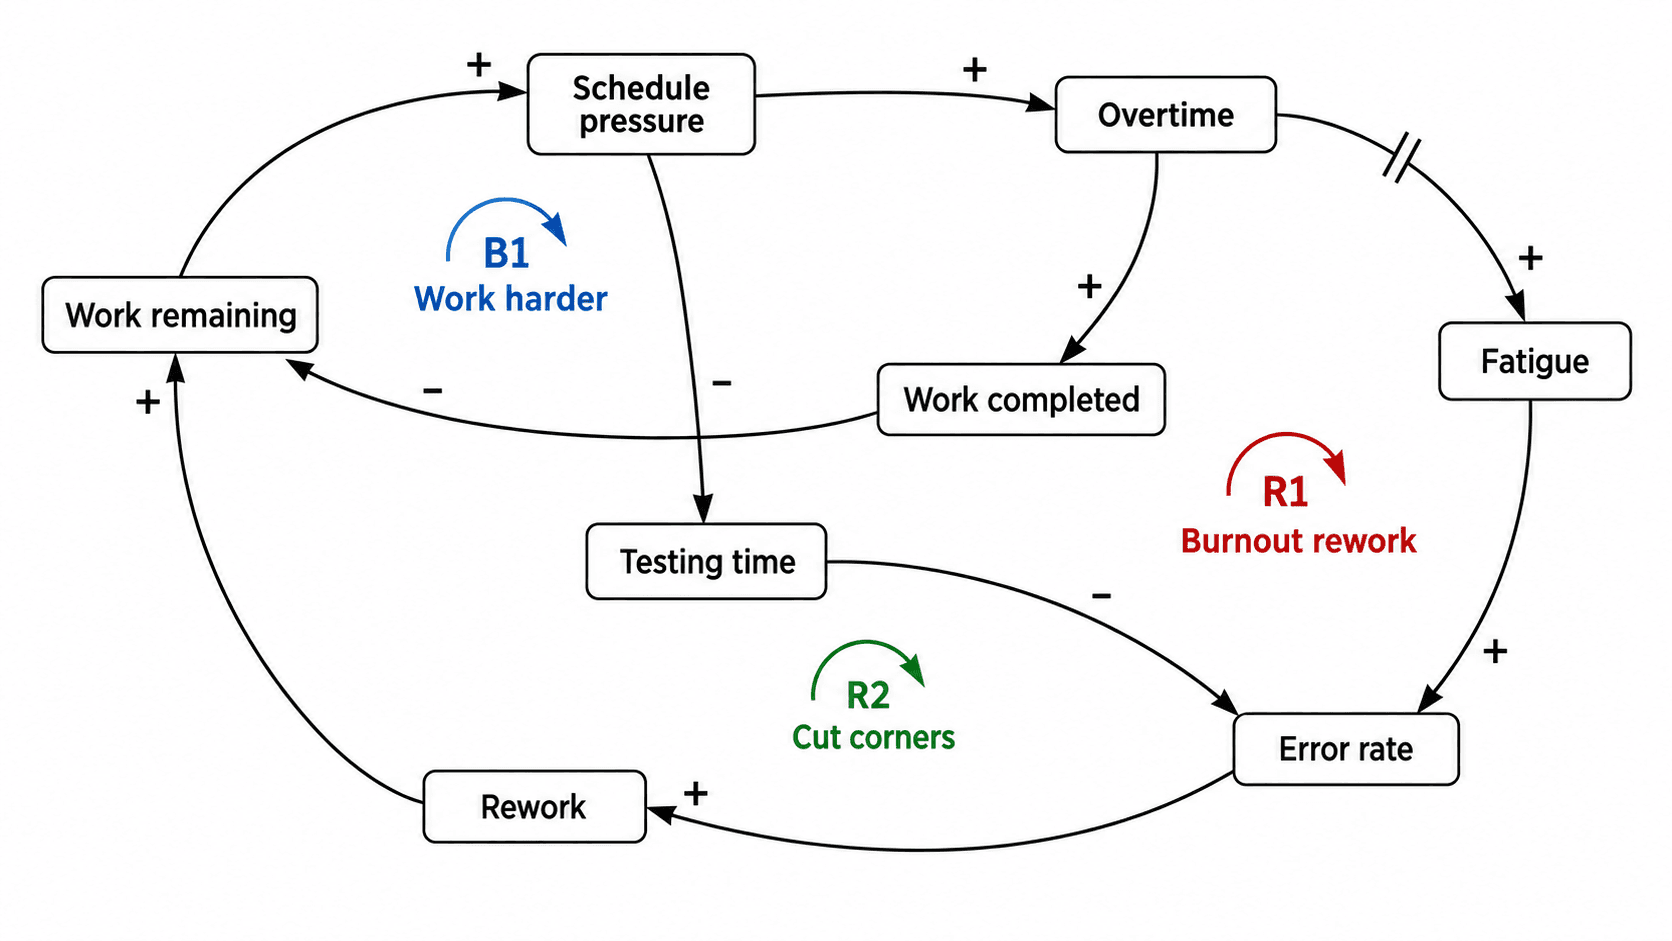
How to Draw a Causal Loop Diagram: Polarity, Reinforcing and Balancing Loops (2026)
A practical guide to causal loop diagrams for system dynamics: choosing variables, assigning + and − polarity, telling reinforcing from balancing loops, marking delays, and writing the loops up in a thesis.

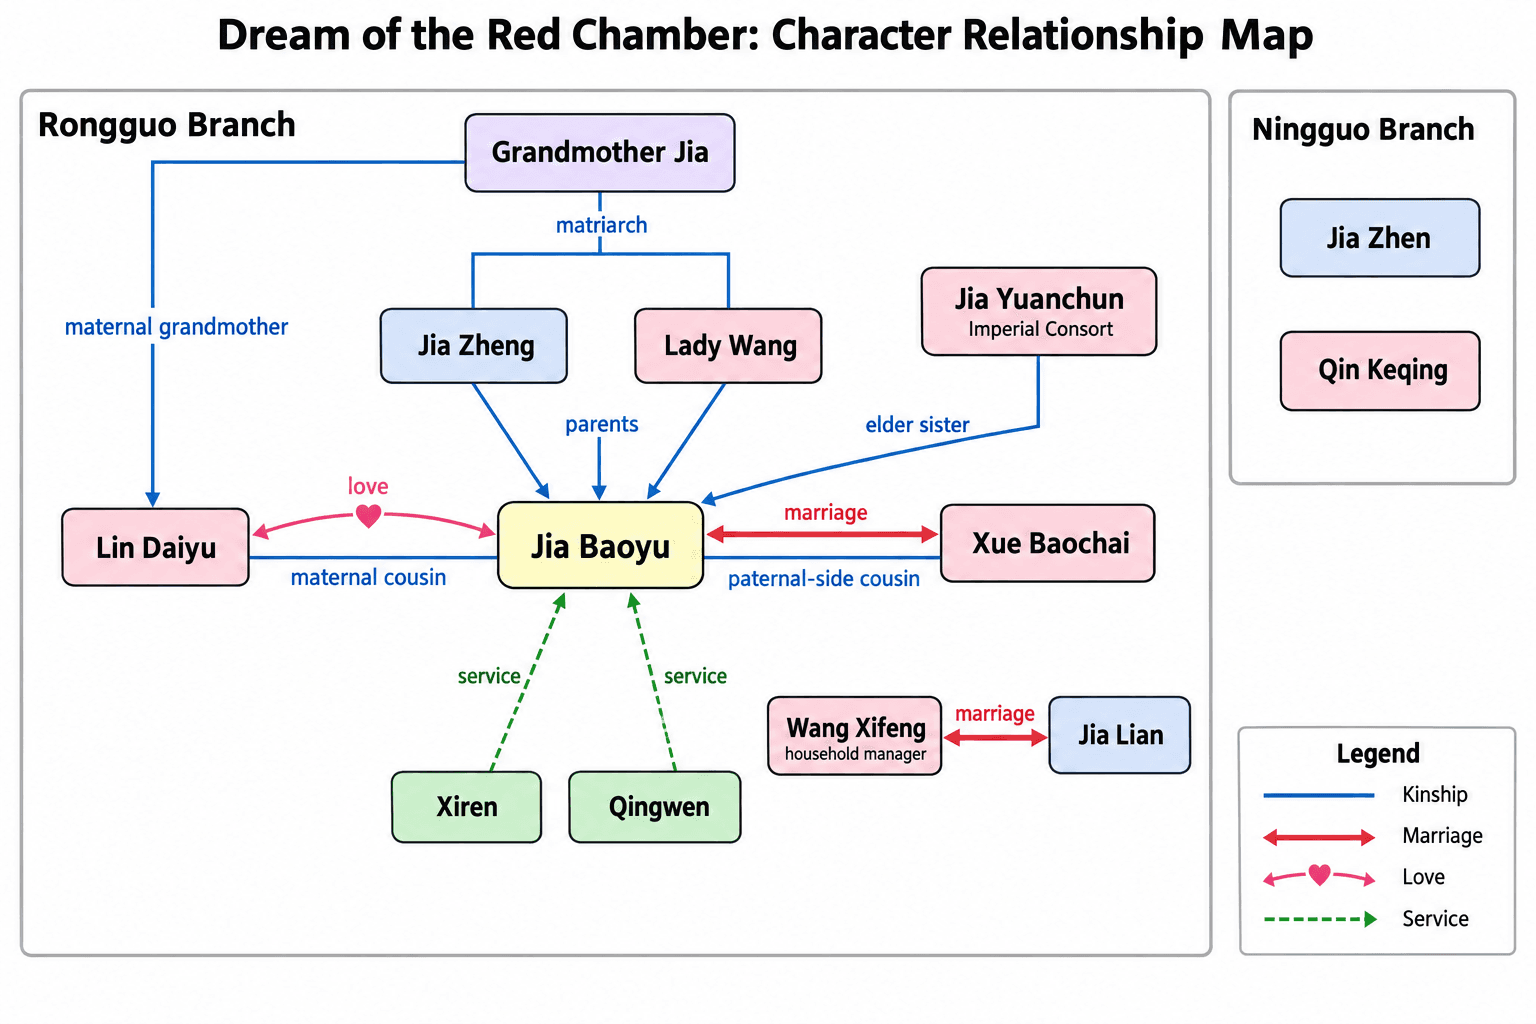
How to Make a Character Relationship Map for a Literature or History Thesis (2026)
How to make a character relationship map for a novel, play, history or film thesis: required elements, a cited relationship table, Pride and Prejudice and Hamlet examples, common mistakes, captions, and AI drafts.
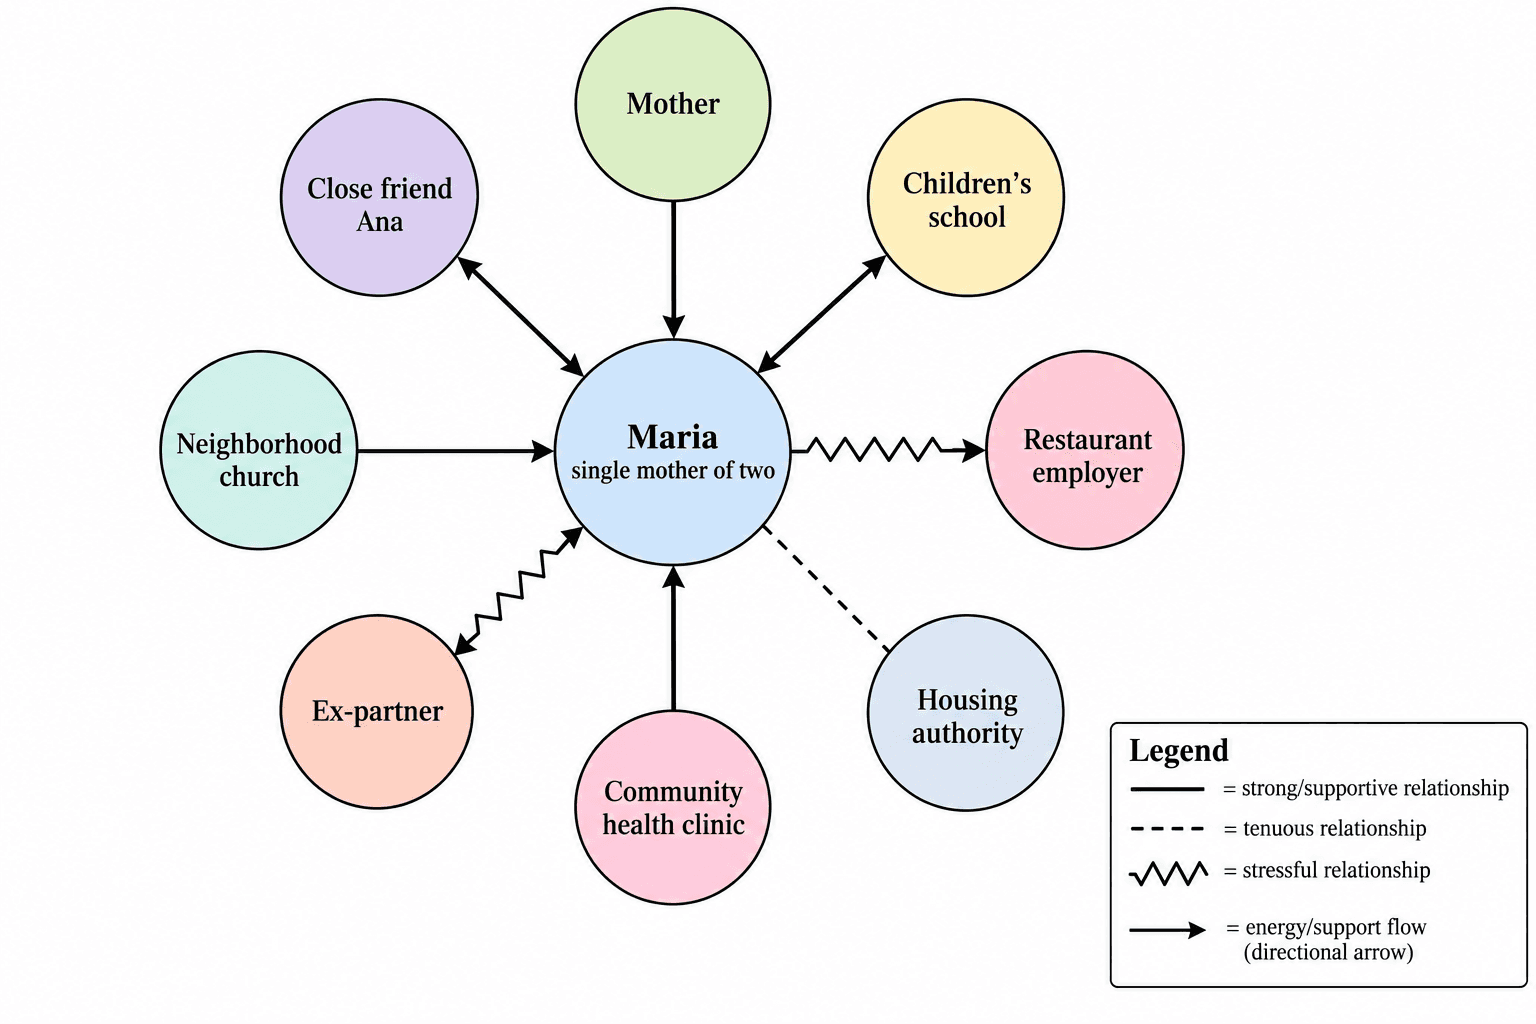
How to Make an Ecomap: Social Work and Nursing Case Assessment (2026)
How to make an ecomap for social work and nursing assessment: line conventions, the legend, ecomap vs genogram, anonymization, and two worked examples.
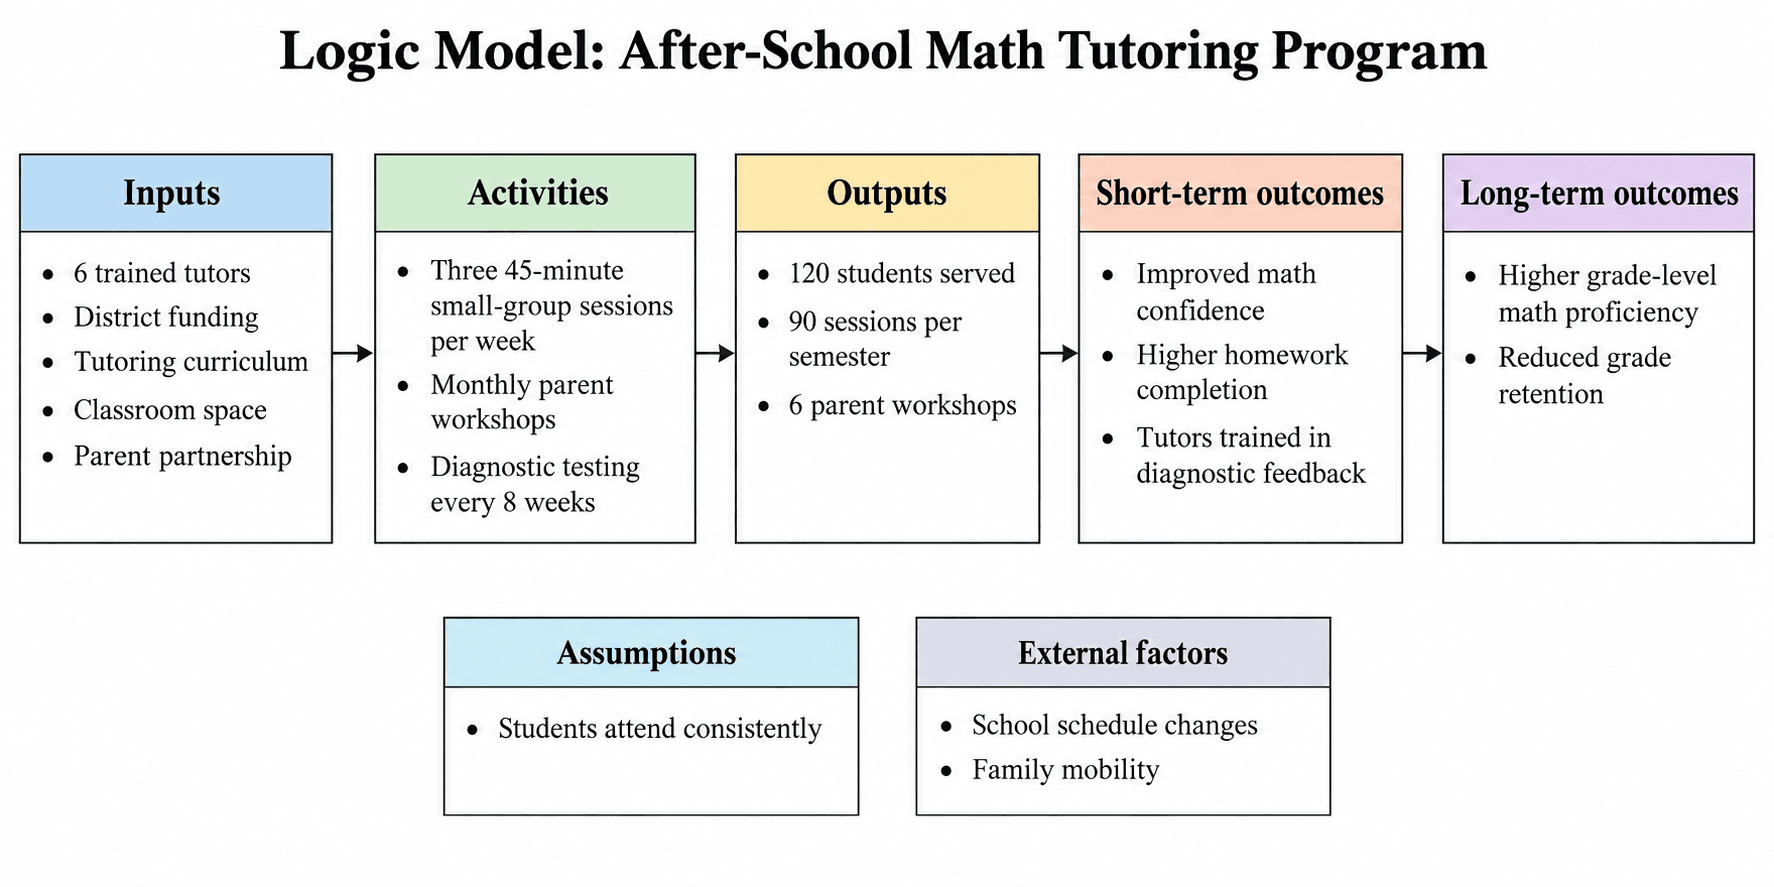
How to Create a Logic Model: Inputs, Activities, Outputs and Outcomes (2026)
How to create a program logic model: the five columns, where assumptions and external factors go, outputs versus outcomes, and a worked logic model example.
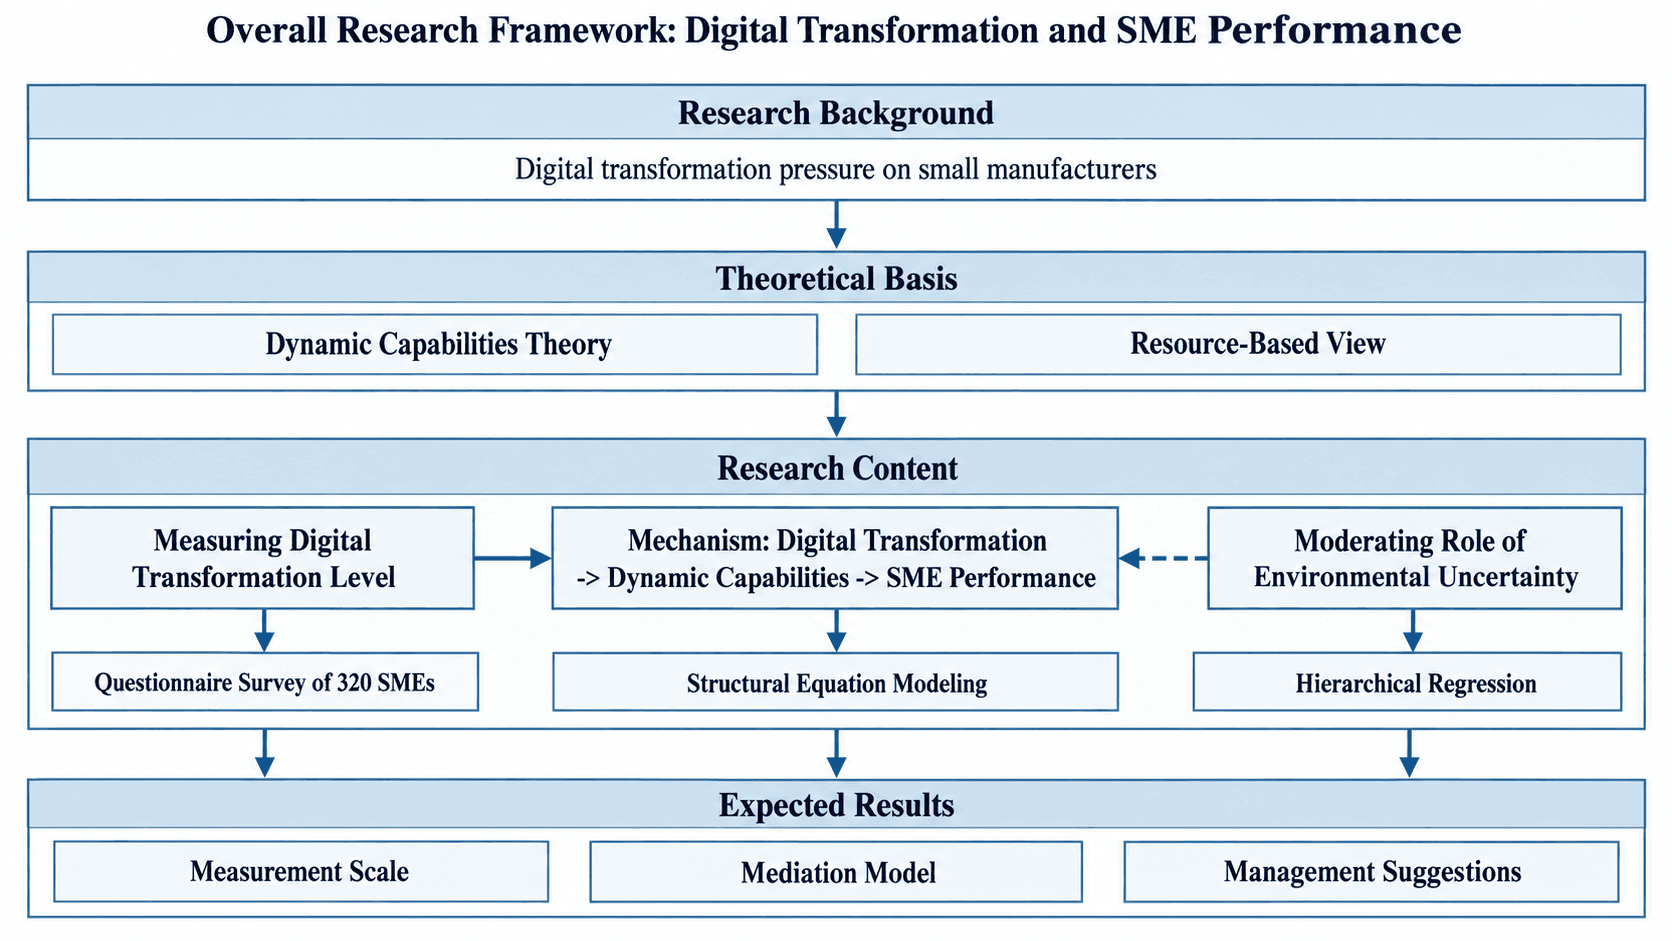
연구 모형·연구 프레임워크 그리는 법: 변수 모형, IPO, 전체 연구 틀 (2026)
학위논문과 연구계획서에 들어가는 연구 프레임워크 그림을 변수 관계 모형, IPO 투입-과정-산출 틀, 전체 연구 틀의 세 가지로 나눠 설명합니다. 유형별 작성 예시와 지도교수가 돌려보내는 흔한 실수까지 정리했습니다.
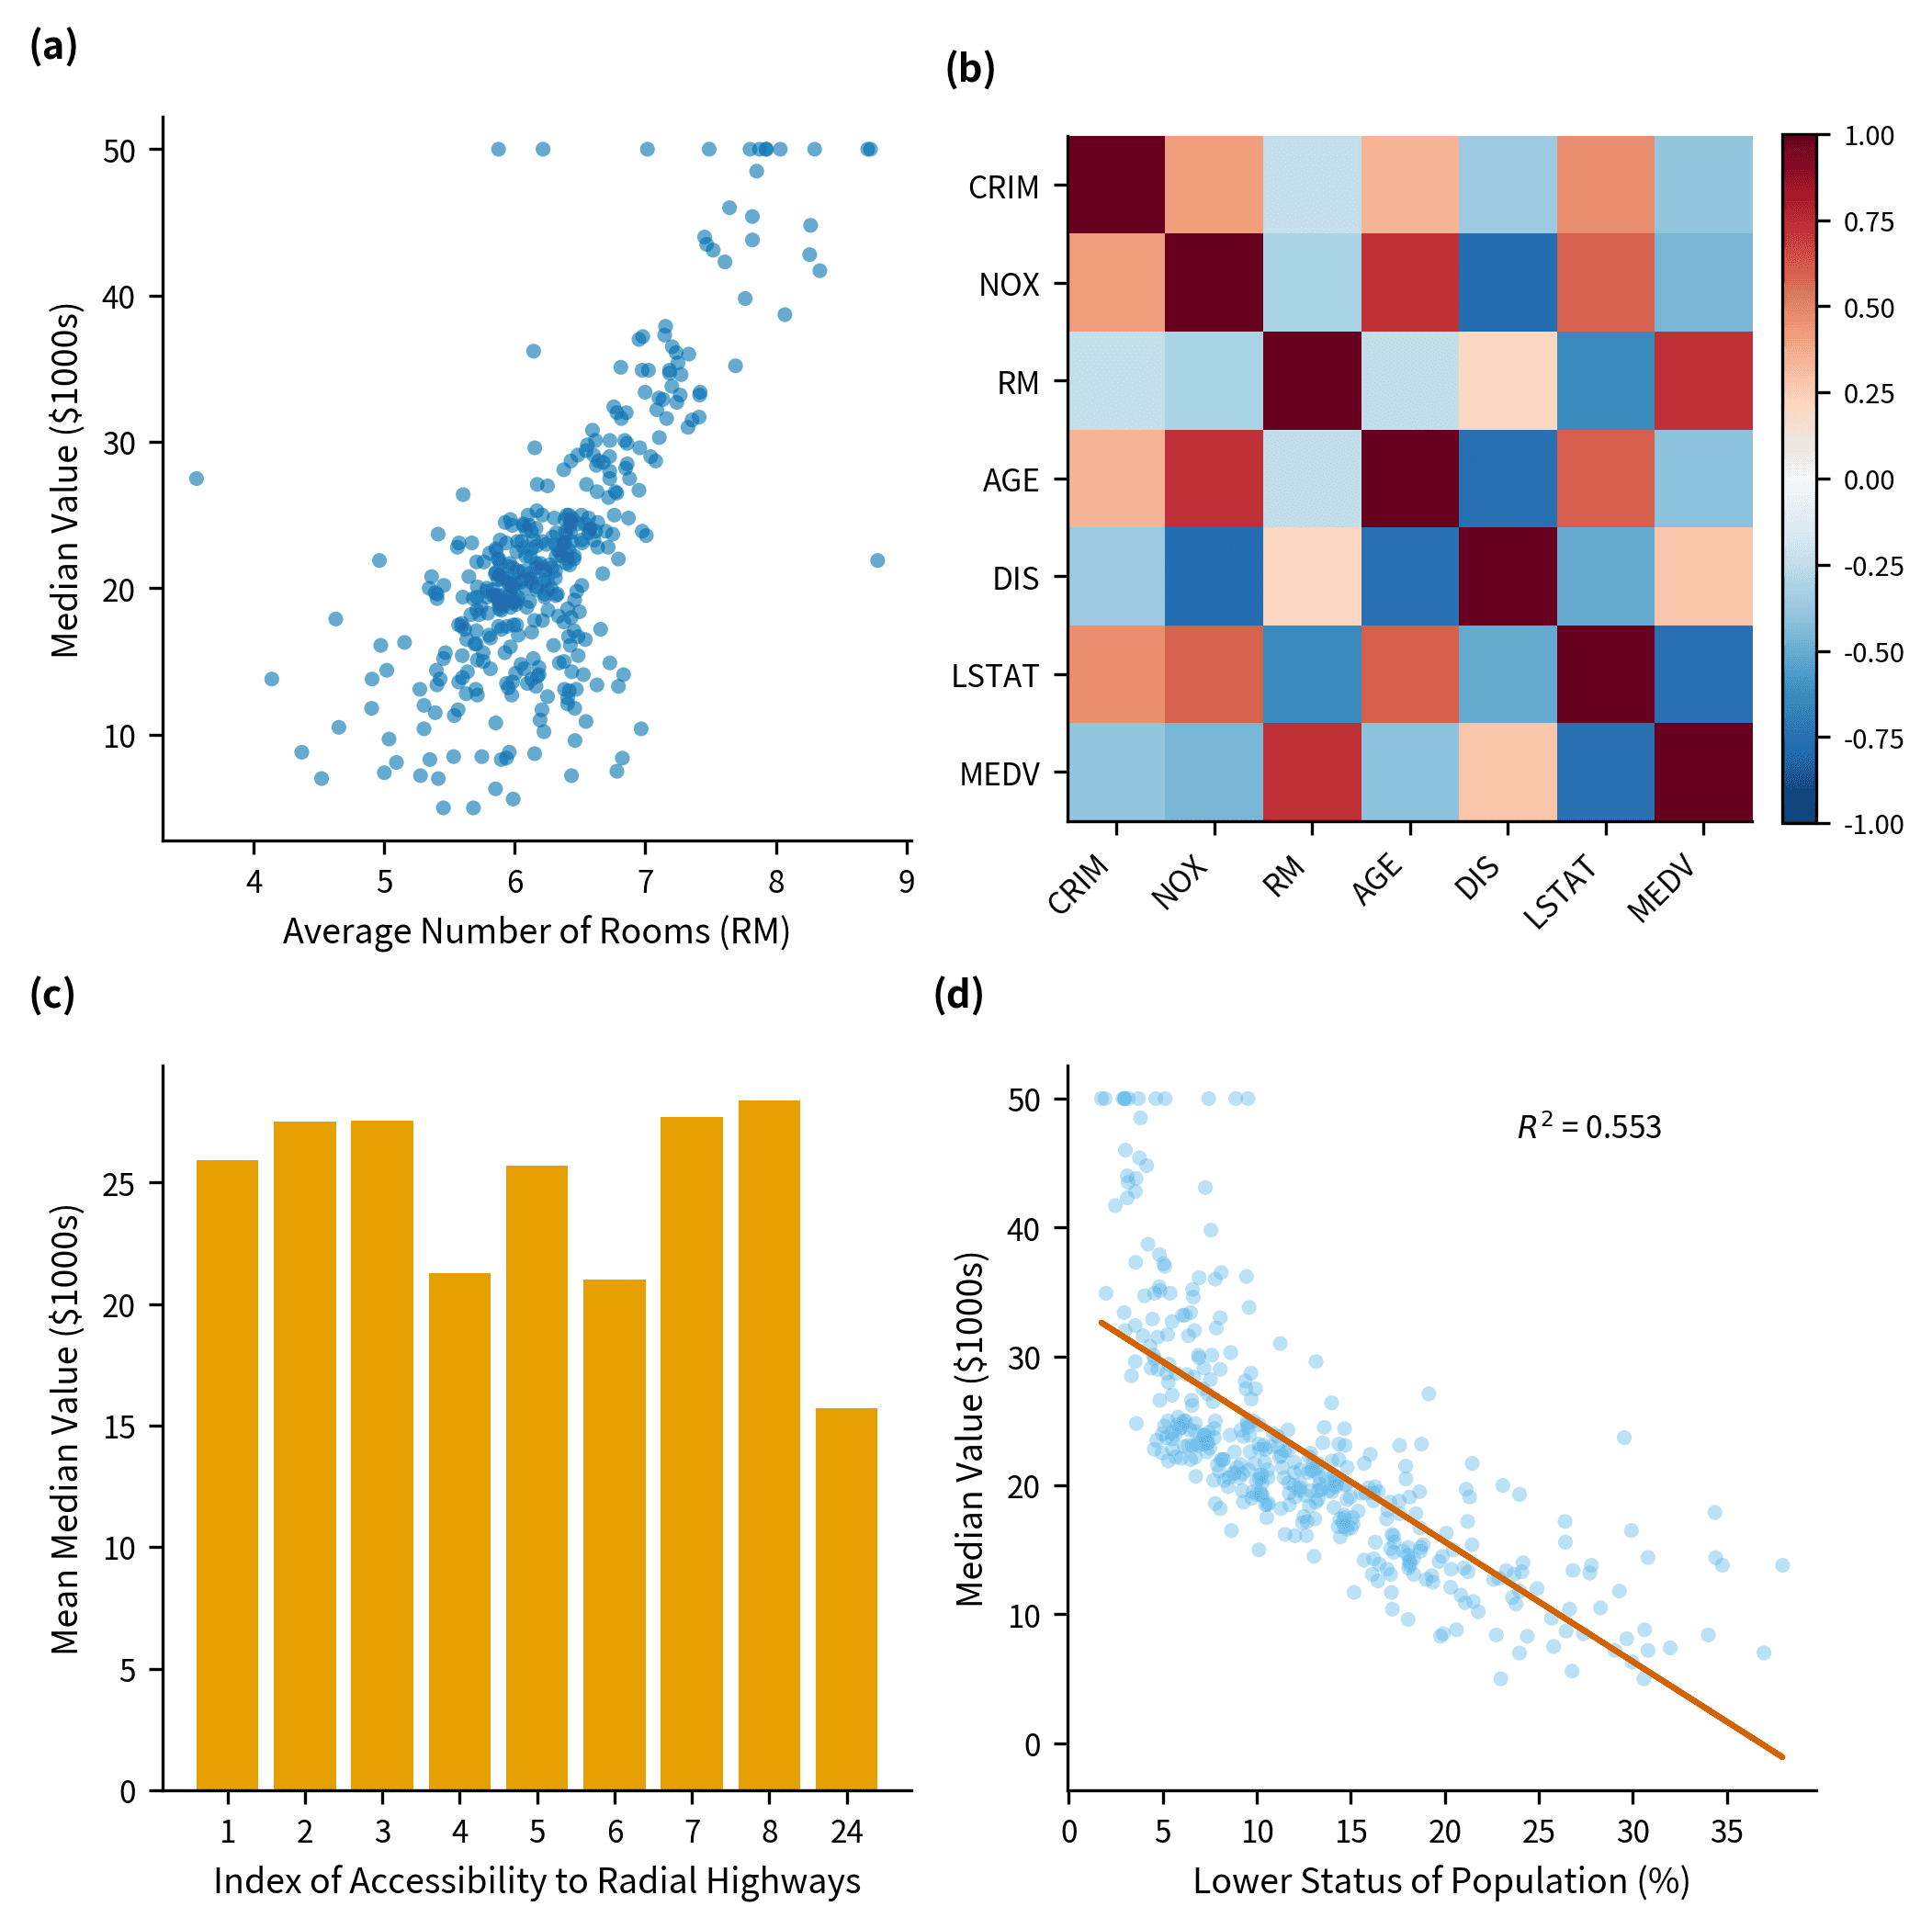
학술 논문용 데이터 시각화: CSV 및 Excel 연동형 과학 차트 제작 도구 46선
연구 목적에 부합하는 과학 차트를 선택하고, 필요한 데이터 열 구조를 확인한 뒤, SciDraw AI SciVis를 통해 CSV나 Excel 파일로부터 논문 게재 수준의 그래프 46종을 제작해 보세요.