💡 SciDraw AI Research Roadmap Maker: includes a template for teaching-reform and education research projects. Replace the sample text with your own and get a first draft. Generate a roadmap →
The internal deadline for the teaching-reform proposal is a week away. The text is nearly done, but the research-approach section says "a figure may be attached", and the slide you spent an evening on has arrows leaving every side of every box.
In Chinese universities and vocational colleges, teaching-reform projects (教改项目), teaching achievement awards, first-class course applications and teaching-innovation competitions all rely on a similar set of figures. Instead of an experimental workflow, they show a line from problem to reform measures to practice to evaluation, and they describe systems such as a curriculum or a training model. The same structures work for education research proposals elsewhere. For science and social-science grants, see the research grant illustration guide.
The example images below are labelled in Chinese; the layouts carry over to any language.
Which figures a proposal usually needs
Section names vary by province and institution, so follow the template in your own call for proposals.
| Figure | Where it goes | The reviewer's question it answers |
|---|---|---|
| Research roadmap (技术路线图) | Research approach | In what order will the work be done, and what does each step produce? |
| Research framework (研究框架图) | Objectives and content | How do the research topics relate to each other? |
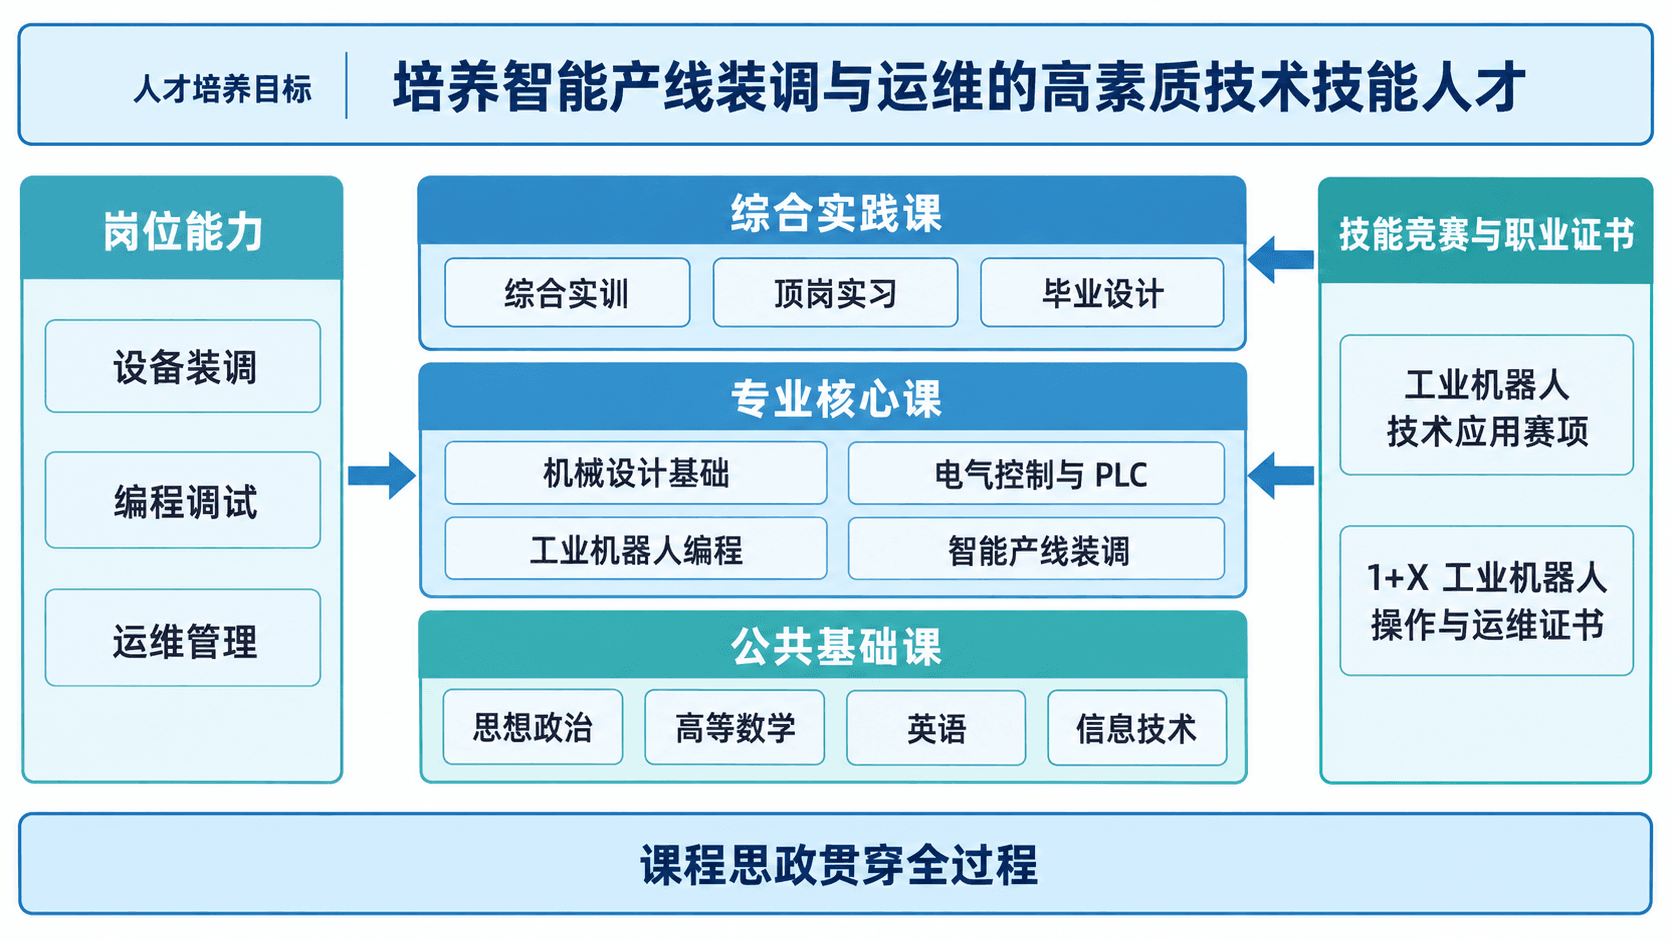
| Curriculum system map (课程体系图) | Reform content | How are courses layered, and how do they map to job skills or graduate outcomes? |
| Talent-training model (人才培养模式图) | Reform plan | Which parties and stages deliver the training goals? |
| Closed-loop teaching model (教学模式图) | Teaching design | How does one teaching cycle run, and how does evaluation feed back? |
| Gantt chart | Schedule | Is the timeline realistic? |
An implementation-path figure is a flowchart; use the flowchart maker. For the causes of a teaching problem, a fishbone diagram fits.
Research roadmap
Structure: four or five layers from top to bottom: problem, survey and analysis, scheme design, classroom practice, evaluation and outputs. Put two to four parallel boxes in each layer and keep the whole figure under 20 boxes. Add one feedback arrow from evaluation back to scheme design.
Common mistakes: placing the research topics side by side with no order (that is a framework, not a roadmap); writing full sentences in boxes; crossing arrows that hide the main line.
Research roadmap for a teaching-reform project, portrait 3:4, five layers from top to bottom, connected by downward arrows.

Project: [Reforming practical teaching in the XX programme through industry-education integration]

Layer 1 Problem: [Practical teaching does not match job requirements], [Single assessment method]
Layer 2 Survey and analysis: [Literature review], [Employer job survey], [Student questionnaire]
Layer 3 Scheme design: [Restructure the curriculum], [Build school-enterprise training projects], [Design multi-source assessment]
Layer 4 Classroom practice: [Pilot in two classes], [Two rounds over one academic year]
Layer 5 Evaluation and outputs: [Student competency assessment], [Research report], [Teaching casebook]

Layer name on the left, that layer's boxes in a row on the right, all boxes the same size.
Draw one dashed feedback arrow from Layer 5 to Layer 3, labelled "continuous improvement".
Use only the text I have given. Do not add any other modules. Blue-grey palette, white background, no decorative icons.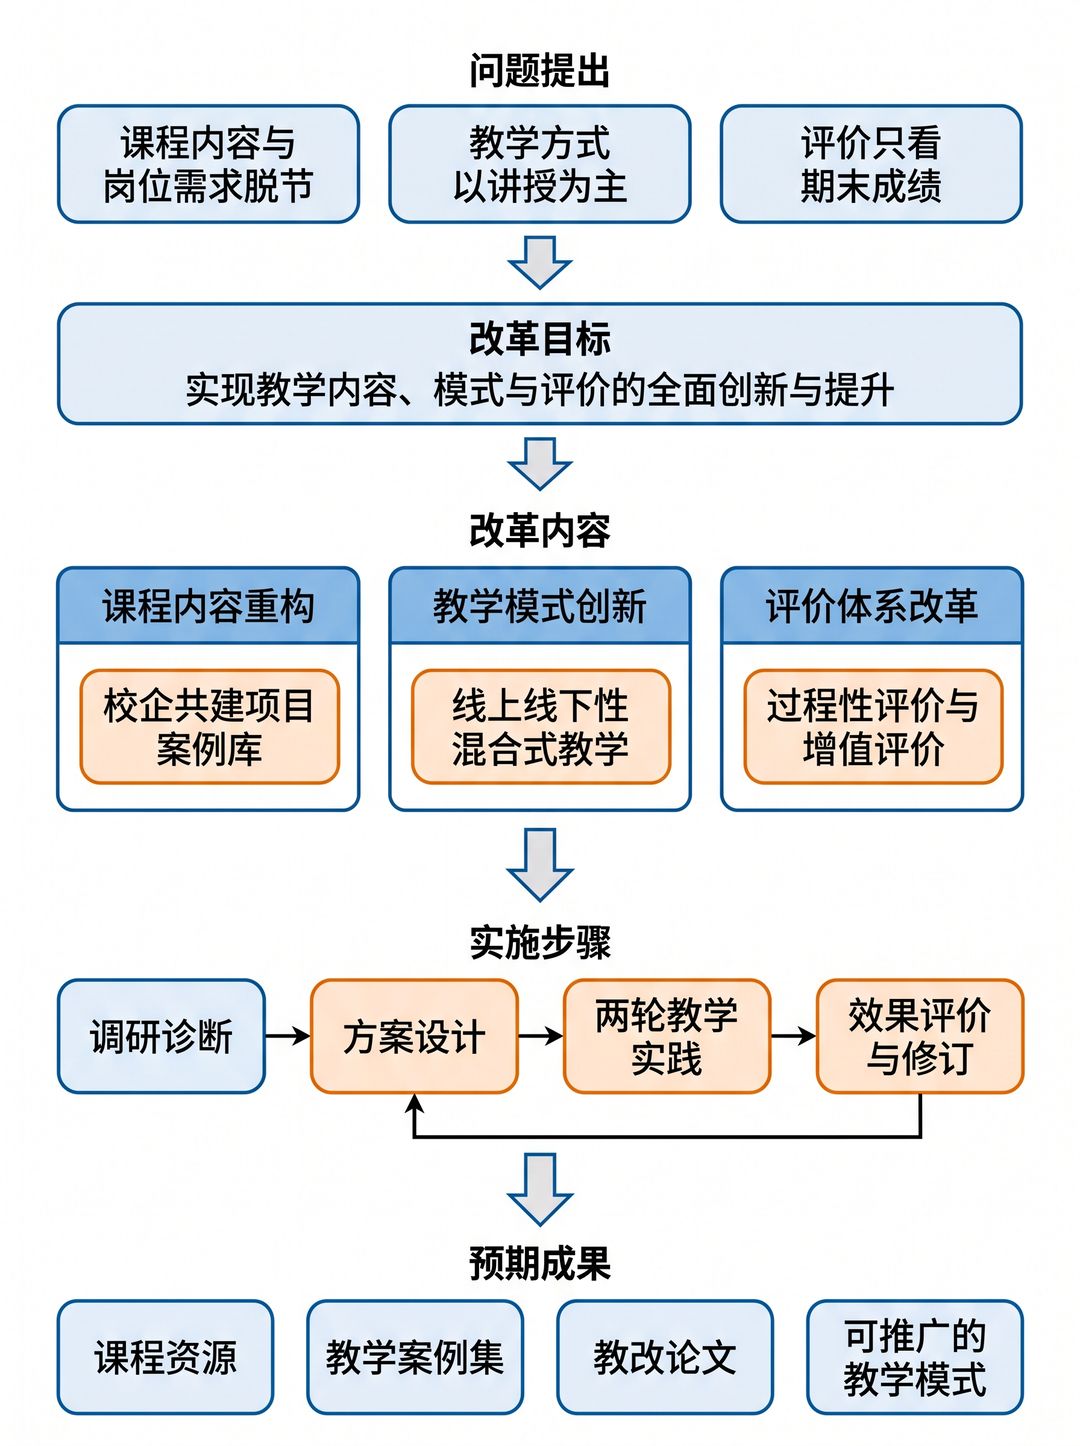
Research framework
Structure: a framework shows relationships, not sequence. The safest form has three layers: one core question on top, three or four parallel research topics in the middle, and expected outputs at the bottom. Chinese proposals often use numbered formulas such as "one core, two shifts, three reconstructions"; draw these as one box, then a row of two, then a row of three.
Common mistakes: the heading says three and the figure shows four boxes; arrows between every pair of topics; a framework that repeats the roadmap. If both figures appear, keep time and phases out of the framework.
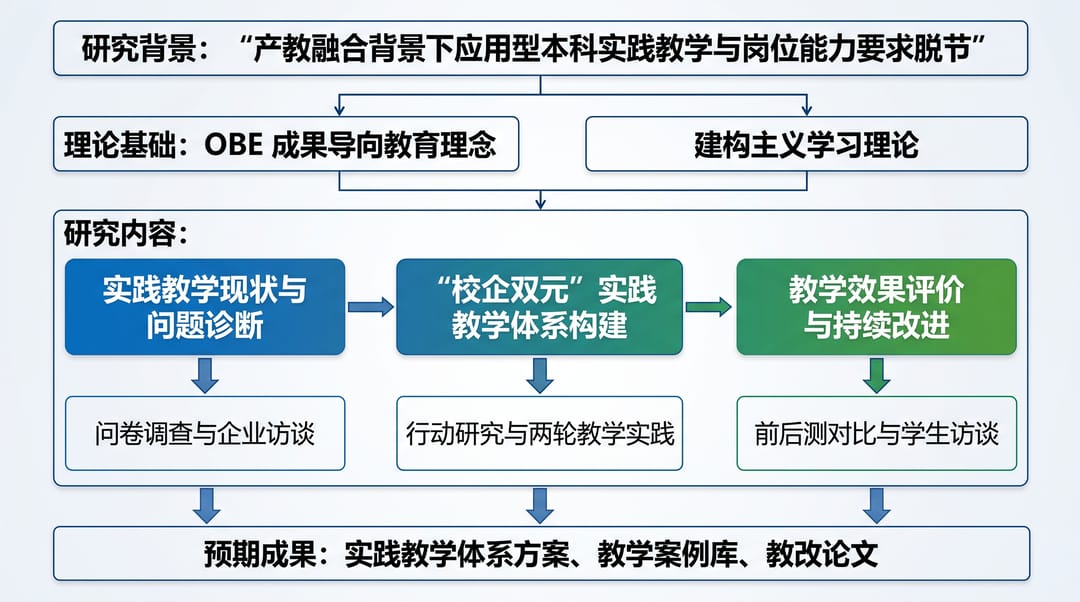
The roadmap prompt above adapts easily: describe the rows, the number of boxes in each, and where the arrows go. The conceptual framework maker has a mode for system and model diagrams, which also suits the next three figure types.
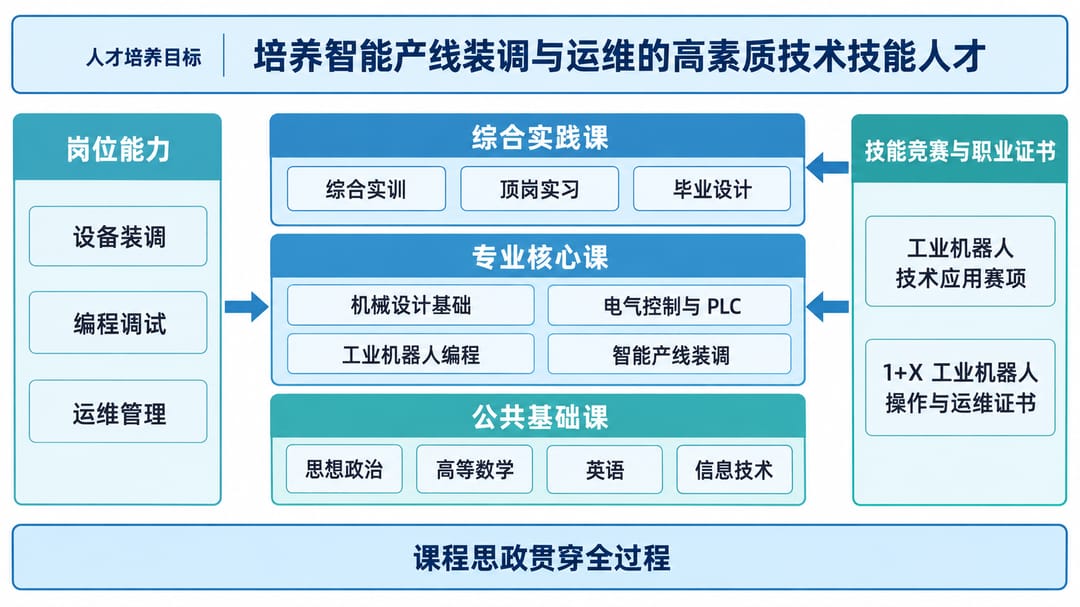
Curriculum system map
Structure: horizontal layers with vertical links. A common version stacks general courses, foundation courses, core courses and integrated practice. Chinese vocational colleges often use a four-row layout that links job roles, courses, skills competitions and certificates (岗课赛证). Outcome-based (OBE) programmes put graduate outcomes at the top with courses supporting them.
Common mistakes: listing every course in the programme (pick three to five per layer); showing categories without links between rows; course names that differ from the official programme document.
Talent-training model
Use three segments from left to right: input (industry demand, training goals), process (who trains and through which stages), output (competencies and job destinations). For school-enterprise models, draw the school and the company as two lanes with a middle row for what they do jointly. Keep one idea per figure, fill in the company's side, and replace vague outputs such as "high-quality talent" with specific skills or roles.
Closed-loop teaching model
Structure: a ring of four to six stages running clockwise, for example course, training, practice, evaluation (课—训—践—评), with the teaching goal in the centre and one or two concrete activities beside each stage. The arrow from the last stage back to the first is the feedback arrow and must say what it carries back.
Common mistakes: a ring whose feedback arrow has no label; more than six stages; one-word stage names with no explanation.
Closed-loop teaching model, square 1:1, ring layout, four stages clockwise, connected by curved arrows.

Centre circle: [Job competency achieved]

Top, Course: [Lectures], [Case discussion]
Right, Training: [On-campus simulation], [Group tasks]
Bottom, Practice: [Real company projects], [Internship]
Left, Evaluation: [Process assessment], [Company mentor assessment]

The arrow from Evaluation back to Course uses a different colour and is labelled "Feedback: adjust content and training projects".
All four stage boxes are the same size, stage name in large text above, activities in small text below.
Use only the text I have given. Do not add any other modules. Blue-green palette, white background.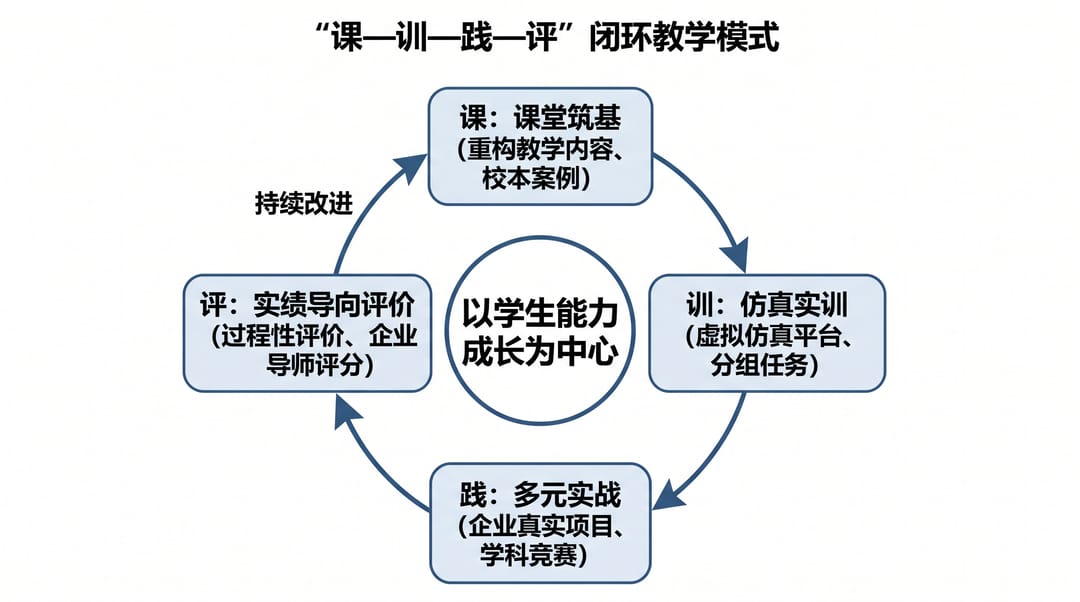
Gantt chart
Use months or terms on the horizontal axis and five to eight tasks on the vertical axis, named the same as the roadmap layers. Mark the mid-term review and the final review. Show overlapping tasks as overlapping bars, and make sure the dates match the project period stated in the proposal.
What to check after AI generates the figure
An AI-generated figure is a draft. Check it before you submit:
- Every label against the proposal text, including course names and spelling.
- Arrow and feedback direction. Talk through the figure following the arrows.
- Invented modules. Even with the instruction above, an extra box can appear. Remove it.
- Numbers. Three reconstructions means three boxes; Gantt bars must start and end in the right cells.
Dense figures come out with small text and more errors. If a figure needs more than about 20 boxes, split it into two.
In SciDraw AI you can make small corrections with a text instruction instead of regenerating. New accounts get 10 free credits at sign-up plus 5 per day, and one 2K diagram costs 5 credits.
FAQ
What is the difference between a research roadmap and a research framework?
A roadmap shows order: phases, direction, outputs. A framework shows how topics relate, with no timeline. If your two figures look alike, one of them is the wrong type.
How many figures should a proposal include?
There is no fixed rule. Two or three usually cover it: a roadmap, one system or model figure, and a Gantt chart if the template asks for a schedule. Follow any page limit in your own call for proposals.
Can I reuse the proposal figure in a presentation?
Yes, with changes. Regenerate it at 16:9 with fewer boxes and larger text, one figure per slide.
Which export format is best for later edits?
PNG is enough for a Word document. If you expect to change text or colours later, export SVG (10 to 15 credits) or PPTX (10 credits).
Summary
Decide three things before drawing: whether the figure shows order, relationships or a cycle; how many layers and boxes it needs; and whether every label matches the proposal text. Then copy the matching prompt, replace the bracketed text, and edit the draft.