💡 SciDraw AI Research Roadmap Maker: includes a template for traditional Chinese medicine research. Replace the sample text with your own and get a first draft. Generate a roadmap →
The proposal needs a roadmap and a mechanism figure. What you have is a compound–target network exported from software: several hundred nodes that become unreadable at half-page width.
Figures for traditional Chinese medicine (TCM) research have to carry many components and targets, combine TCM theory with modern assay readouts, and separate what was predicted from what was verified. This guide covers the figure types one by one. For general grant figures, see the research grant illustration guide.
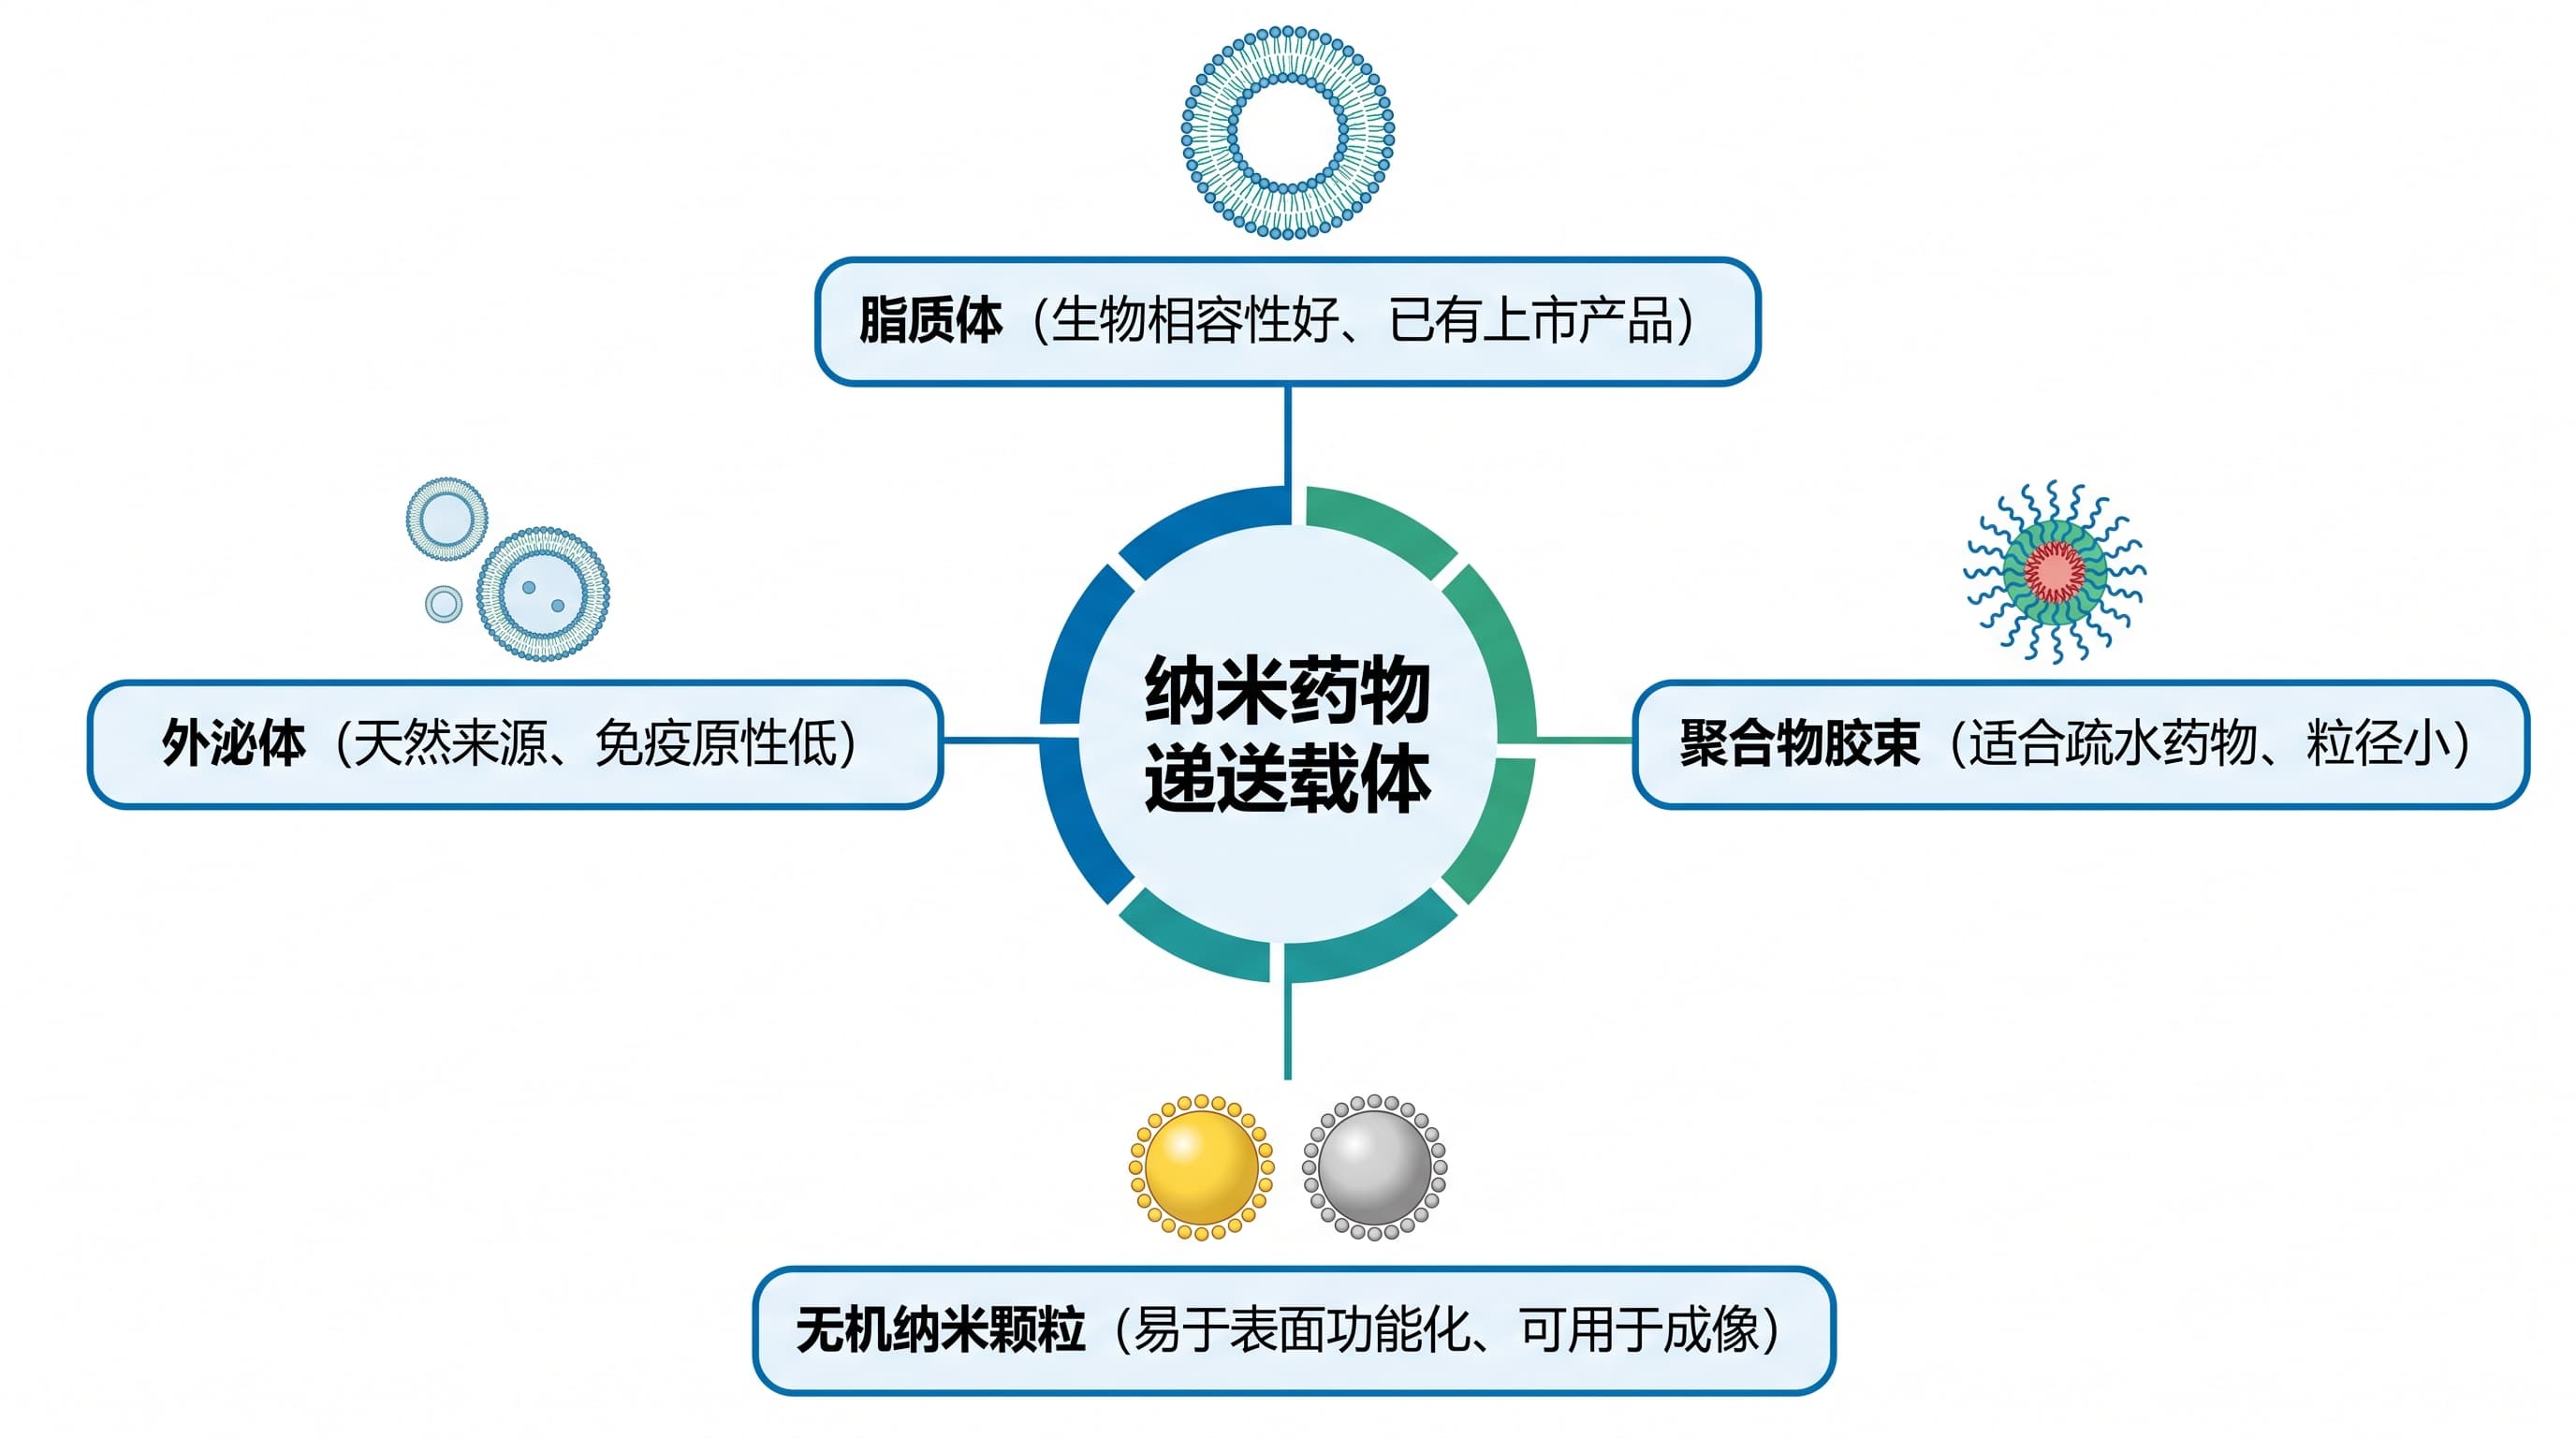
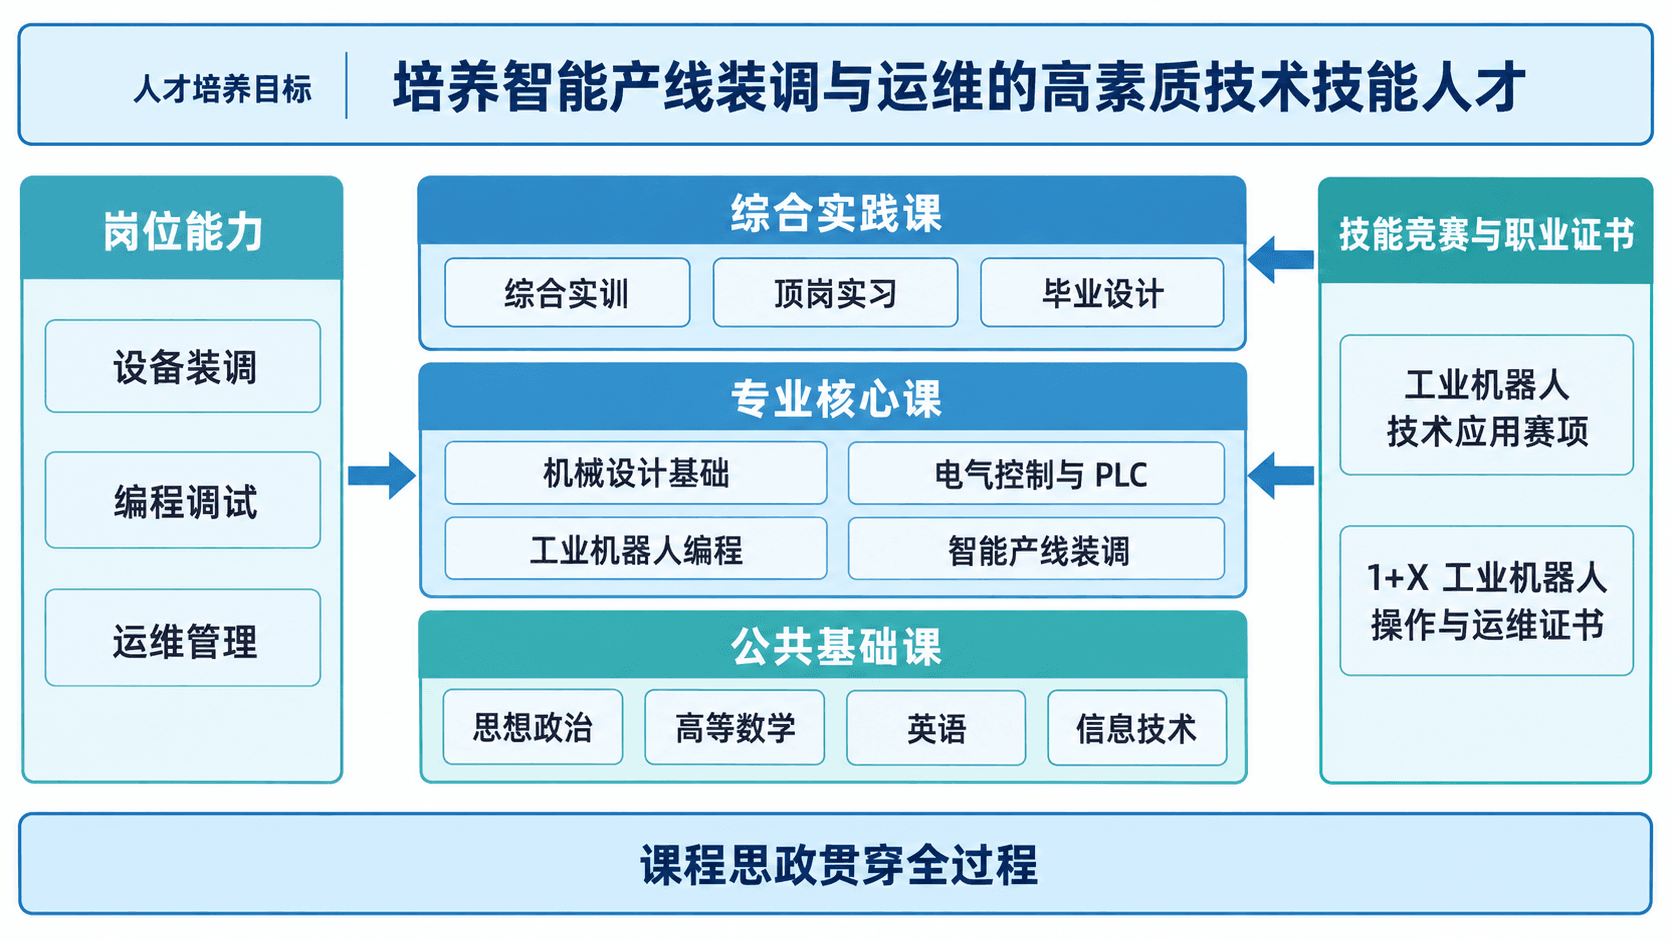
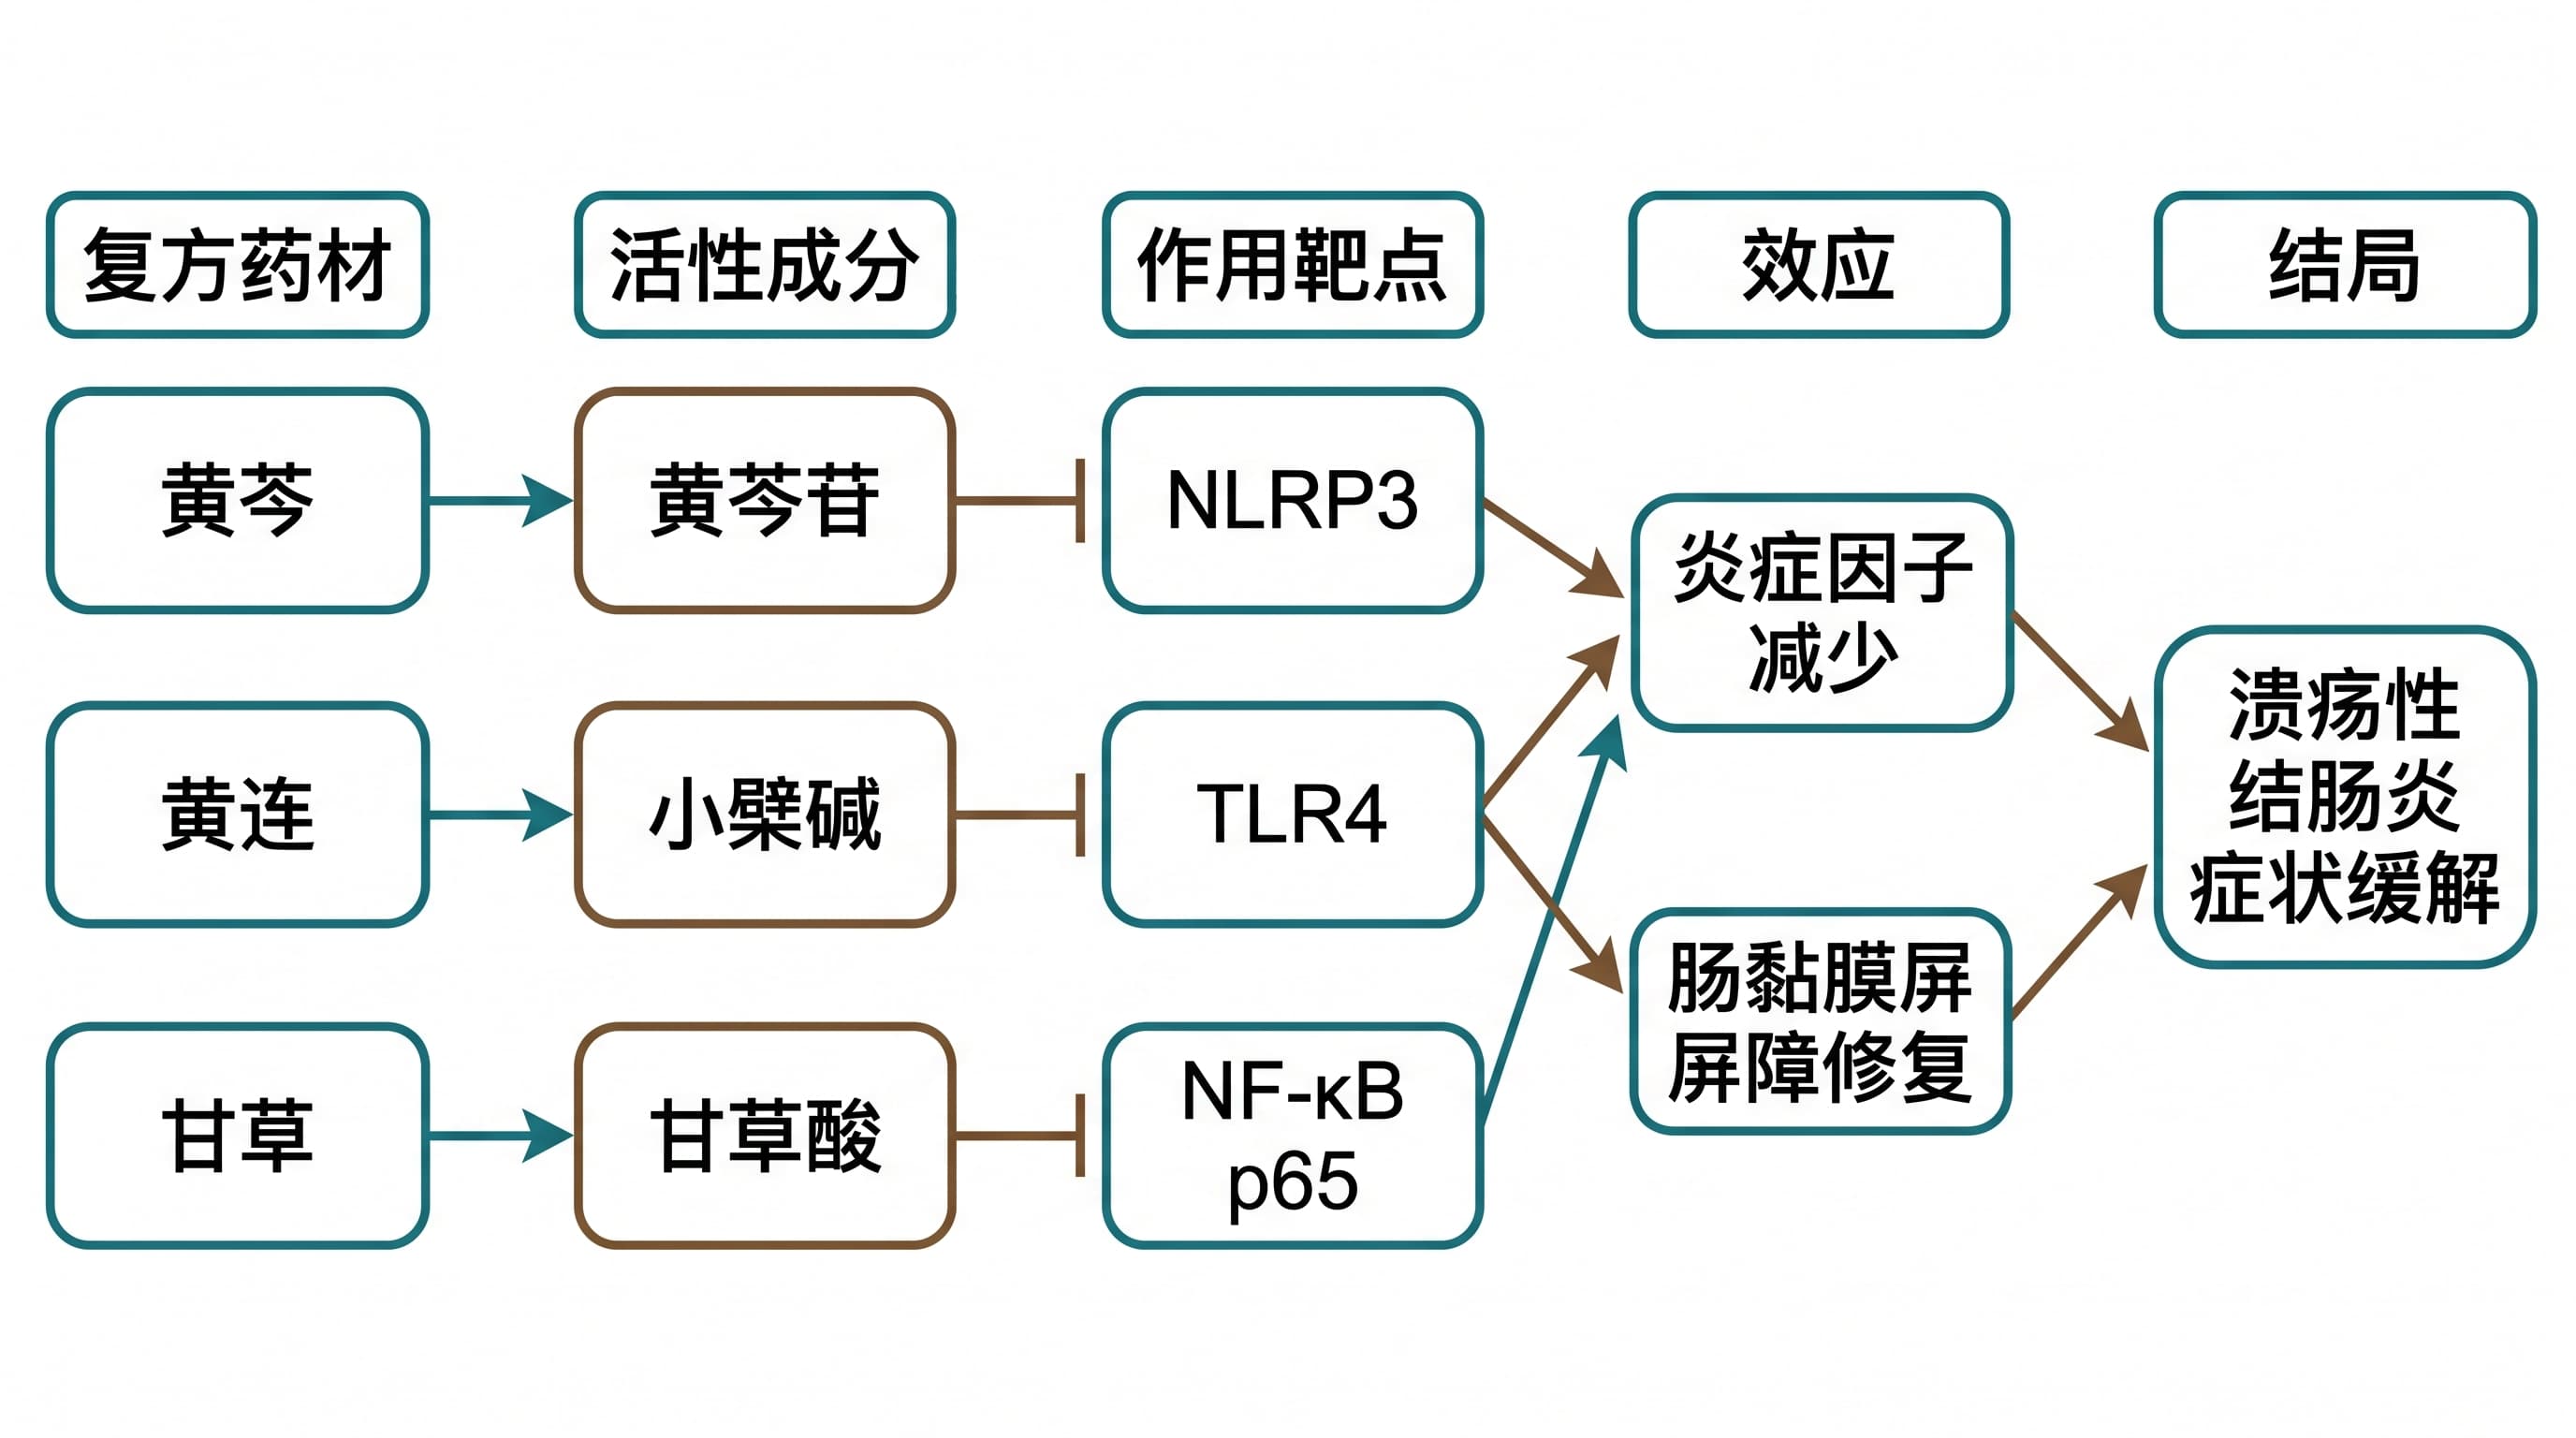
The example images are labelled in Chinese and are structural examples only. The components, targets and pathways shown are illustrative and must be replaced with what your own data and literature support.
Which figures a TCM project usually needs
| Figure | Where it goes | What it answers |
|---|---|---|
| Multi-component, multi-target, multi-pathway mechanism diagram | Discussion of a paper; background of a proposal | Which components act on which targets and pathways |
| Network pharmacology workflow | First figure of the methods | How the targets were screened, and with which databases |
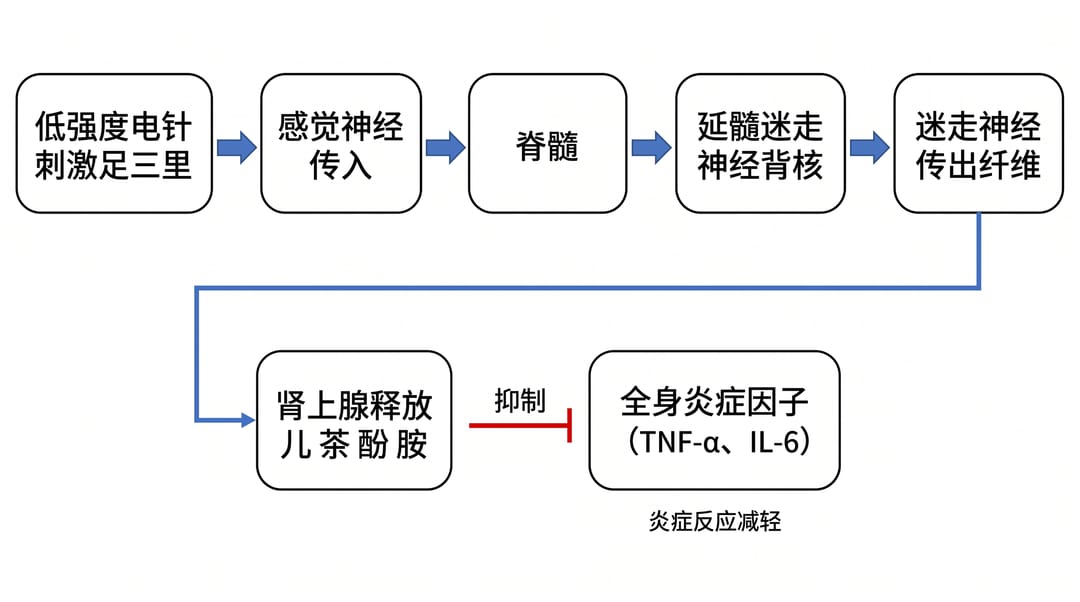
| Acupuncture pathway schematic | Discussion; background of a proposal | How stimulation at an acupoint reaches the effector organ |
| Research roadmap | Research plan of a proposal | What is done in what order, and what each step produces |
| Hypothesis figure | End of the background; aims | The one statement the project sets out to test |
| Graphical abstract | Submitted with the manuscript | Subject, method and main finding at a glance |
Formula mechanism diagram
Structure: four columns from left to right: formula and representative components → core targets → signaling pathways → effect or phenotype, with 3–6 nodes per column. Use solid lines for experimentally verified links and dashed lines for predicted ones. Use pointed arrows for activation and flat-headed (T-bar) arrows for inhibition, and say so in a legend.
Common mistakes:
- Copying every edge from the network analysis, so the figure becomes a tangle.
- One arrow style for everything, so up- and down-regulation look the same.
- Herbs on the left and disease on the right, with no component or target layer between them.
Mechanism diagram of a herbal formula, 16:9 landscape, four columns from left to right, each with a column heading.

Column 1, formula and components: [formula name], with [component A], [component B], [component C]
Column 2, core targets: [target 1], [target 2], [target 3], [target 4]
Column 3, signaling pathways: [pathway 1], [pathway 2]
Column 4, effects: [reduced inflammation], [reduced tissue injury]

Links: [component A] to [target 1] and [target 2]; [component B] to [target 3]; [component C] to [target 4].
[target 1] and [target 2] point to [pathway 1]; [target 3] and [target 4] point to [pathway 2].
[pathway 1] to [reduced inflammation] uses a flat-headed arrow for inhibition; all other arrows are pointed, for activation.
The [component C]–[target 4] link is predicted, so draw it dashed; all other links are solid.
Legend at bottom right: solid = verified, dashed = predicted, pointed = activation, flat-headed = inhibition.
Use only the text I have given. Do not add components, targets or organs that I did not mention.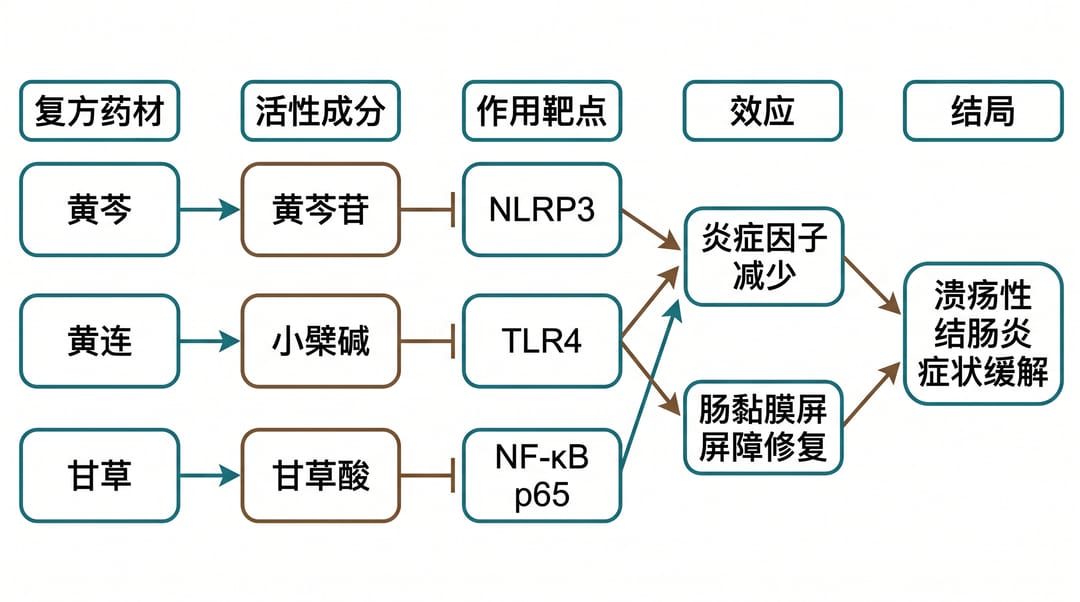
The mechanism figure generator suits this layout. If the figure is about the upstream and downstream molecules of one pathway, use the signaling pathway diagram generator.
Network pharmacology workflow
Structure: eight steps in one row or two: component screening → target prediction → disease targets → intersection → PPI network → GO/KEGG enrichment → molecular docking → experimental validation. Under each step, add the database, software and screening criteria in small type.
Common mistakes:
- Step names only, with no databases or thresholds, so the work cannot be repeated.
- Screenshots of the PPI network or enrichment plots pasted into the workflow. Results belong in their own figures.
- "Experimental validation" sitting at the end with no link to the core targets found earlier.
To prompt for it, list the eight steps with your own databases and thresholds, ask for equal-sized boxes, and state that arrows show sequence only, with no flat-headed inhibition arrows.
Acupuncture pathway schematic
Structure: an outline of the body or the experimental animal on the left, with the acupoint and stimulation method marked. The pathway then runs in order: acupoint stimulation → afferent nerve → central relay → efferent route → effector organ and readouts. Write the stimulation parameters next to the acupoint, draw unverified segments dashed, and use a flat-headed arrow for suppression.
Common mistakes: the acupoint drawn on the wrong side or surface of the limb; unverified segments drawn as solid lines; no stimulation parameters and no sham or non-acupoint control.
Research roadmap
Structure: portrait, five modules from top to bottom: clinical problem and TCM rationale → efficacy testing → material basis and target prediction → mechanism validation → expected outcomes. Label the arrow from target prediction to mechanism validation "hypothesis".
Common mistakes: TCM terms (syndrome, treatment principle) and assays such as Western blot in the same box; modules placed side by side with no visible dependency; every readout listed.
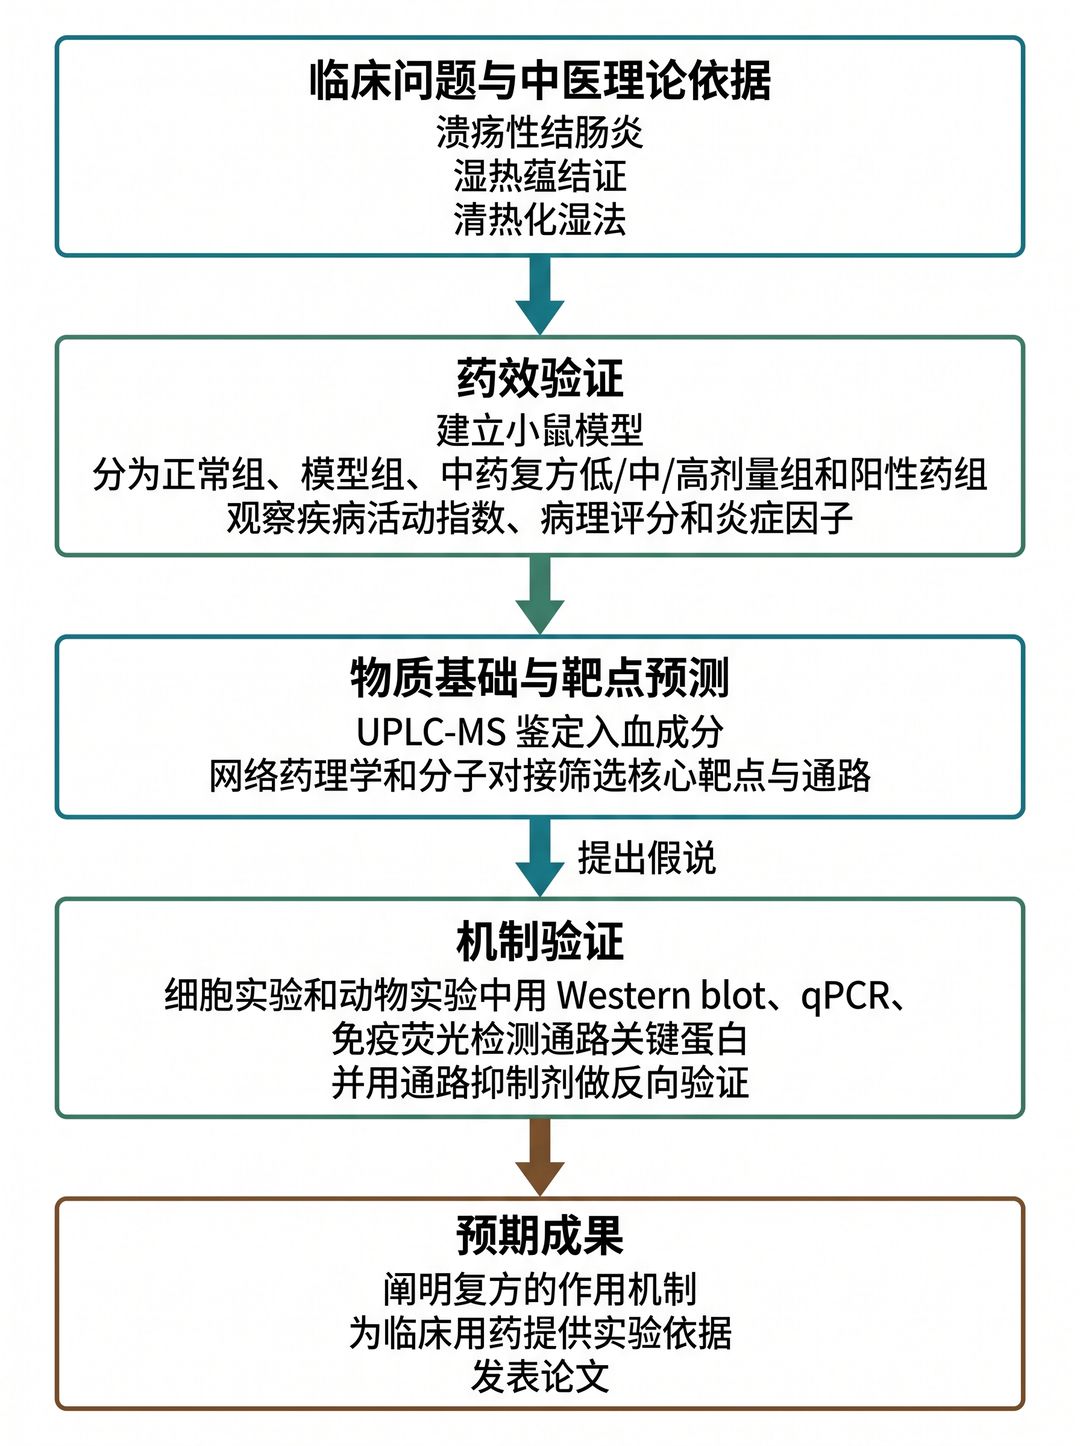
The research roadmap maker has a TCM research template with this structure.
Hypothesis figure
Structure: one figure, one hypothesis. Three parts from left to right: intervention (formula or acupuncture) → key target and pathway → phenotype. Draw links supported by preliminary data as solid lines, and links the project will test as dashed lines with a question mark.
Common mistakes: all solid lines, which turns a hypothesis into a conclusion; three or four pathways in one figure; steps that have no matching experiment in the roadmap.
More layouts are in the scientific hypothesis diagram guide. For a graphical abstract, reduce the mechanism figure to subject, method and finding, and use the graphical abstract maker.
Four pitfalls specific to this field
- Predicted targets drawn as verified results. Draw predicted links dashed and say so in the legend.
- A component–target network too dense to read. Show only core targets; put the full network in the supplementary material.
- TCM terms and modern readouts in one box. Keep them in separate layers.
- Acupoints in the wrong place. Check against a standard acupoint reference.
What to check after generating
An AI-generated figure is a draft. The author has to verify it:
- Every component–target link against your own data and cited literature. Delete any link without support.
- Activation and inhibition symbols, and whether they match the legend.
- Acupoint location and nerve pathway against acupoint and anatomy references.
- Anything added that you did not write, such as an extra target or organ.
Small changes can be made in SciDraw AI by text instruction. New accounts get 10 free credits at sign-up plus 5 per day, and one 2K diagram costs 5 credits.
FAQ
Q1: How is a mechanism diagram different from a hypothesis figure?
A: A mechanism diagram summarizes existing evidence. A hypothesis figure shows the single line the project will test and marks the unverified steps.
Q2: Can I put the exported network directly in the main text?
A: Not when it has many nodes. Use a simplified figure and move the full network to the supplement, if one is allowed.
Q3: How should TCM terms appear in an English figure?
A: Give acupoints with their international codes, follow the target journal's conventions for syndrome and formula names, and keep one form throughout.
Q4: Which export format is easiest to edit later?
A: PNG is enough for a Word document. To change text or colors later, export SVG (10–15 credits) or PPTX (10 credits) and continue in your own software.
Summary
Before drawing, decide whether the figure shows existing evidence, predictions or a hypothesis to test, how many columns or layers it has, and which arrows mean inhibition. Then adapt the prompt, replace the bracketed text, and check the draft link by link.