Free Dendrogram Maker
Create a hierarchical clustering tree from plain text
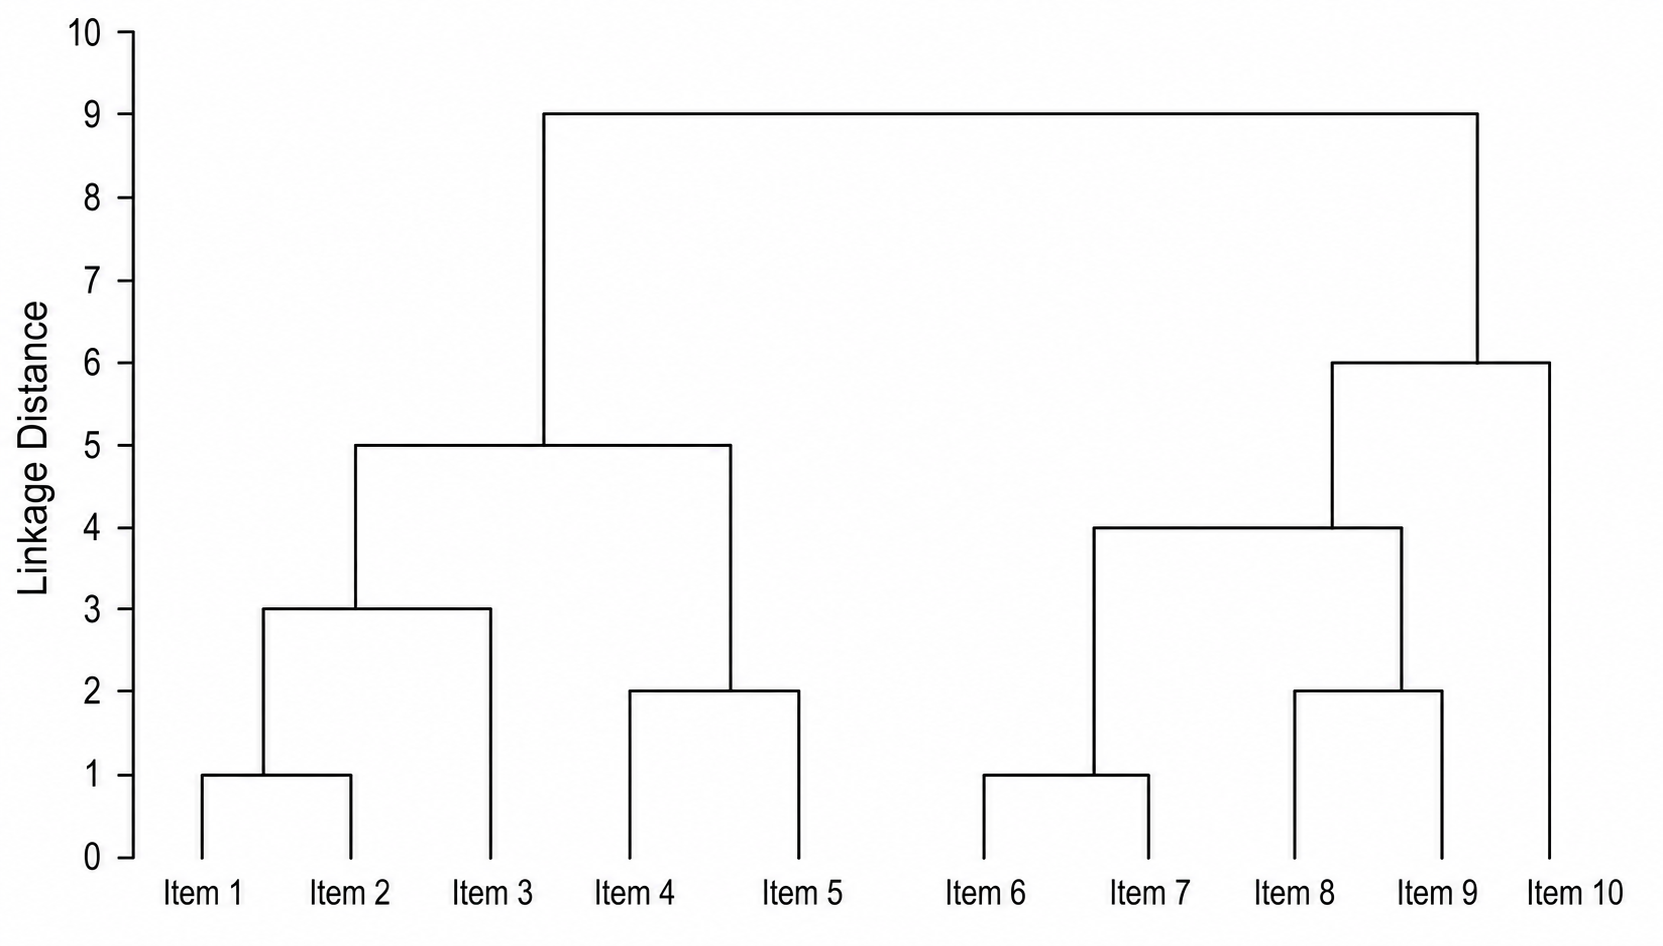
Describe the items you clustered, the distance or linkage between them, and the clusters you want shown, and AI draws a clean, labeled dendrogram with a linkage-distance axis — ready for statistics homework, clustering analysis, and research papers.
Dendrogram examples
Click any example to load its prompt, or use it as a starting point for your own dendrogram.
What is a dendrogram?
A dendrogram is a tree diagram produced by hierarchical clustering that shows how individual items are successively merged into clusters. The height at which two branches join is the linkage distance between those clusters, so branches that meet low down represent more similar items and branches that meet high up represent more distant ones. This dendrogram maker turns a plain-text description into a clean, labeled hierarchical clustering tree — you describe your items, the distances or clusters, and any cut line, and the AI produces a properly proportioned figure with a linkage-distance axis, labeled leaves, and optional colored clusters, all without spreadsheets or coding.
Why use a dendrogram maker
- Dendrograms are the standard way to show hierarchical clustering structure and how items group at different similarity levels.
- Building a publication-quality cluster tree in R, scipy, or seaborn takes linkage code and formatting that distracts from the analysis.
- Students learning hierarchical clustering and linkage understand merges and distance far better from a clearly labeled dendrogram.
- Researchers need quick, presentable cluster dendrograms for slides, lab reports, and papers in genomics, ecology, and taxonomy.
- Changing the items, the number of clusters, or where you cut the tree and regenerating is much faster than editing clustering code by hand.
How to make a dendrogram
Name the items being clustered and describe how they group — which ones are most similar and join first, and which form separate clusters. Then add any visual features you need: a linkage-distance or height axis, branches colored by cluster, a dashed horizontal cut line that defines a number of clusters, a horizontal orientation, or an attached heatmap. Generate the dendrogram, check the leaf labels, the merge heights, and the cluster colors, and refine the description if anything is unclear.
Parts of a dendrogram
- Leaves — the tips of the tree, one per clustered item, each carrying a label such as a sample or species name.
- Branches & nodes — the lines and merge points where two clusters join into one as you move up the tree.
- Distance / height axis — the linkage-distance scale on which each join is placed; lower joins mean more similar items.
- Leaf order — the left-to-right (or top-to-bottom) ordering of leaves chosen so that branches do not cross.
- Colored clusters — optional coloring of the branches into groups after cutting the tree at a chosen height.
- Cut line — a horizontal line across the tree that slices it into a chosen number of clusters.
Dendrogram Maker FAQ
What is a dendrogram?
A dendrogram is a tree diagram produced by hierarchical clustering that shows how individual items are progressively merged into larger clusters. The height at which two branches join is the linkage distance between those clusters, so items that join low down are more similar. Dendrograms are used in clustering analysis, taxonomy and phylogenetics, and as the row or column tree of a clustered heatmap.
How do I read the height or distance axis?
The height axis (the vertical scale on a standard dendrogram, or the horizontal scale on a sideways one) shows the linkage distance at which two clusters were joined. The lower two branches meet, the more similar those items or groups are; the higher they meet, the more dissimilar. Comparing join heights tells you which groupings are tight and which are loose.
How do I decide the number of clusters by cutting the tree?
You choose a height on the distance axis and draw a horizontal cut line across the dendrogram. Every branch the line crosses becomes one cluster, so a lower cut yields more, tighter clusters and a higher cut yields fewer, broader ones. A common heuristic is to cut just below the largest vertical gap between successive merges, where the tree's structure suggests a natural number of clusters.
What is hierarchical clustering and linkage?
Hierarchical clustering builds the tree by repeatedly merging the two closest clusters, starting from each item on its own (agglomerative, bottom-up). Linkage is the rule that defines the distance between two clusters — for example single linkage uses the nearest pair of points, complete linkage the farthest pair, average linkage the mean distance, and Ward's method the increase in within-cluster variance. The linkage choice sets the join heights and the overall shape of the dendrogram.
Is the dendrogram maker free?
Yes, you can start for free. Create an account and you receive free credits to generate dendrograms right away, with paid plans available if you need to make many hierarchical clustering trees and cluster diagrams on a regular basis.
Can I use it for research and teaching?
Absolutely. The dendrograms are well suited to research papers, slides, and lab reports in fields like genomics, ecology, and taxonomy, as well as for teaching hierarchical clustering and linkage in statistics and data-science classes. Generate a labeled cluster tree for the exact items and clustering your study or lesson covers.
Explore More Tools

Histogram Maker
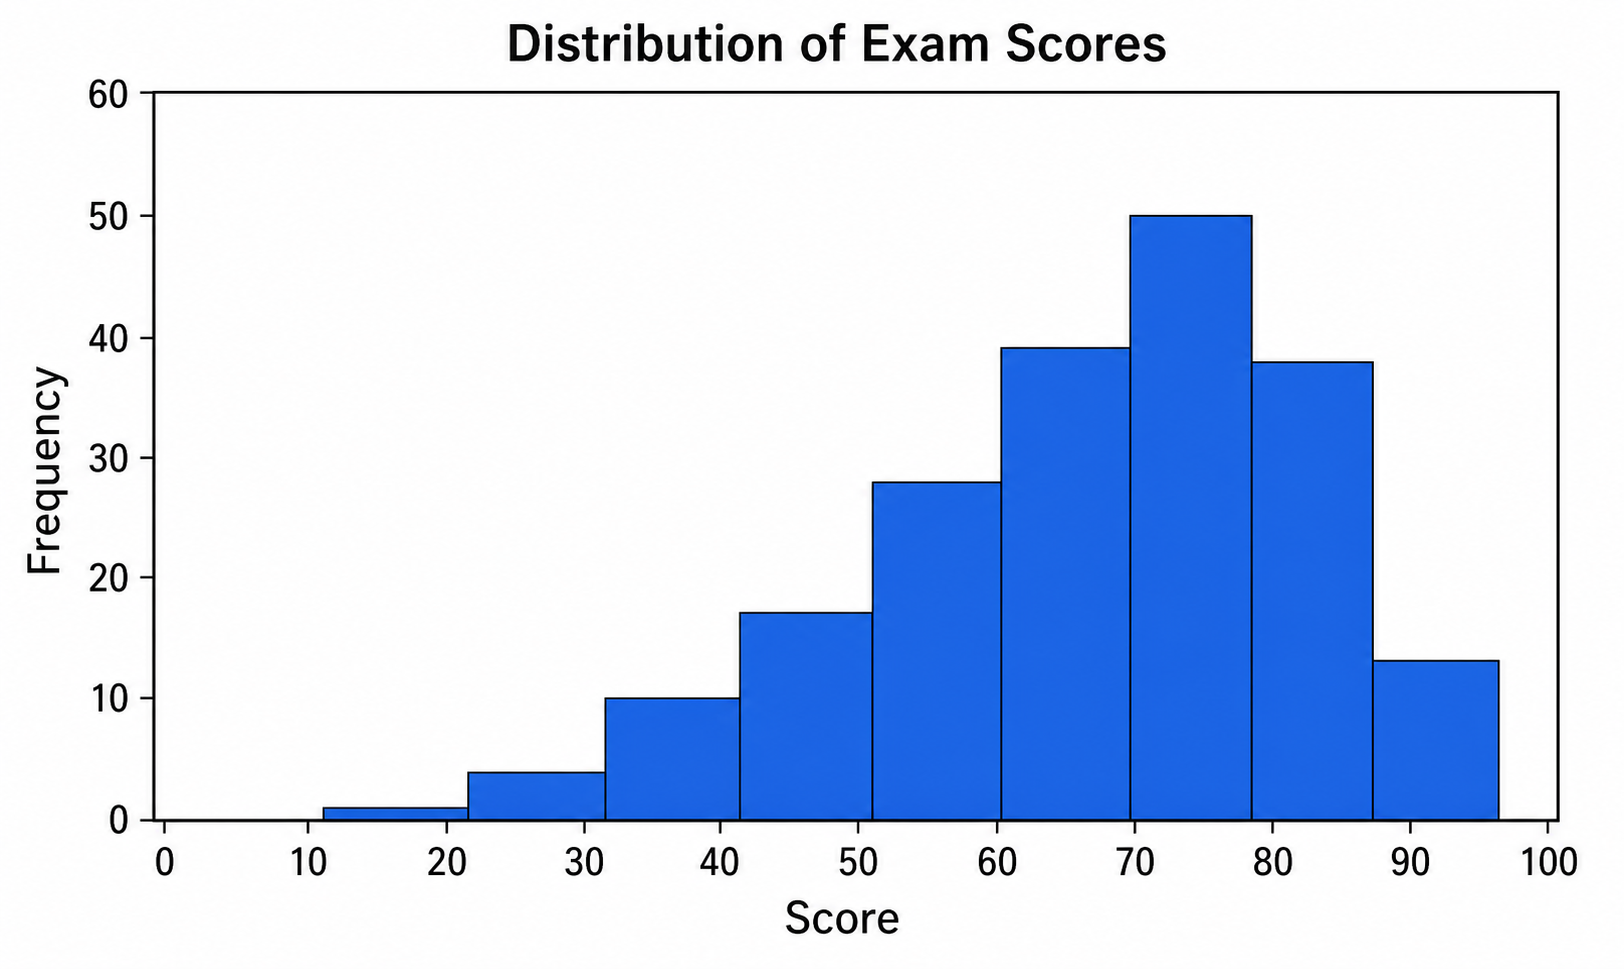
Turn data and bins into a clean, labeled frequency histogram with an optional normal curve.
Try it free
Box Plot Maker
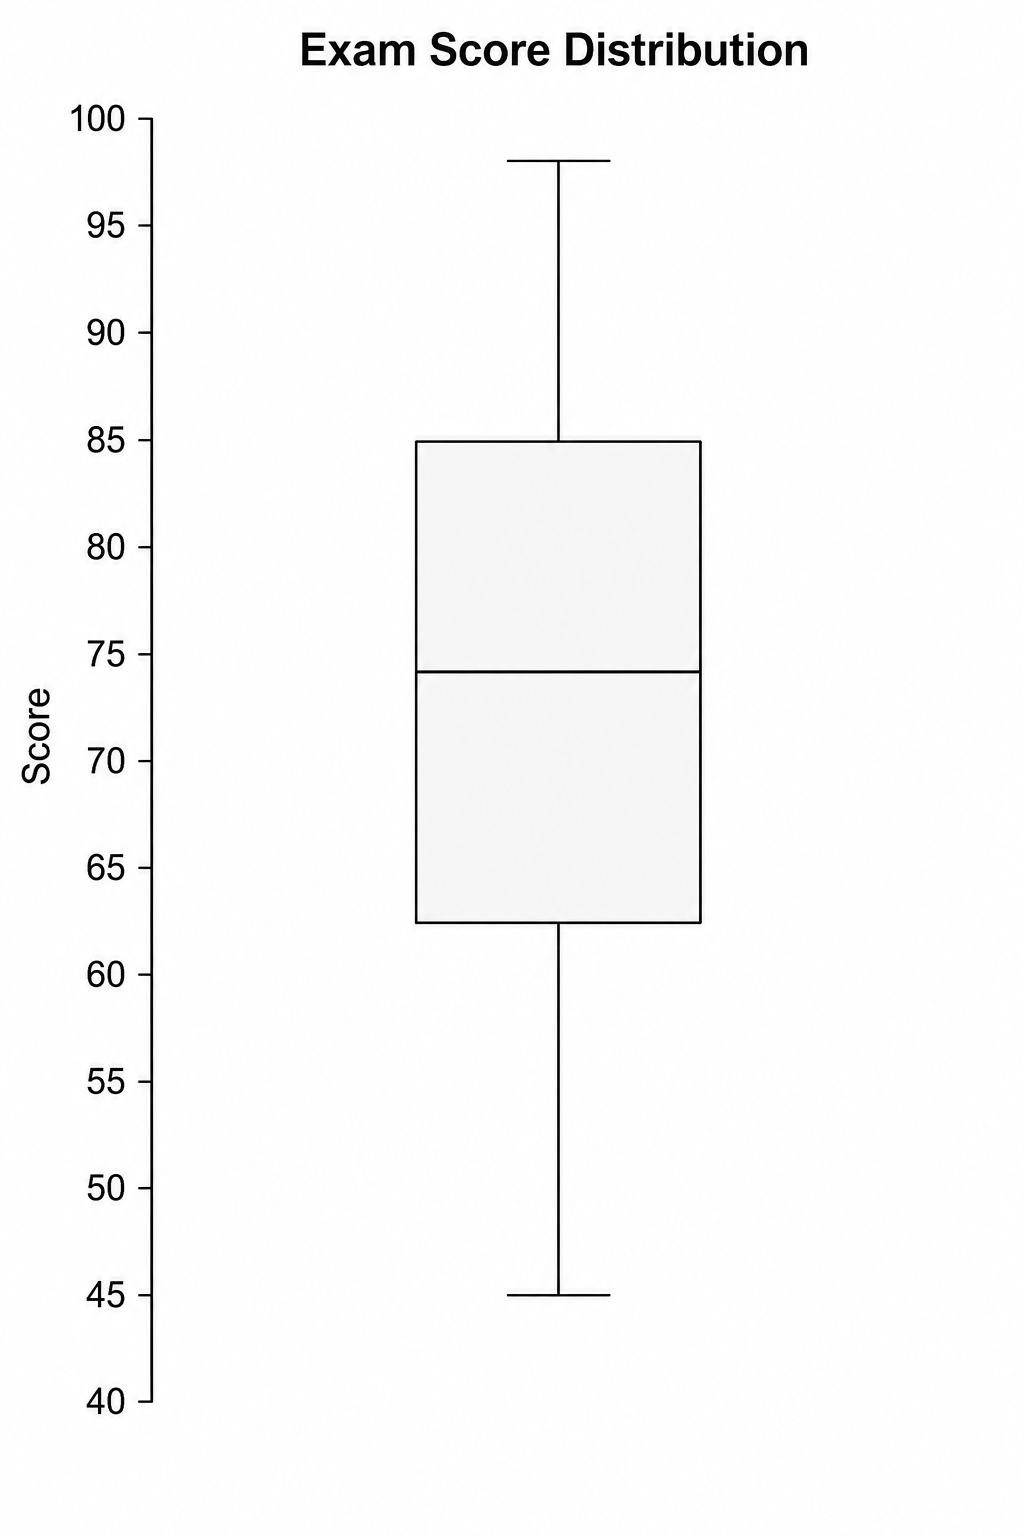
Generate clean, labeled box-and-whisker plots with quartiles, whiskers, and outliers from a plain-text description.
Try it free
Violin Plot Maker
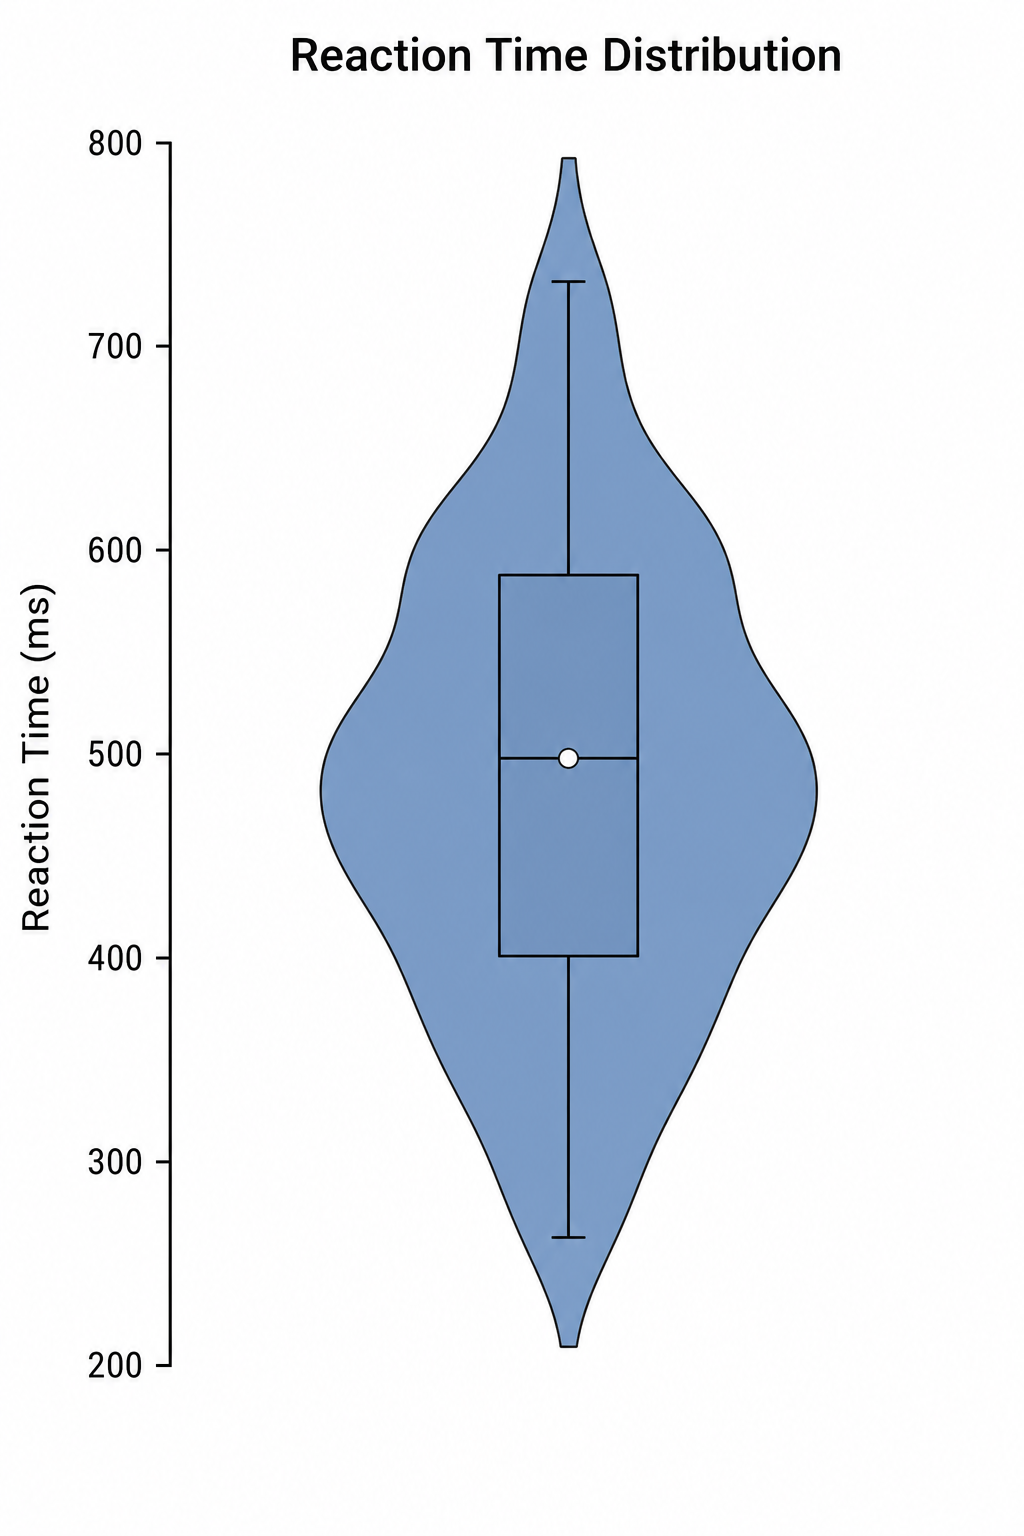
Create labeled violin plots with inner box plots and density shapes from a plain-text description.
Try it freeDraw your dendrogram now
Describe the items you clustered and the groups you want shown, and get a clean, labeled hierarchical clustering tree in seconds. Start free with SciDraw AI.