Blog
Latest news and updates from our team
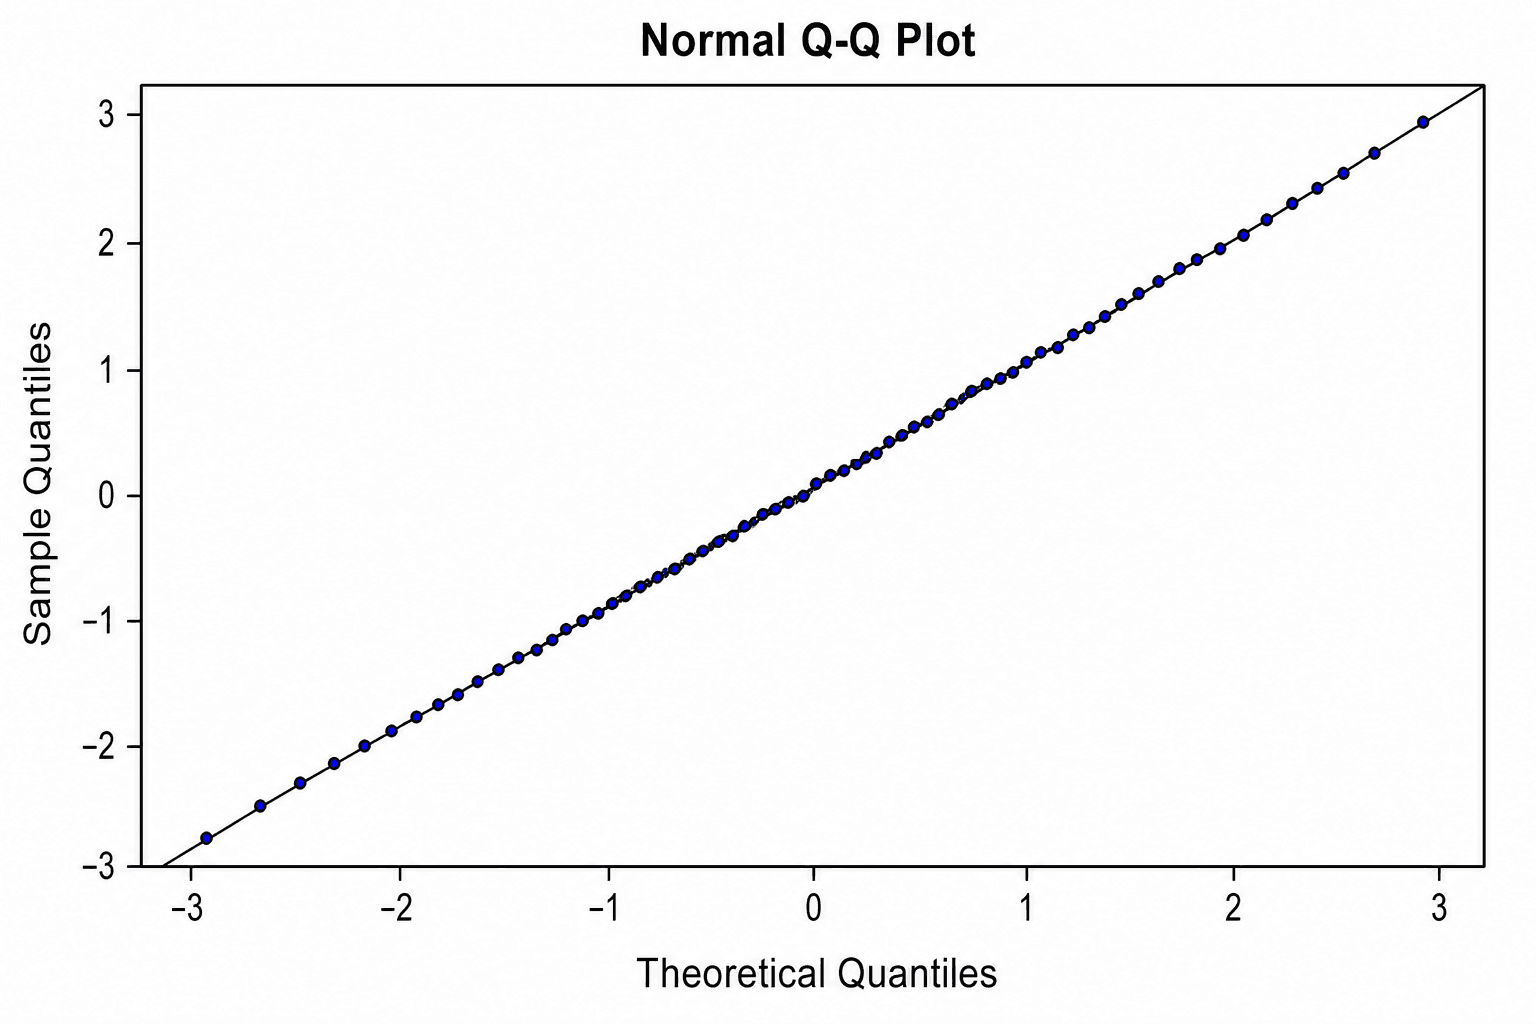
How to Make and Interpret a Q-Q Plot from CSV or Excel Data
Create a Q-Q plot from CSV or Excel without coding. Prepare observed and theoretical quantiles, inspect tails and confidence bands, and edit in SciVis.

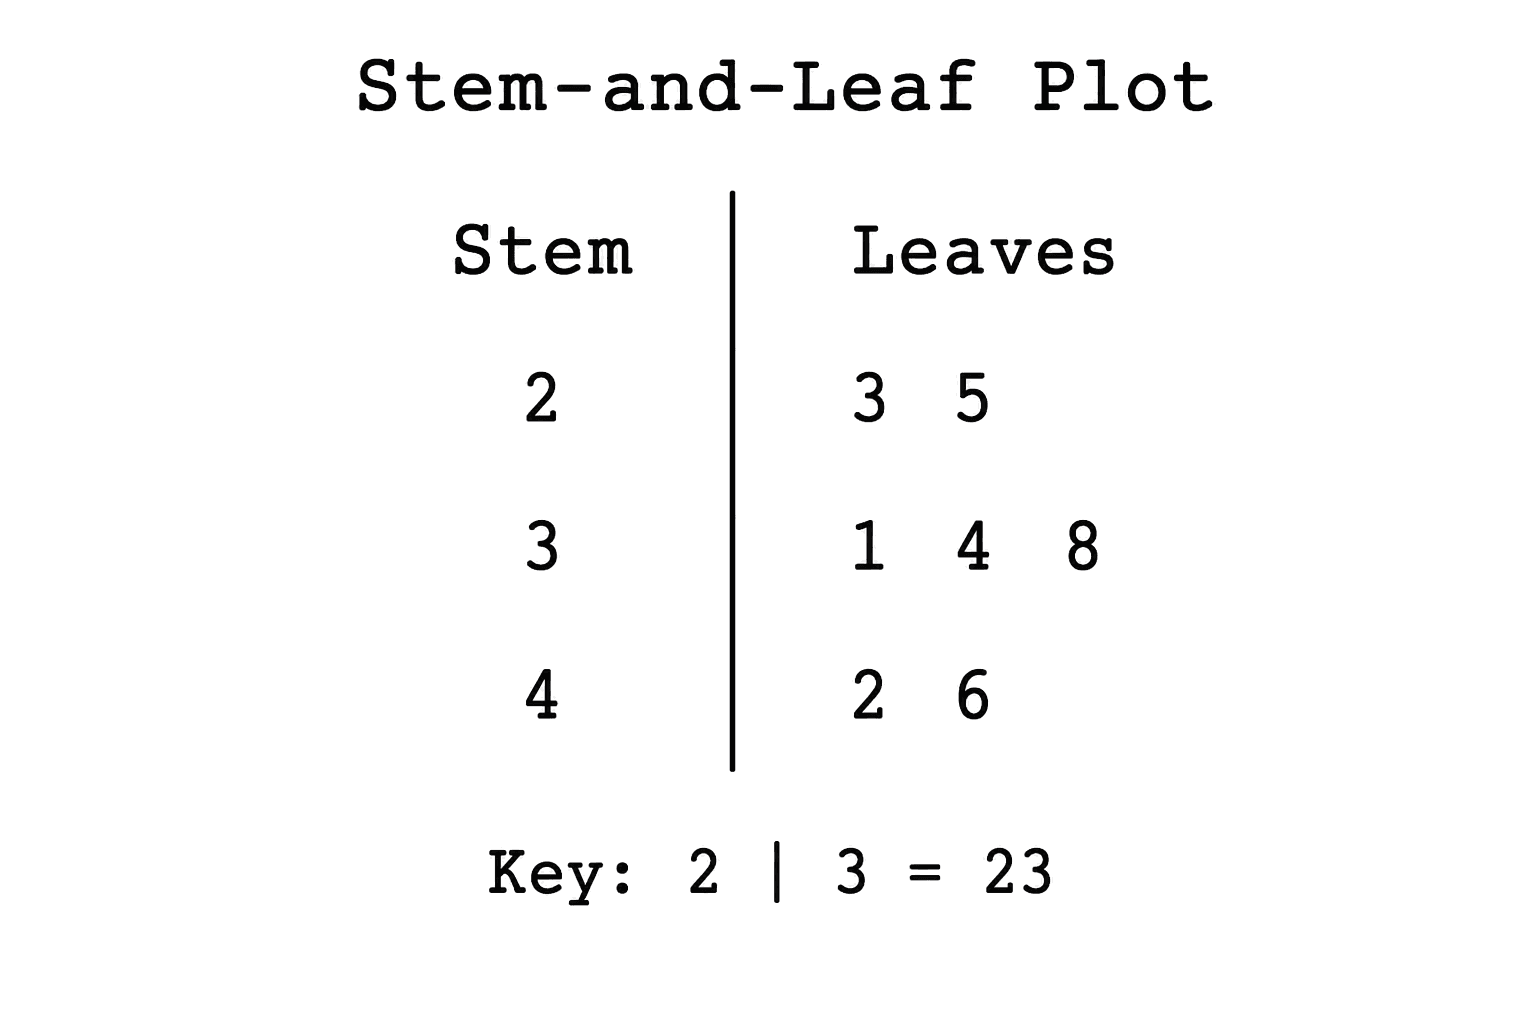
How to Make a Stem-and-Leaf Plot from CSV or Excel Data
Create a stem-and-leaf plot from CSV or Excel without coding. Choose a stem unit, keep a readable key, compare groups, and edit the figure in SciVis.
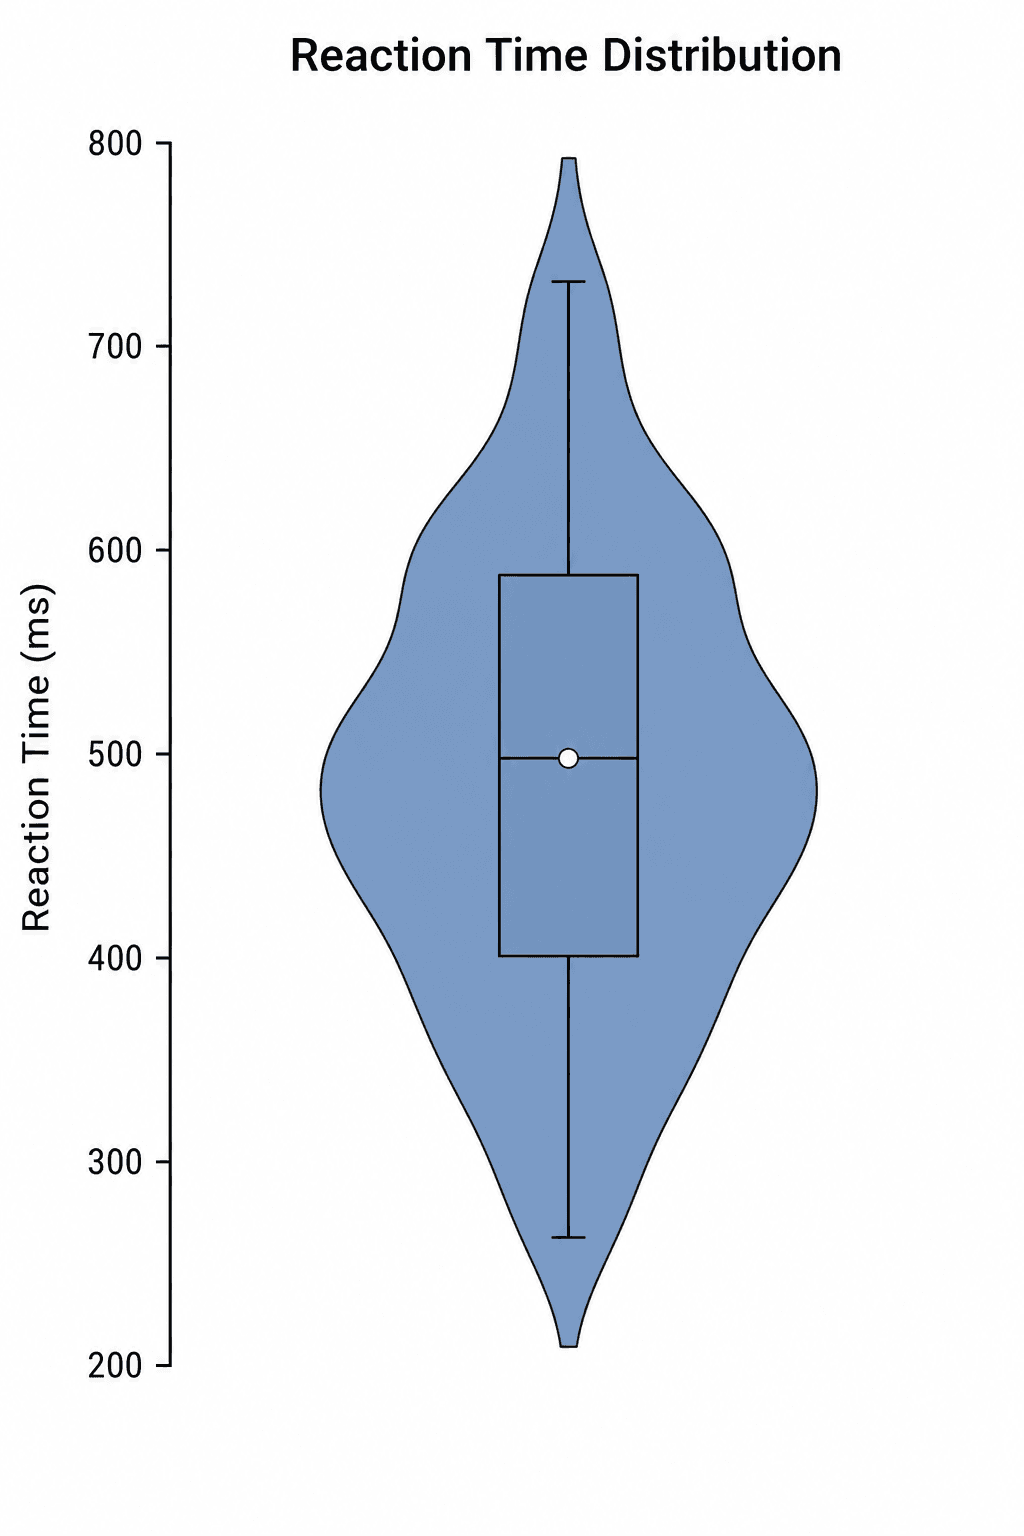
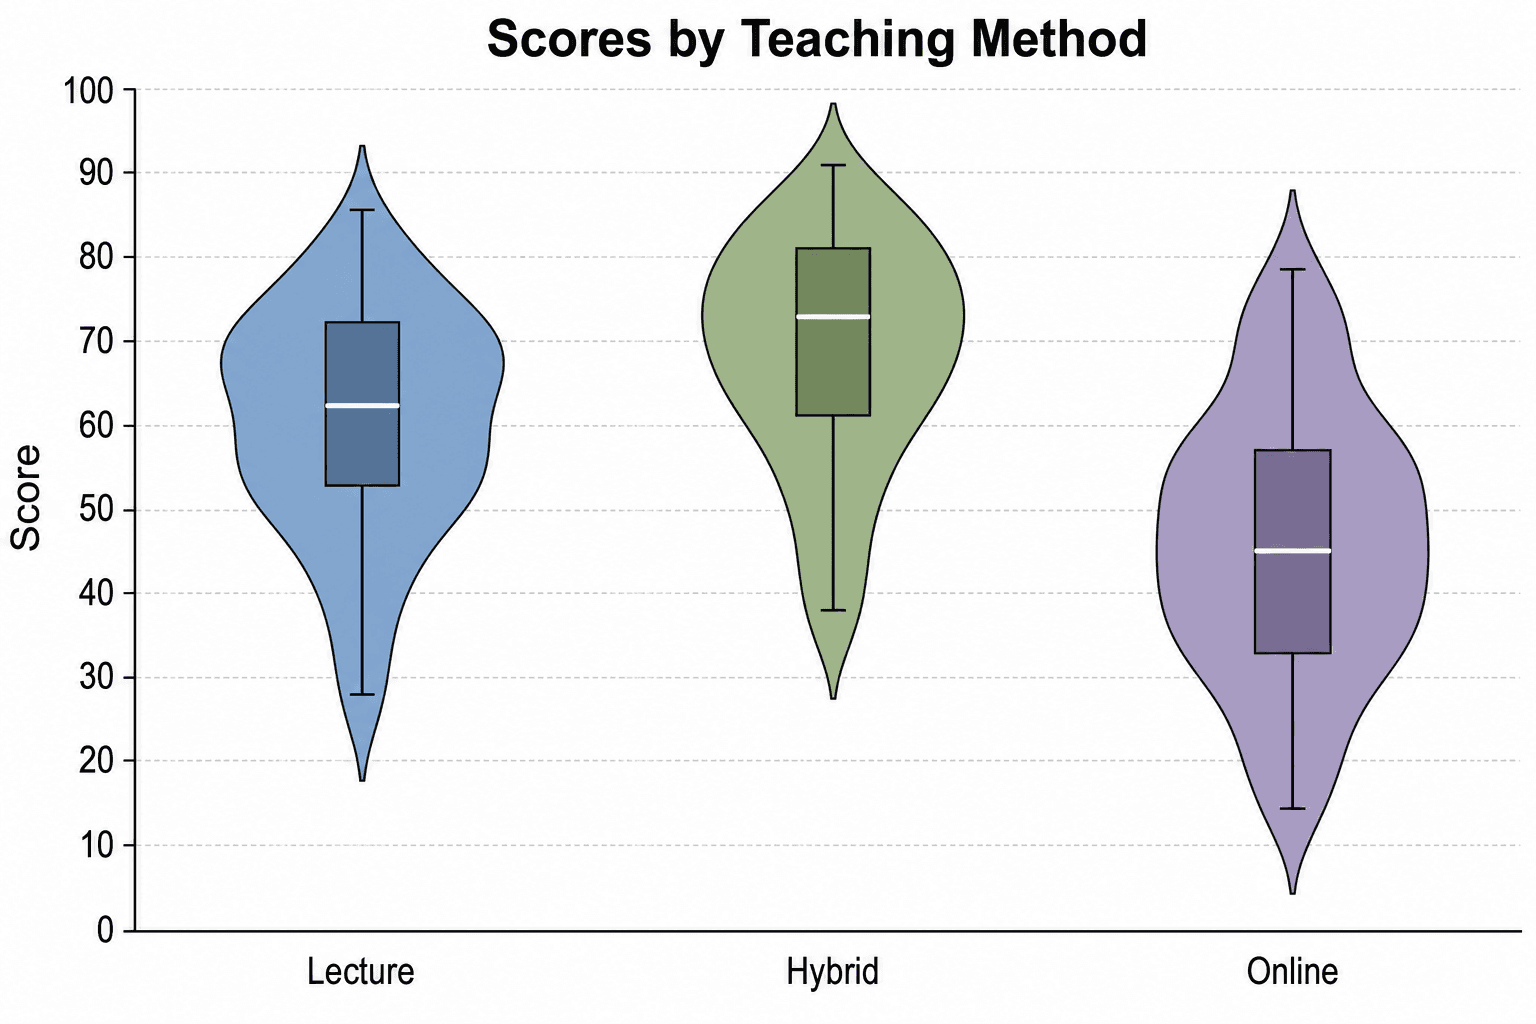
How to Make a Violin Plot from CSV or Excel Data
Create a violin plot from CSV or Excel without coding. Structure group and value columns, set density options, show raw points, and edit in SciVis.
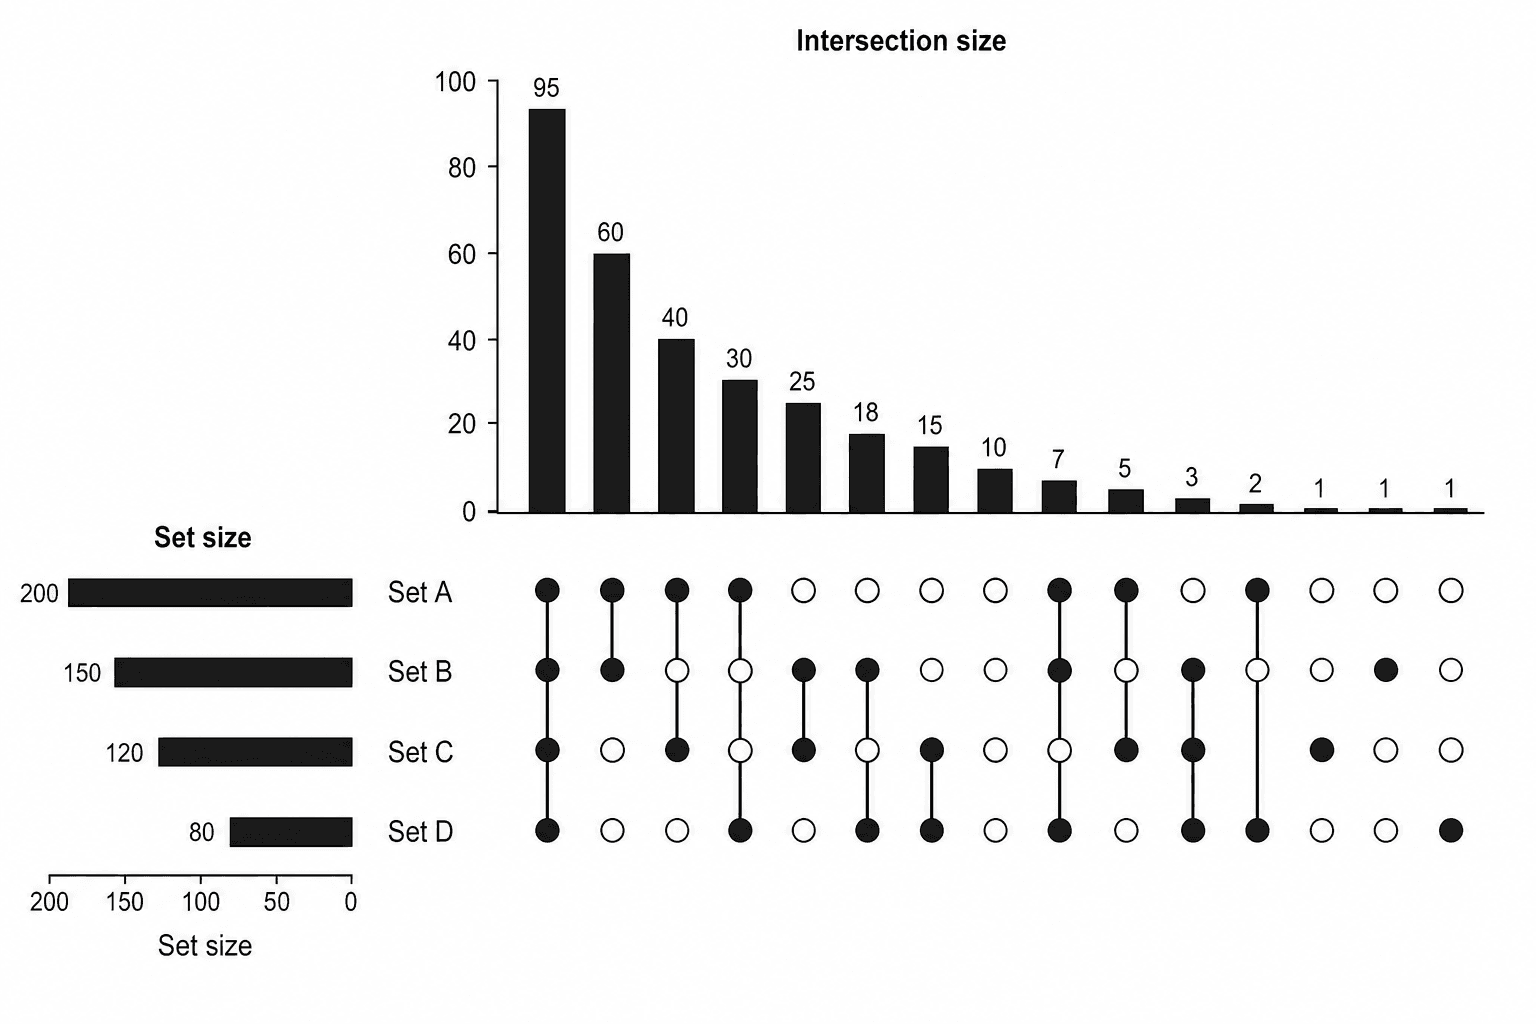
How to Make an UpSet Plot for Set Intersections
Create an UpSet plot from CSV or Excel. Encode set membership, read intersection bars and the dot matrix, highlight overlaps, and edit in SciVis.
6 OriginPro Alternatives for Scientific Plotting in 2026
Compare OriginPro alternatives for scientific plotting, statistics, reproducible analysis, and no-code charts, with current pricing and workflow tradeoffs.
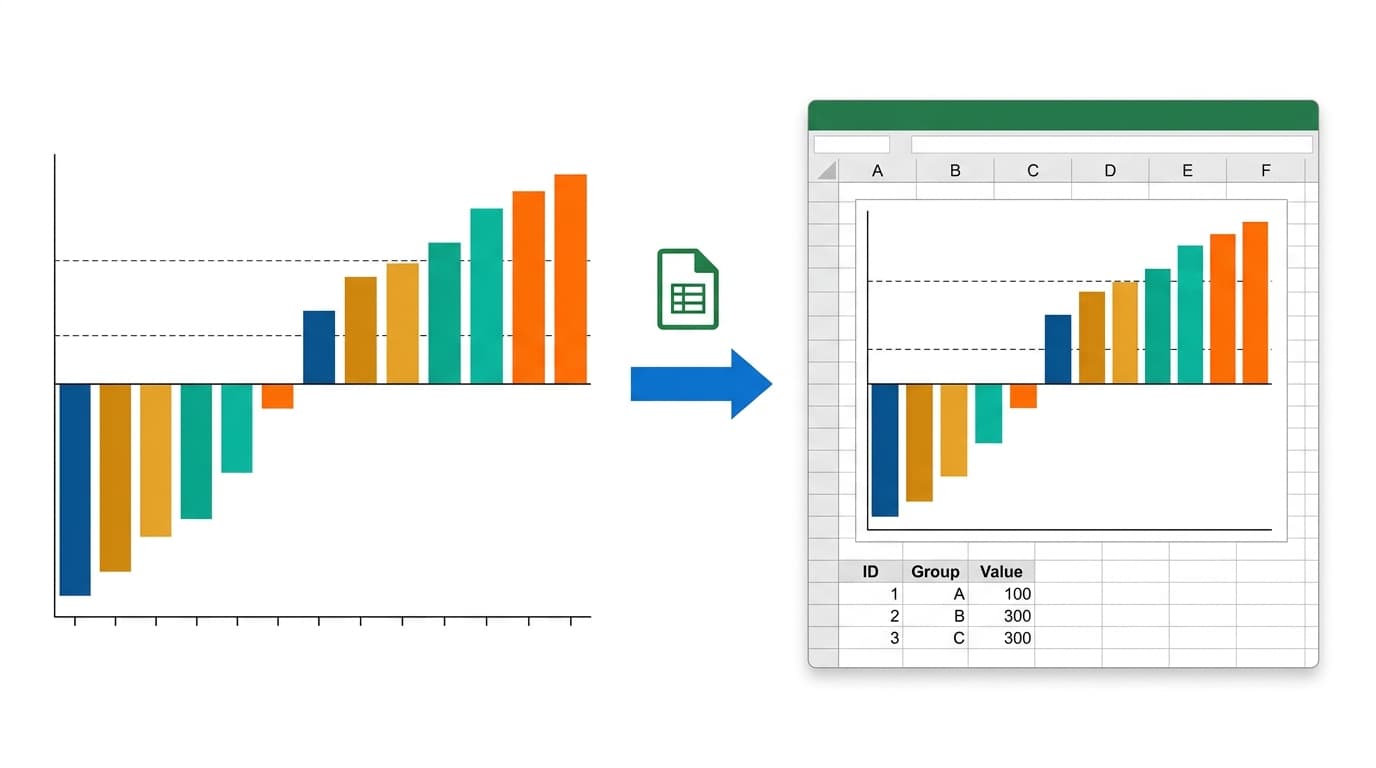
Export Any Scientific Chart to an Editable Excel File (.xlsx)
Turn AI-generated charts into native, editable Excel workbooks — chart, plotted data, and full source data in one .xlsx. Waterfall plots, volcano plots, ROC curves and 25+ more types.