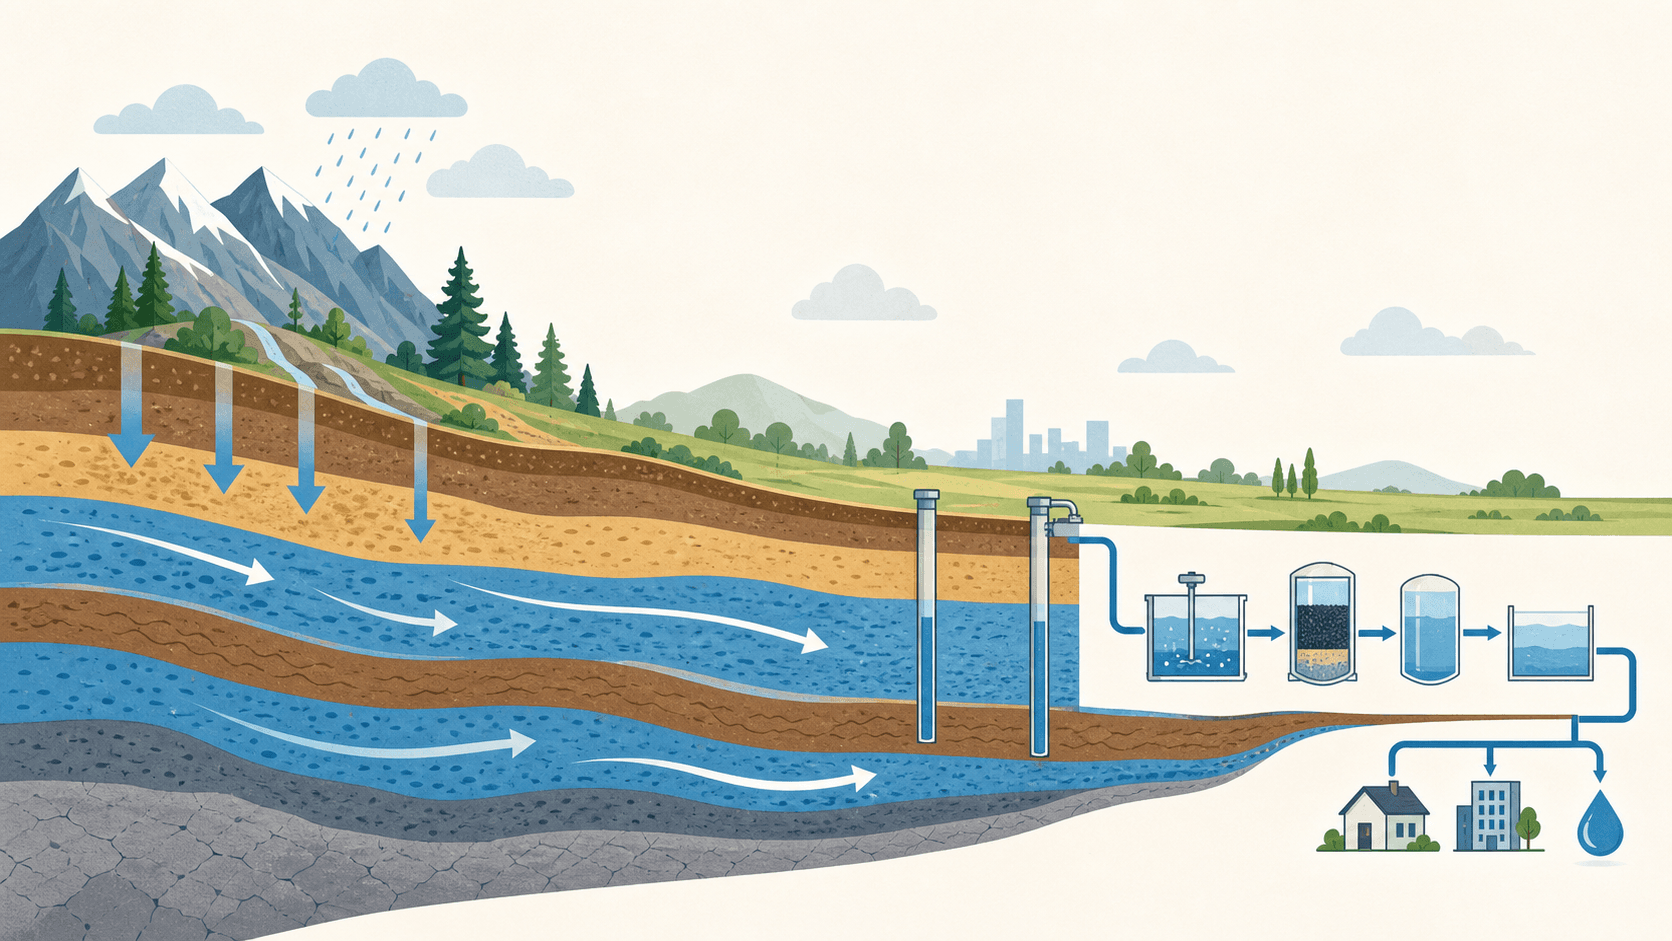
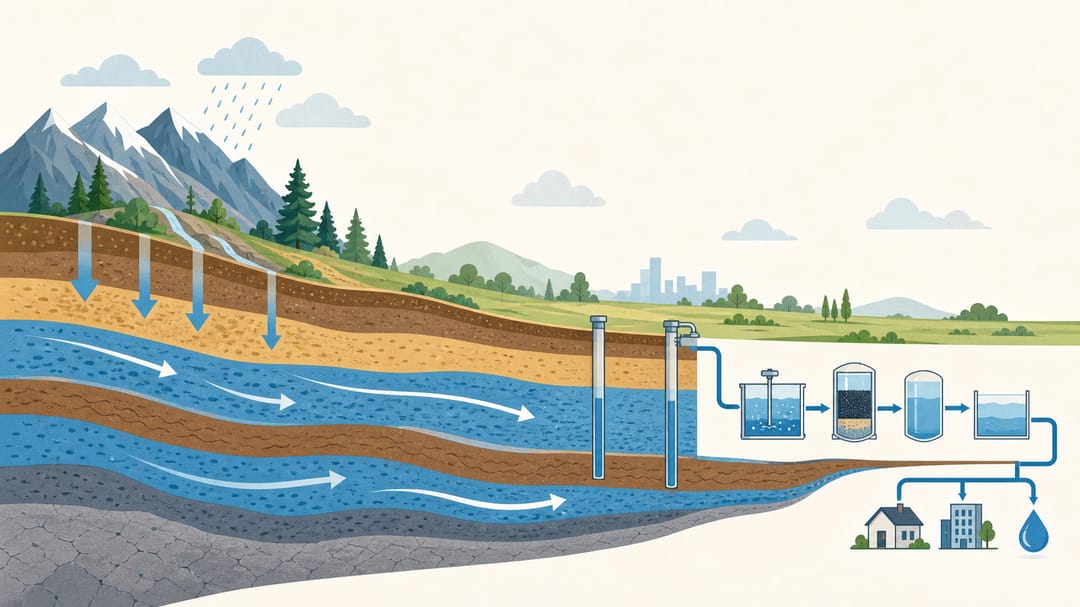
A hydrogeological cross-section does something no table of borehole logs can: it lets a reader see where water comes from, where it goes, and what stands in its way. From a mountain front sloping down to an alluvial plain, the section shows how coarse gravels grade into finer sediments, where aquifers pinch out against an aquitard, and which direction the water table falls. Get that picture right and a geologist, a regulator, and a civil engineer can all reason about the same site without arguing over the prose.
This guide covers two families of diagram that environmental and geotechnical work depends on: geological cross-sections that show groundwater in the subsurface, and process diagrams that show how water and materials move through an engineered system — treatment trains, remediation schemes, and technical roadmaps. The principles overlap more than you might expect, and getting both right is what makes a report legible.
What a hydrogeological cross-section must show
A good section is a vertical slice through the ground along a chosen line, drawn to scale, that makes the water story obvious. If you are new to sectioning, the fastest way to a clean first draft is to describe the line of section in plain language to the SciDraw AI schematic diagram generator and refine the stratigraphy it lays out.
The load-bearing elements are:
- Topographic surface — the ground profile along the section line, with real vertical exaggeration noted (e.g. 10x) so nobody misreads slope.
- Stratigraphic units — gravels, sands, silts, clays, bedrock — each with a consistent fill or hatch pattern and a legend.
- Aquifers and aquitards — clearly distinguished, because the whole point is which layers transmit water and which confine it.
- Water table or potentiometric surface — drawn as a line, with the direction of the hydraulic gradient marked.
- Flow direction — arrows showing groundwater movement, typically down-gradient from the mountain front toward the plain.
- Boreholes and control points — the wells that constrain the interpretation, with screen intervals shown.
Leave out clutter that belongs in a data table: full lithological descriptions, grain-size percentages, and every minor lens. If a detail does not change how a reader understands flow or confinement, keep it out of the section.
The mountain-front-to-plain section
This is the archetype in basin hydrogeology, and it rewards a deliberate layout.
Put the recharge zone — the mountain front, with steep topography and coarse, permeable material — on the left, and let the plain descend to the right. Show the sediments fining basinward: gravel near the front, grading to sand, then silt and clay under the plain. Mark where a clay aquitard splits an unconfined shallow aquifer from a confined deep one, and show the potentiometric surface of the confined aquifer rising above the confining layer where the head is artesian.
Keep a few rules in mind:
- State the vertical exaggeration. Sections are almost always stretched vertically. Say by how much, and keep it constant across the figure.
- One consistent legend. Every unit gets one pattern, defined once. Do not reuse a hatch for two different materials.
- Show flow, don't just imply it. A single arrow set along the water table communicates gradient direction faster than a paragraph.
- Align boreholes to their true positions along the section line, and project distant wells honestly rather than sliding them onto the line.
From cross-section to process diagram
Once groundwater reaches a well, a stream, or a remediation system, the story becomes a process — and process diagrams follow different conventions. A water-treatment process flow, for instance, reads left to right as a train of unit operations: intake, coagulation, sedimentation, filtration, disinfection, distribution. For laying these out from a description, the SciDraw AI workflow diagram generator handles the boxes-and-arrows structure so you can focus on the engineering.
A clear environmental engineering flow diagram shares the discipline of a good workflow figure — one reading direction, labeled arrows, and no decorative noise. If you have read our experimental workflow diagram guide, the same layout logic applies here: align equivalent stages, label the arrows that carry meaning (flow rate, dose, residence time), and group with whitespace rather than nested boxes.
The engineering technical roadmap is a close cousin. It maps a project or research program over phases — site characterization, feasibility, design, pilot, full-scale — with dependencies and decision gates. Treat it as a workflow with milestones rather than a decorated timeline.
An example prompt you can adapt
When you draft a section or a process flow with AI, describe the structure precisely. Here is a prompt that produces a usable first pass:
Draw a hydrogeological cross-section from a mountain front (left) descending
to an alluvial plain (right), with 10x vertical exaggeration.
Layers, top to bottom:
- Coarse gravel near the mountain front, grading basinward into sand,
then silt, then clay under the plain
- An unconfined shallow aquifer in the upper sand/gravel
- A clay aquitard separating it from a confined deep sand aquifer
- Bedrock basement below
Show:
- Water table as a dashed line sloping down toward the plain
- Blue arrows indicating groundwater flow from recharge zone to plain
- Three boreholes with screened intervals
- A legend for each unit and a labeled vertical exaggeration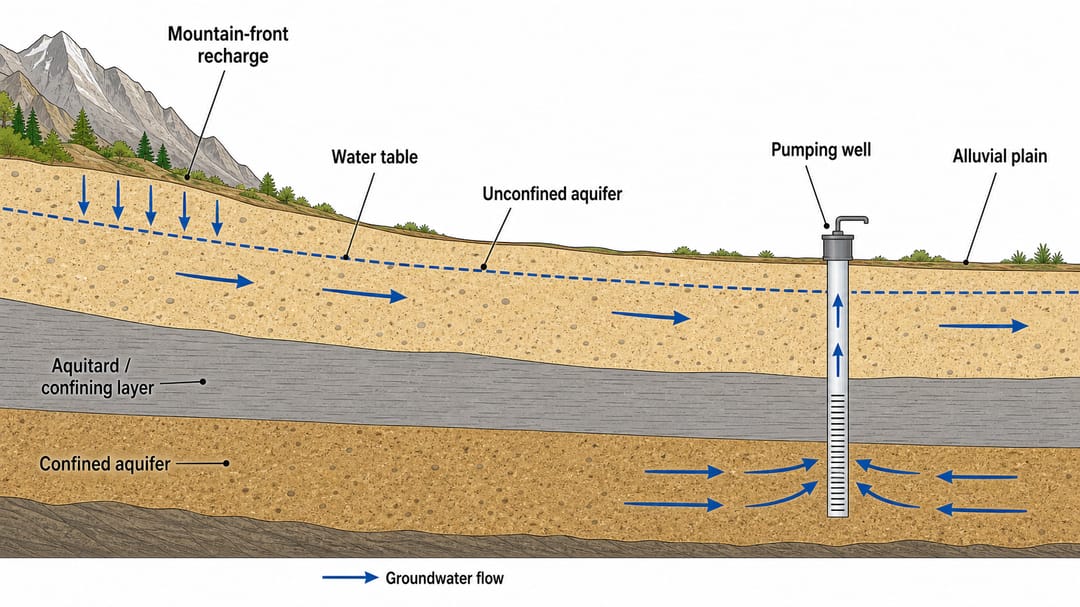 A mountain-front-to-plain hydrogeological cross-section — layered aquifers, water table, and groundwater-flow arrows.
Keep the prompt factual. The tool will place and style the elements; the geology is your call, and you should check every unit boundary and flow arrow against your data.
Common mistakes
- No vertical exaggeration stated. A stretched section without the factor makes every slope a lie.
- Aquifer and aquitard drawn alike. If the confining layer looks like the aquifer, the reader cannot see what confines the water.
- Flow arrows that contradict the gradient. Arrows must point down-gradient; a reversed arrow is a factual error, not a style choice.
- Boreholes floated onto the line. Projecting a well from 500 m away without saying so misleads about control.
- Process flows that loop back ambiguously. Recycle streams in a treatment train need clear, labeled return arrows, or the mass balance reads wrong.
A final checklist
- Can a reader identify each aquifer, aquitard, and the direction of flow from the figure alone?
- Is the vertical exaggeration stated and constant?
- Does the legend cover every pattern used, with no duplicates?
- In the process diagram, is there one reading direction and are recycle streams labeled?
- Do borehole positions and screen depths match the source logs?
A section or process diagram that passes this checklist turns a stack of borehole data into something a whole project team can reason about together. When you are ready to draft one, describe your site or your treatment train to the SciDraw AI schematic diagram generator and refine from there — it gets you past the blank canvas so you can spend your time on the hydrogeology, not the drawing.