網誌
來自我們團隊的最新消息與更新
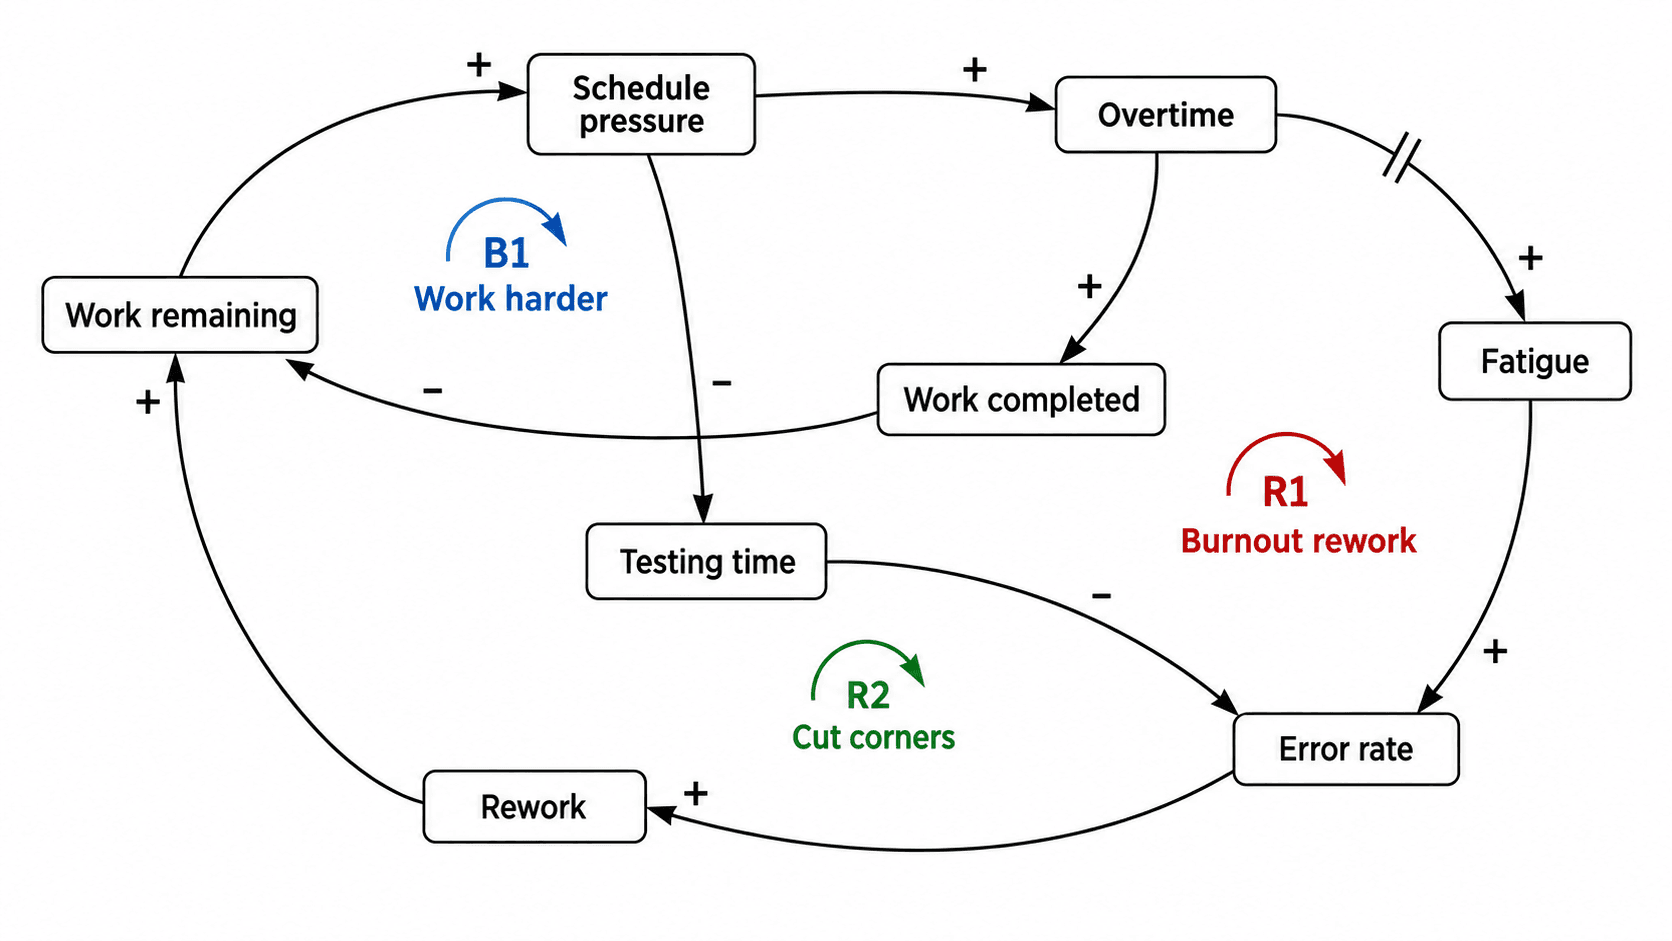
How to Draw a Causal Loop Diagram: Polarity, Reinforcing and Balancing Loops (2026)
A practical guide to causal loop diagrams for system dynamics: choosing variables, assigning + and − polarity, telling reinforcing from balancing loops, marking delays, and writing the loops up in a thesis.

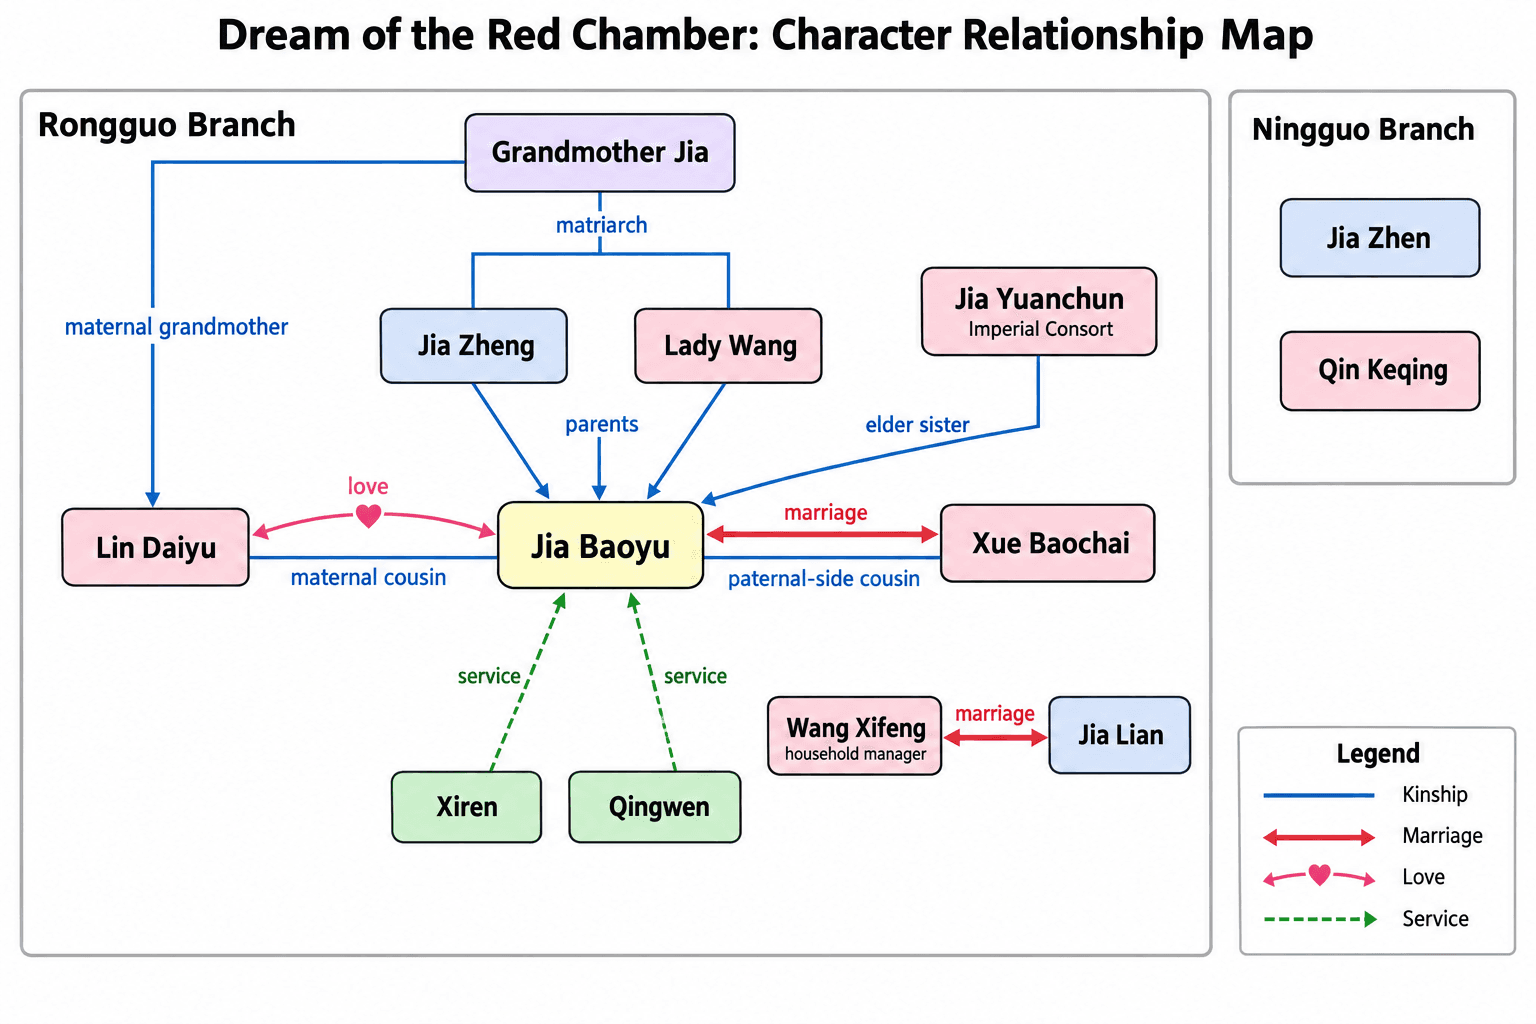
How to Make a Character Relationship Map for a Literature or History Thesis (2026)
How to make a character relationship map for a novel, play, history or film thesis: required elements, a cited relationship table, Pride and Prejudice and Hamlet examples, common mistakes, captions, and AI drafts.
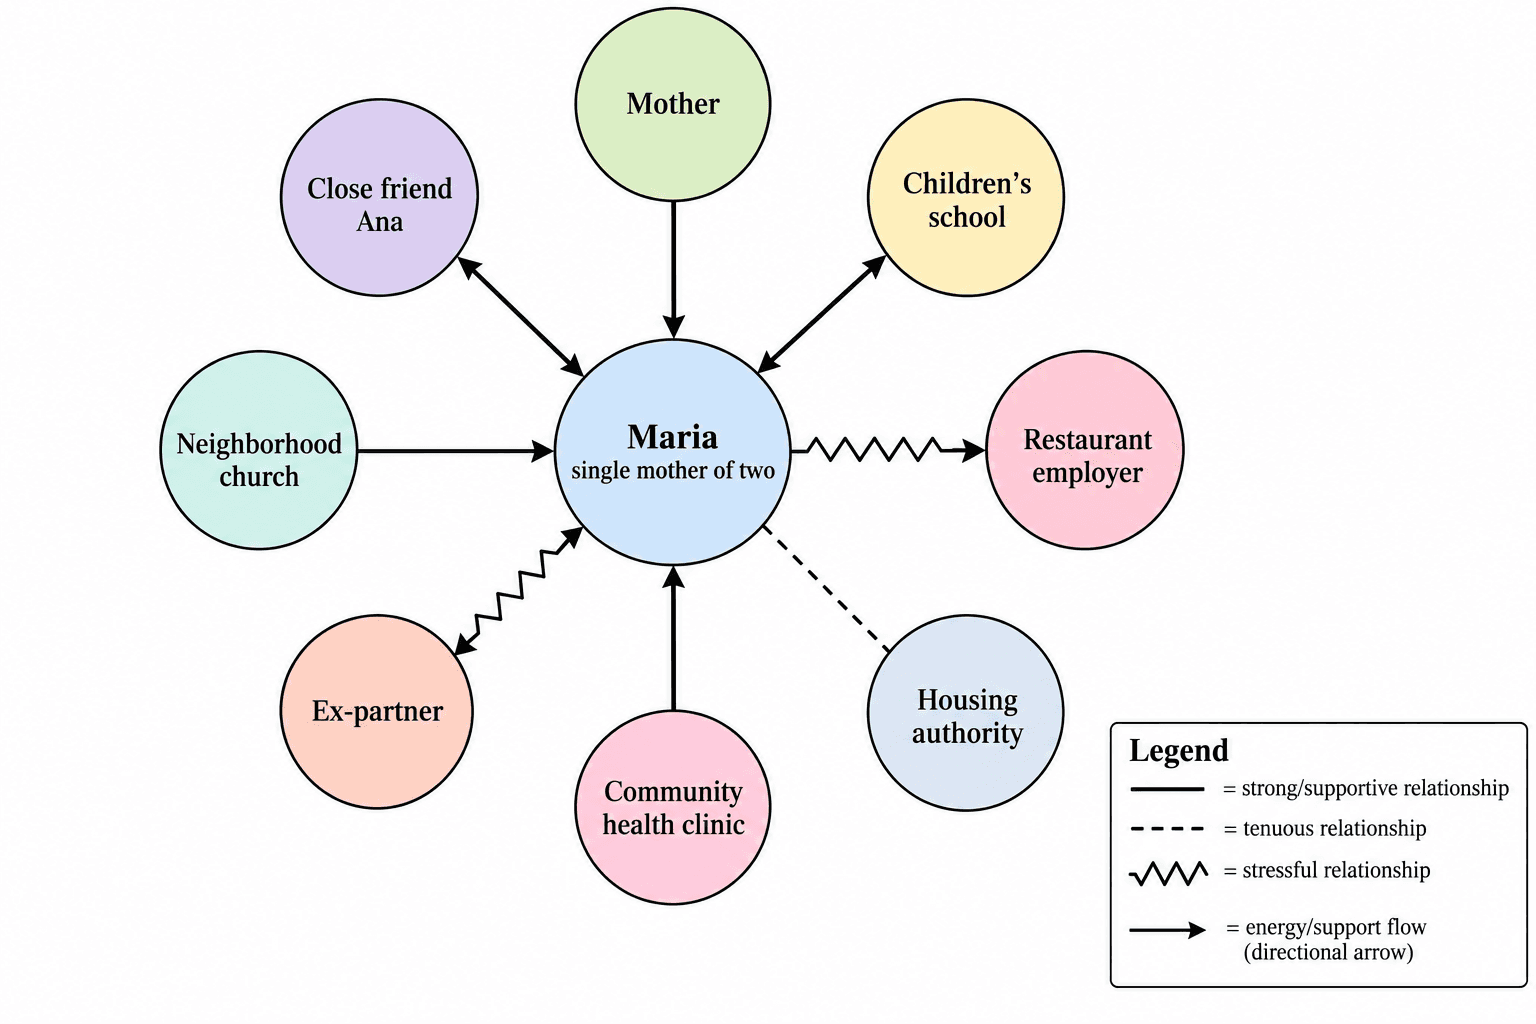
How to Make an Ecomap: Social Work and Nursing Case Assessment (2026)
How to make an ecomap for social work and nursing assessment: line conventions, the legend, ecomap vs genogram, anonymization, and two worked examples.
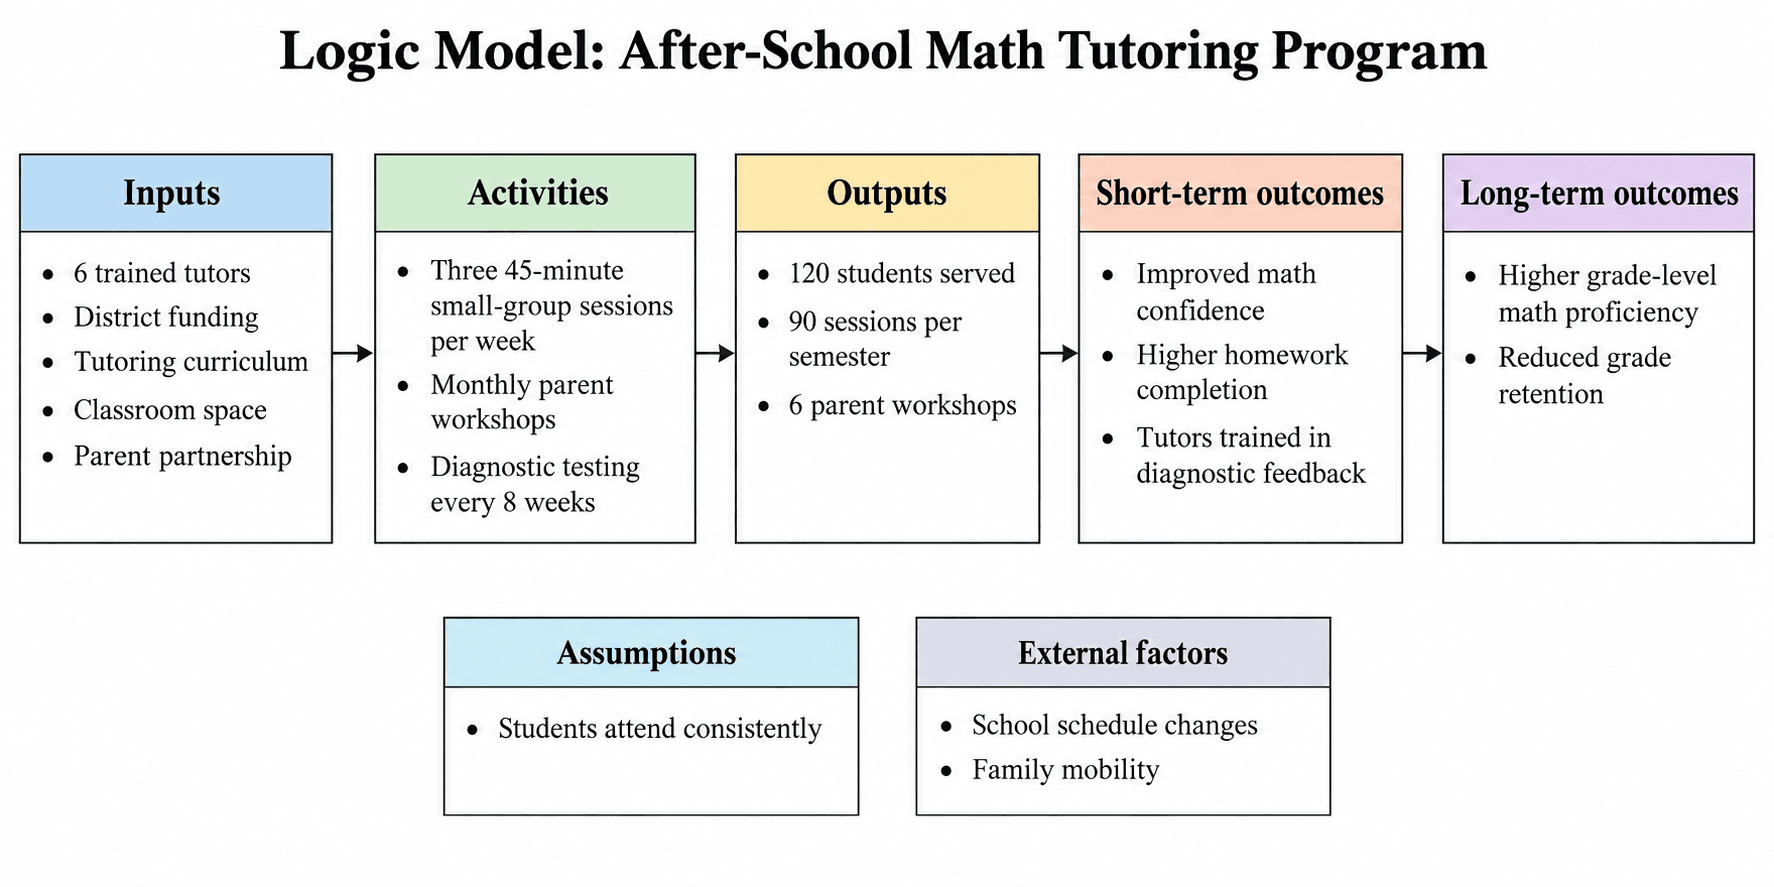
How to Create a Logic Model: Inputs, Activities, Outputs and Outcomes (2026)
How to create a program logic model: the five columns, where assumptions and external factors go, outputs versus outcomes, and a worked logic model example.
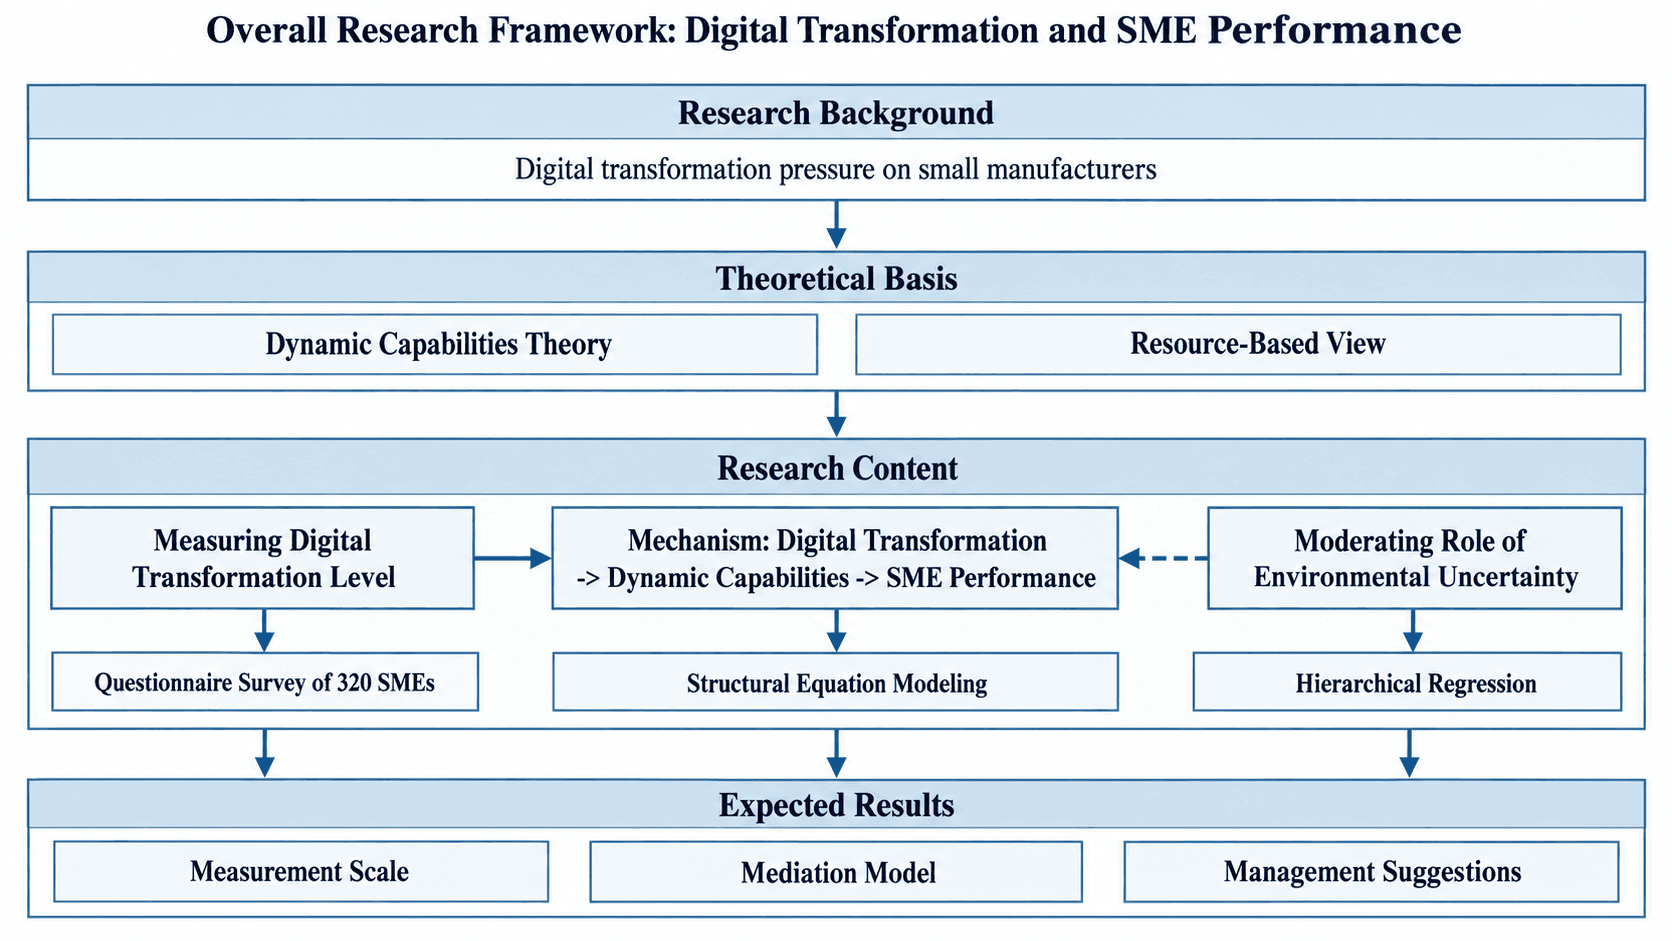
研究架構圖怎麼畫:變項關係模型、IPO 與整體研究架構三種畫法(2026)
寫論文計畫書或學位論文時,常被要求附上研究架構圖。本文說明變項關係模型、IPO 投入—過程—產出架構、整體研究架構三種圖的差別與畫法,每種附一個完整範例,並整理指導教授最常退回的錯誤。
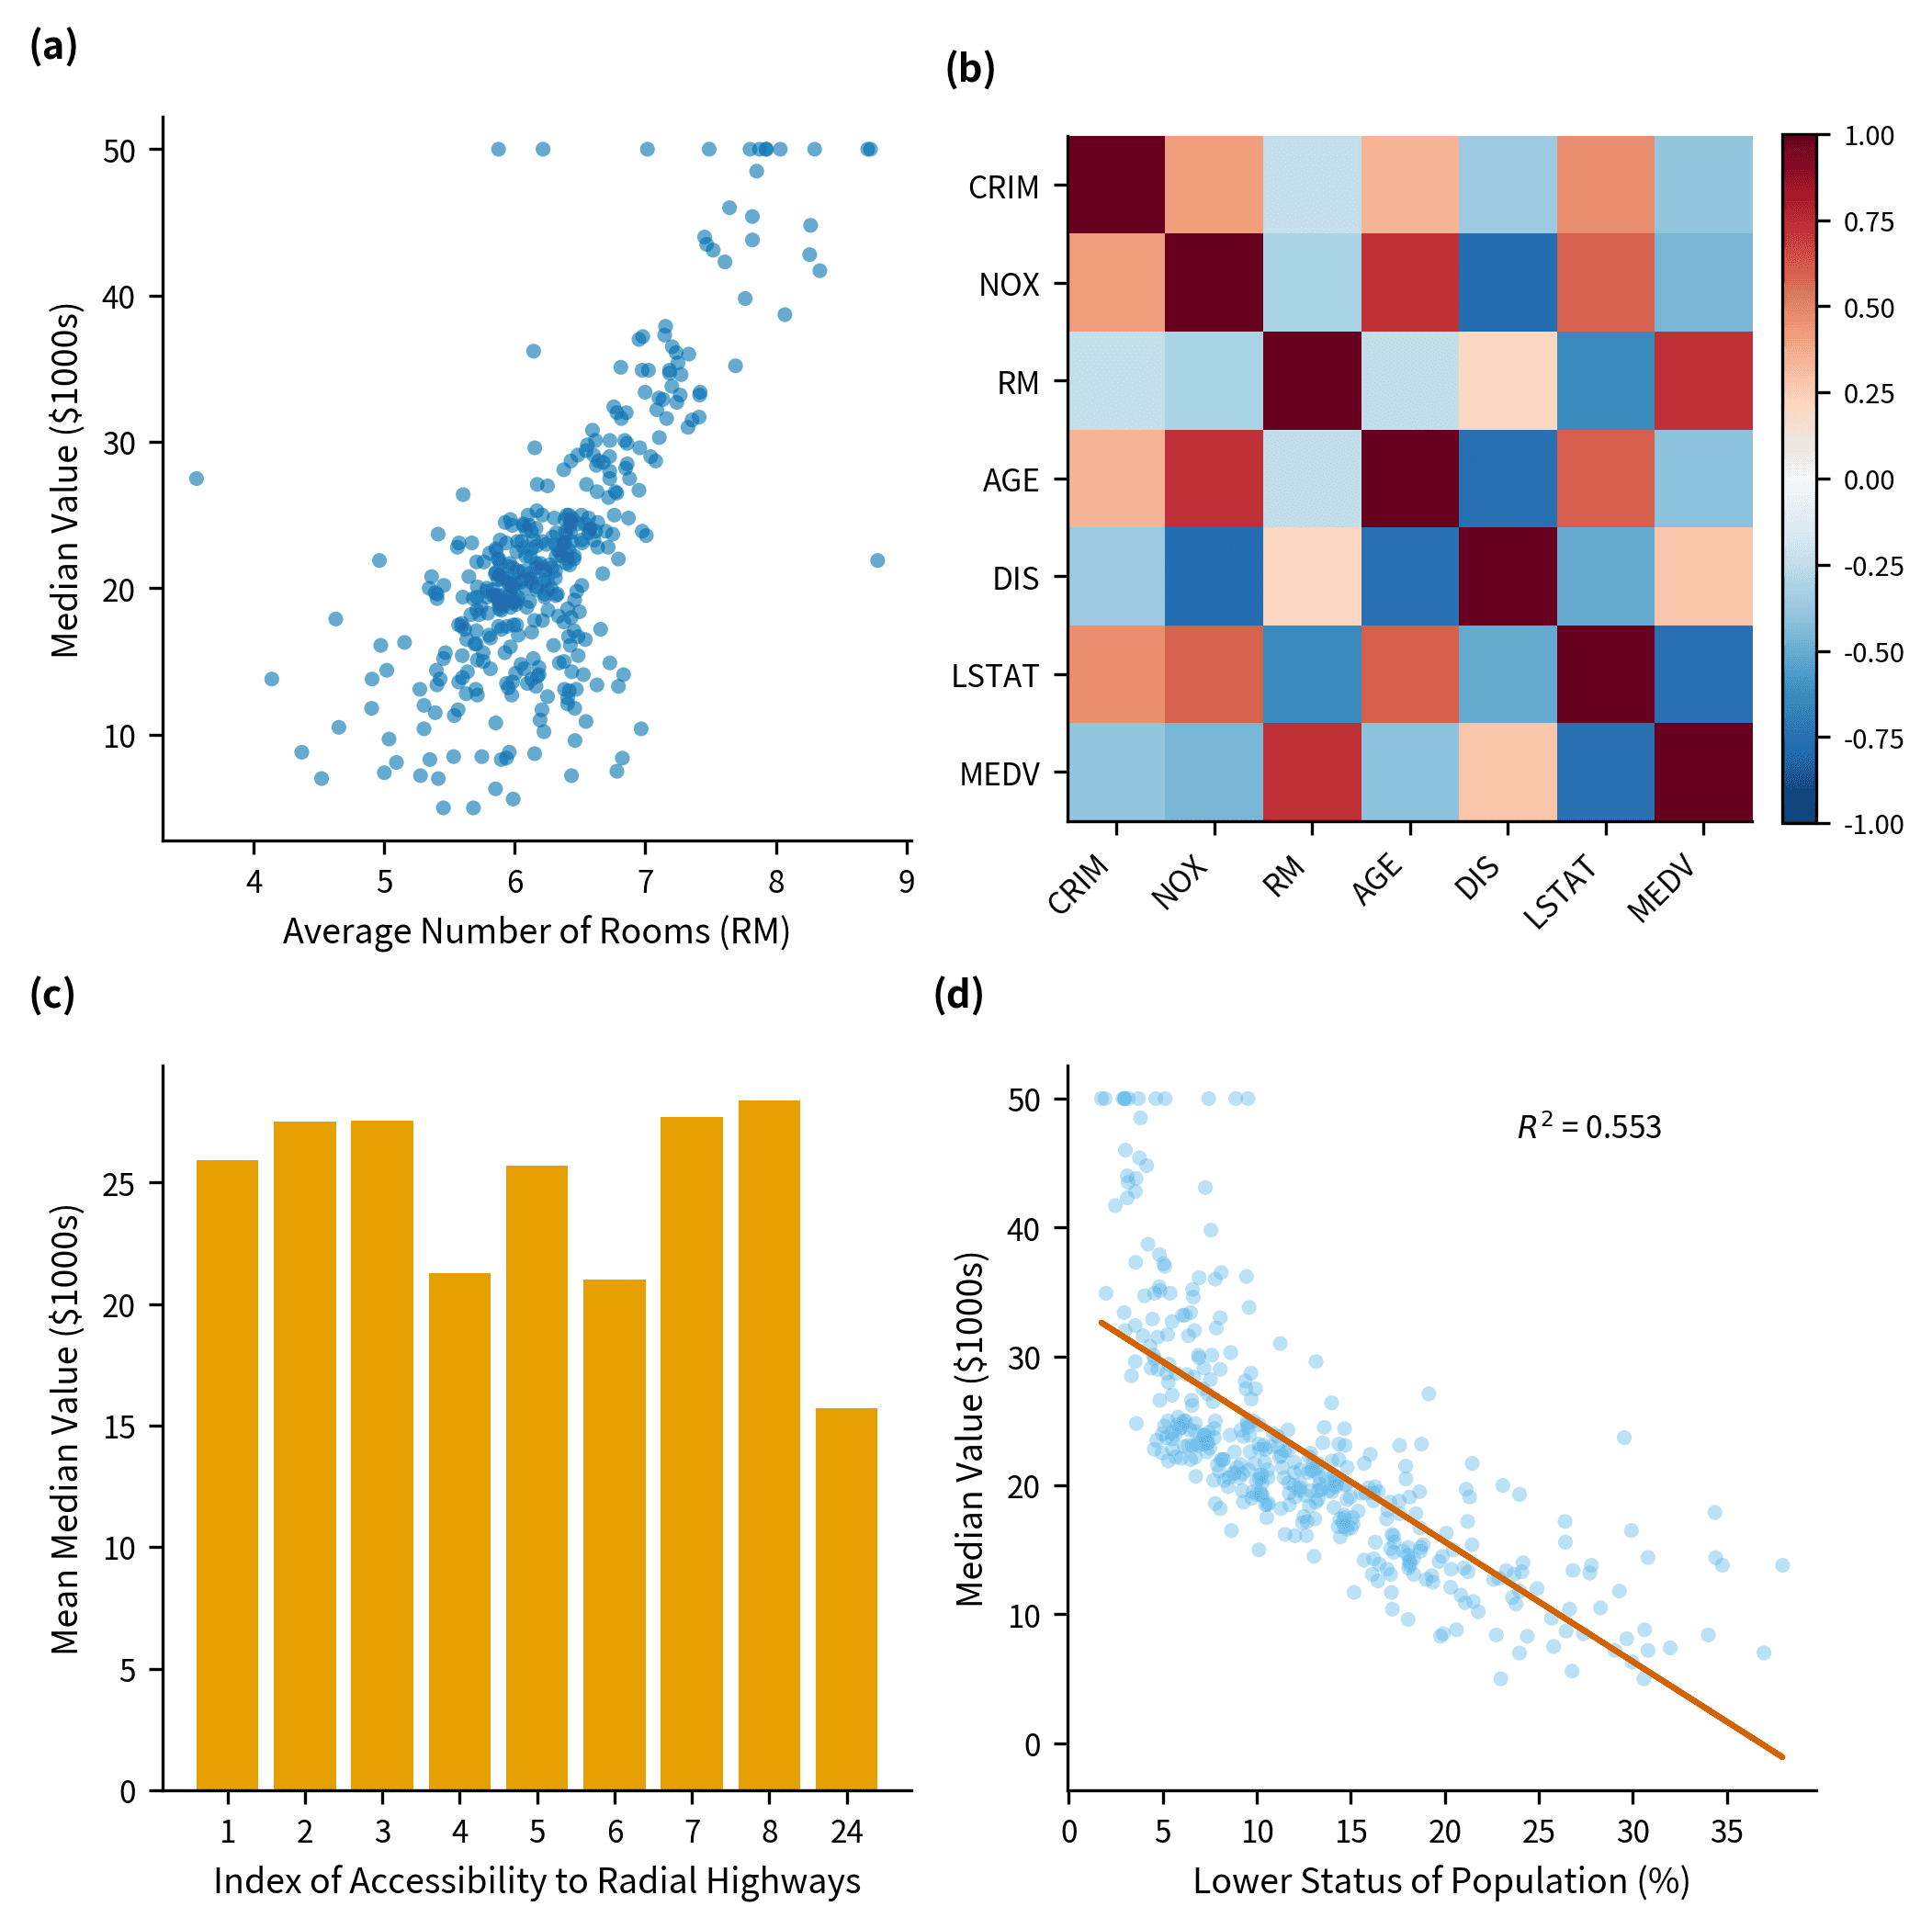
學術數據視覺化:46 種支援 CSV 與 Excel 的圖表繪製工具
選擇適合您研究的學術圖表、確認所需的數據欄位格式,並透過 SciDraw AI SciVis 輕鬆將 CSV 或 Excel 檔案轉化為 46 種達期刊發表標準的專業圖表。