Free Stem-and-Leaf Plot Generator
Create a labeled stem-and-leaf plot from plain text
Describe your data set, the digits to use for stems and leaves, and any key you want shown, and AI draws a clean, textbook-style stem-and-leaf plot — ready for statistics homework, classroom handouts, and research.
Stem-and-leaf plot examples
Click any example to load its prompt, or use it as a starting point for your own stem-and-leaf plot.
What is a stem-and-leaf plot?
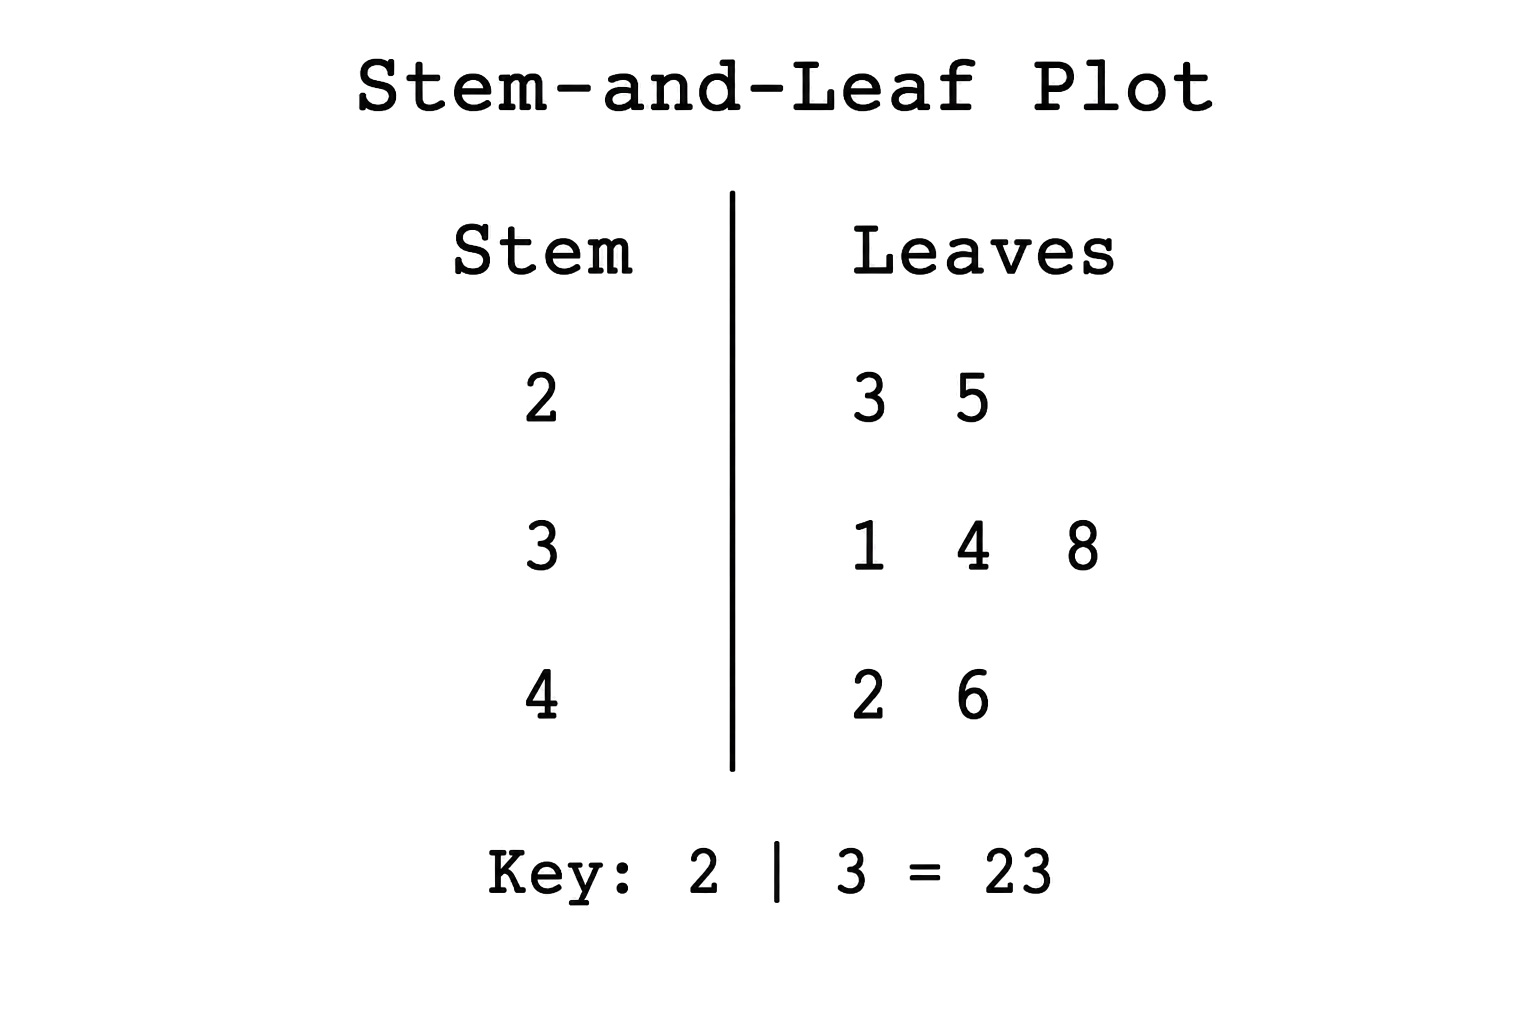
A stem-and-leaf plot (also called a stem-and-leaf diagram or stem plot) is a way of displaying a data set where each number is split into a stem (its leading digits) and a leaf (its final digit), with stems listed down a central column and matching leaves written in a row beside them. This stem-and-leaf plot generator turns a plain-text description into a clean, labeled figure — you describe your data set, which digits become stems and leaves, and the key you want shown, and the AI produces a tidy, textbook-style plot with stems, ordered leaves, a vertical divider, and a key, all without spreadsheets or coding.
Why use a stem-and-leaf plot generator
- Stem-and-leaf plots show the shape of a distribution while keeping every original data value, unlike a histogram that hides them in bars.
- Laying out aligned stems, sorted leaves, and a key by hand is fiddly and easy to get wrong.
- Students learning to read stems, leaves, and keys understand them far better from a clearly drawn example.
- Teachers and tutors need quick, presentable stem-and-leaf plots for worksheets, slides, and quizzes.
- Changing the data set, stems, or grouping and regenerating is much faster than redrawing the table by hand.
How to make a stem-and-leaf plot
List your data set and say which digits should be the stems and which the leaves — for two-digit numbers, the tens digit is the stem and the units digit is the leaf. Then add the features you need: ordered leaves, a vertical divider line, a key such as '6 | 2 = 62', a back-to-back layout to compare two groups, or a decimal key for non-whole numbers. Generate the stem-and-leaf plot, check the stems, leaves, and key, and refine the description if anything is unclear.
Parts of a stem-and-leaf plot
- Stems — the leading digit(s) of each value, listed in a single column down the left.
- Leaves — the final digit of each value, written in a row to the right of its stem.
- Vertical divider — the line (often drawn as |) separating the stems from the leaves.
- Ordered leaves — leaves sorted in ascending order within each stem so the row is easy to read.
- Key / legend — a note such as '2 | 3 = 23' that explains how to combine a stem and a leaf.
- Title — a short caption describing what the stem-and-leaf plot shows.
Stem-and-Leaf Plot Generator FAQ
What is a stem-and-leaf plot?
A stem-and-leaf plot is a way to display a data set where each number is split into a stem (its leading digits) and a leaf (its final digit). The stems are listed in a column and the matching leaves are written in a row beside each stem, so you see the shape of the distribution while keeping every original value. It is widely used in statistics classes to organize and read small data sets.
How do I make a stem-and-leaf plot online?
Type your data set and say which digits should be the stems and which the leaves, for example tens digits as stems and units as leaves. SciDraw AI then draws a clean stem-and-leaf plot with ordered leaves, a vertical divider, and a key. You can adjust the data, grouping, or key wording and regenerate until the stem-and-leaf plot matches what you need.
How do I read the stems, leaves, and key?
Read each row by joining the stem on the left with each leaf on its right: a stem of 6 with a leaf of 2 means the value 62. The key, such as '6 | 2 = 62', tells you exactly how a stem and leaf combine, which matters for decimals where '2 | 3' might mean 2.3. Leaves are usually ordered smallest to largest so you can quickly find the median and spread.
Stem-and-leaf plot vs histogram — what is the difference?
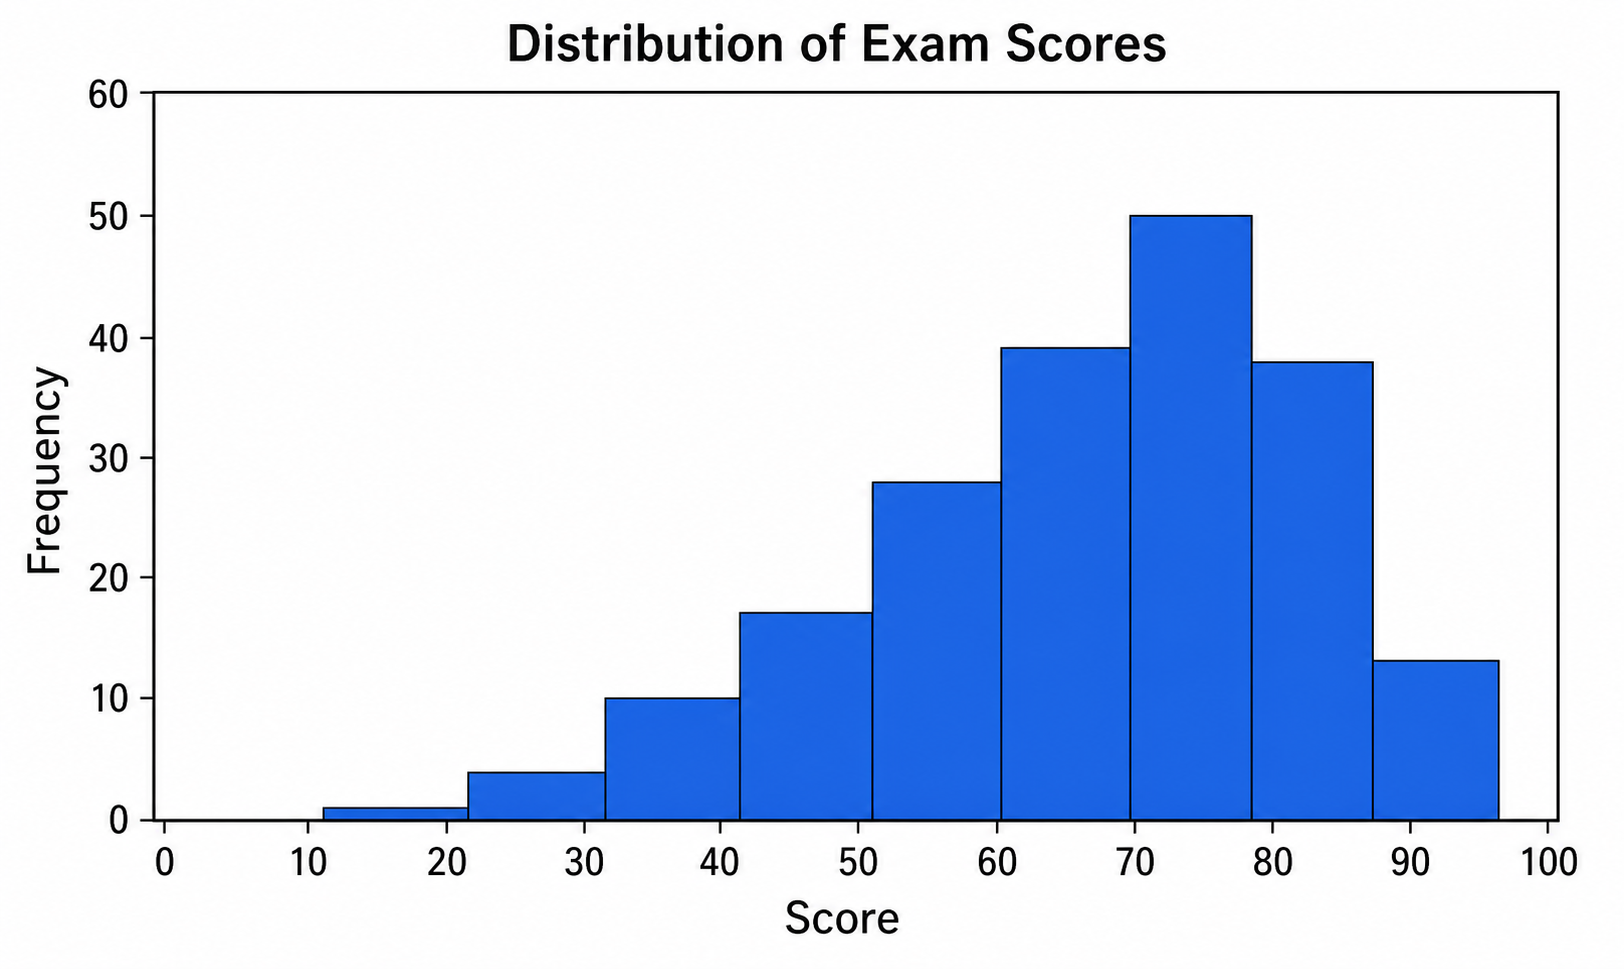
Both show the shape of a distribution, but a stem-and-leaf plot keeps every original data value visible as digits, while a histogram groups values into bars and hides the individual numbers. Stem-and-leaf plots work best for small data sets where you still want to read each value; histograms are better for large data sets. You can generate either with SciDraw AI and compare them.
Is the stem-and-leaf plot generator free?
Yes, you can start for free. Create an account and you receive free credits to generate stem-and-leaf plots right away, with paid plans available if you need to make many statistics charts and labeled plots on a regular basis.
Is it suitable for class, statistics, or research?
Absolutely. The plots are well suited to math and statistics classes, as well as worksheets, quizzes, lecture slides, and study guides, and they are clean enough for lab reports and research write-ups. Generate a labeled stem-and-leaf plot for the exact data set your lesson or assignment covers.
Explore More Tools

Histogram Maker
Turn data and bins into a clean, labeled frequency histogram with an optional normal curve.
Try it free
Box Plot Maker
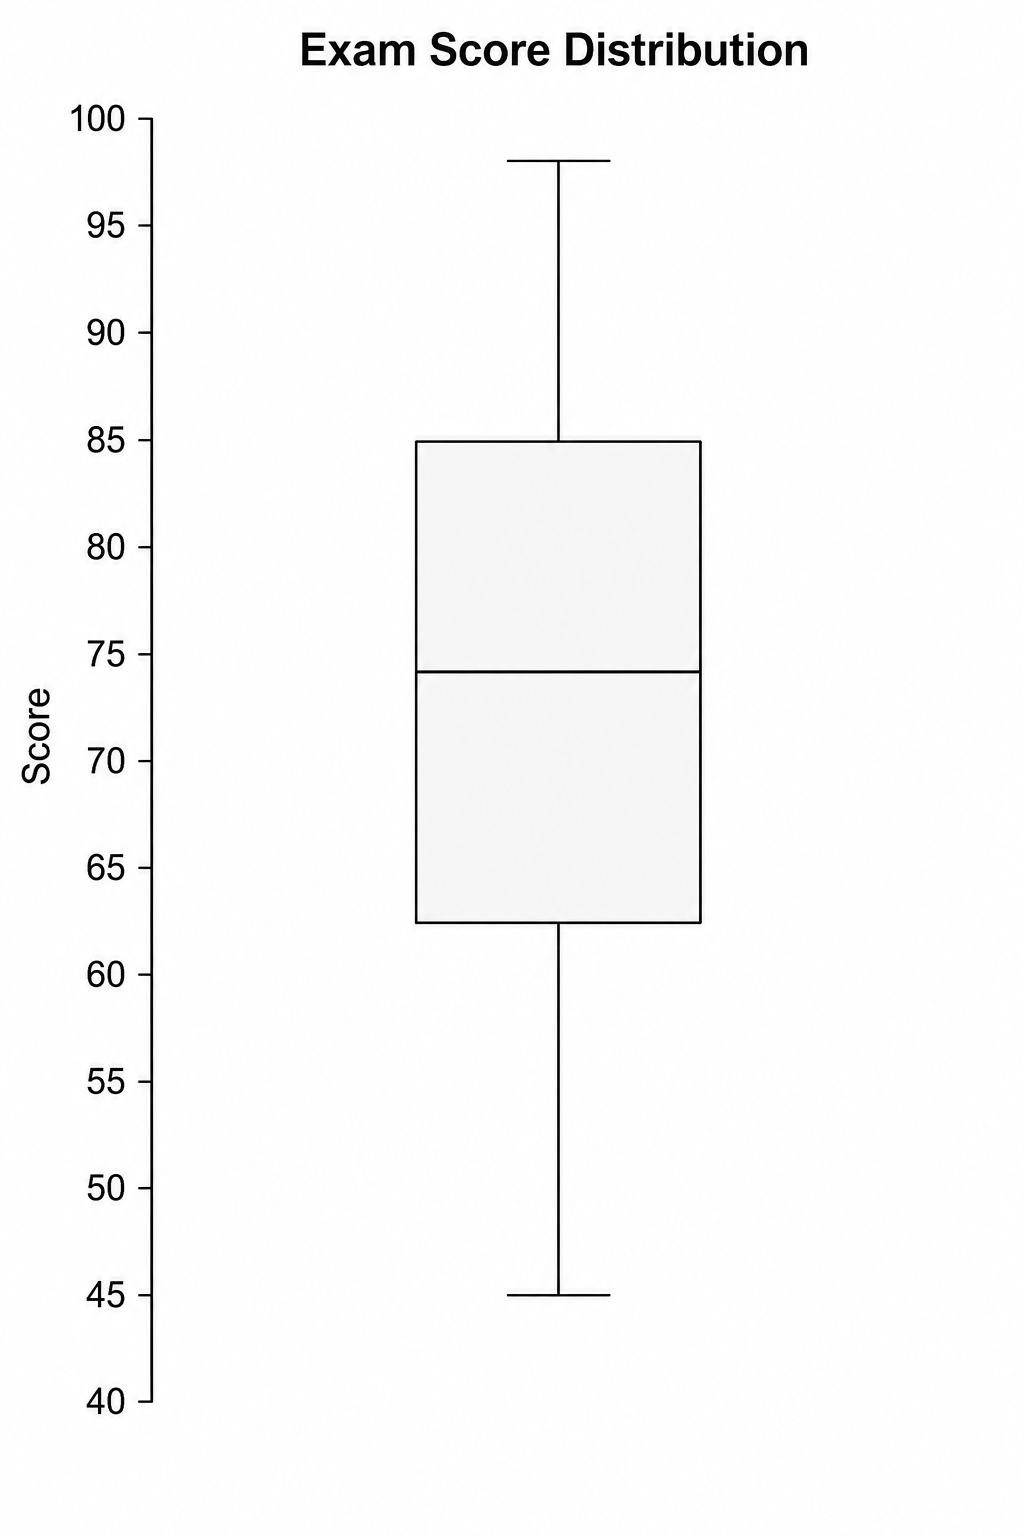
Generate clean, labeled box-and-whisker plots with quartiles, whiskers, and outliers from a plain-text description.
Try it free
Violin Plot Maker
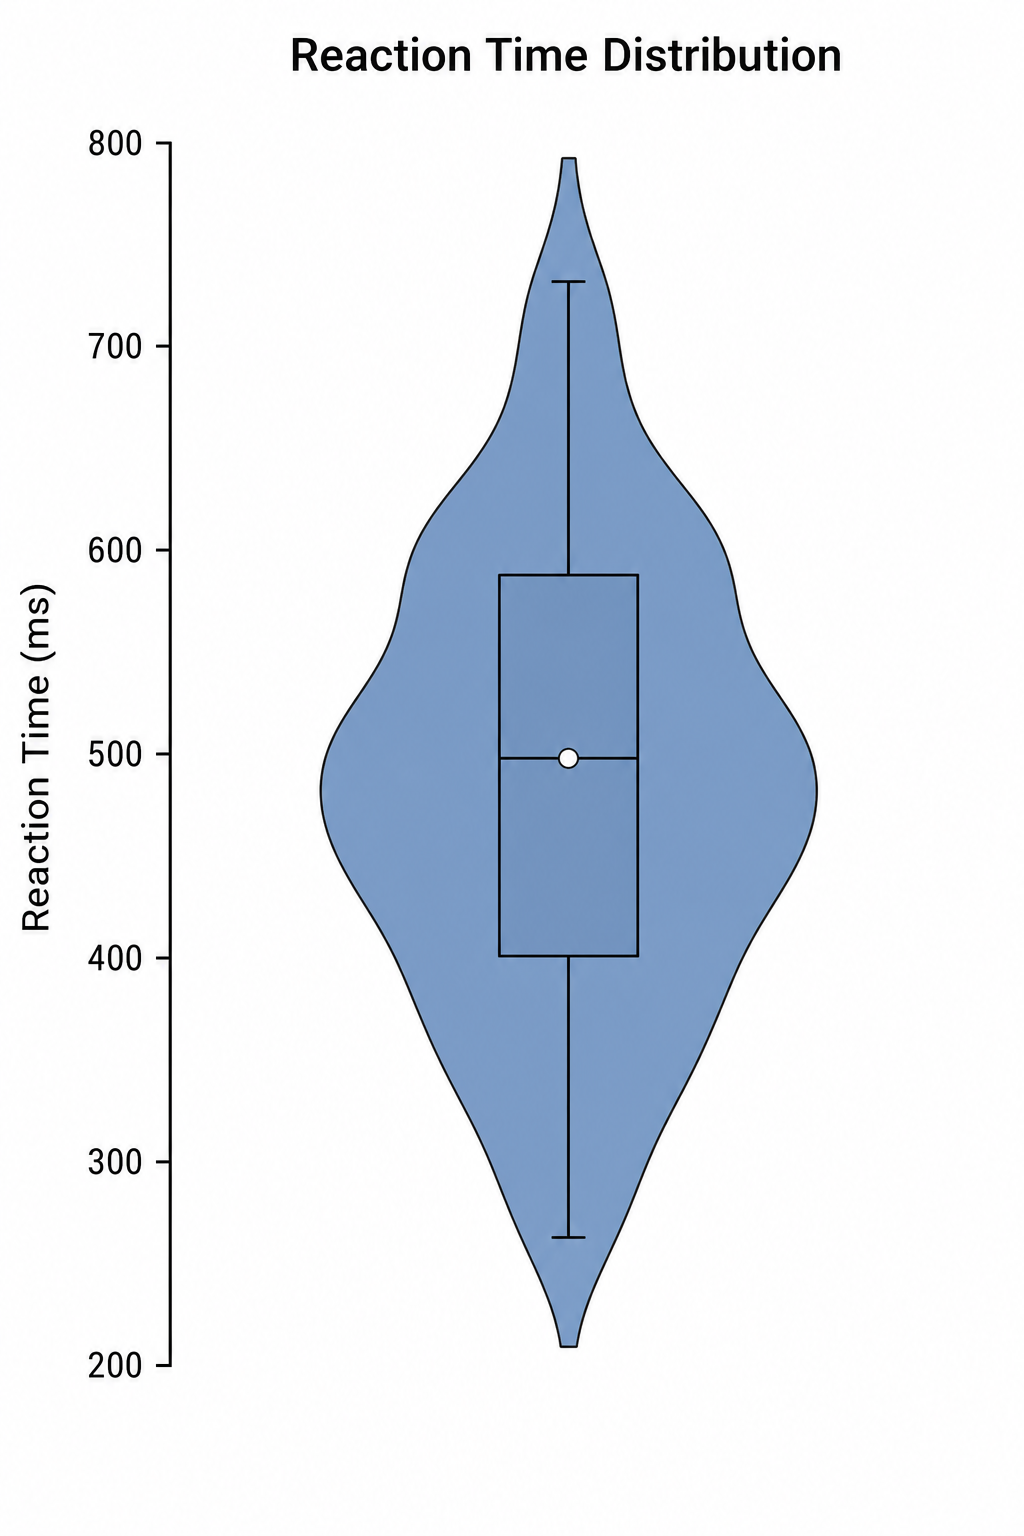
Create labeled violin plots with inner box plots and density shapes from a plain-text description.
Try it freeDraw your stem-and-leaf plot now
Describe your data set and the key you need and get a clean, labeled stem-and-leaf plot in seconds. Start free with SciDraw AI.