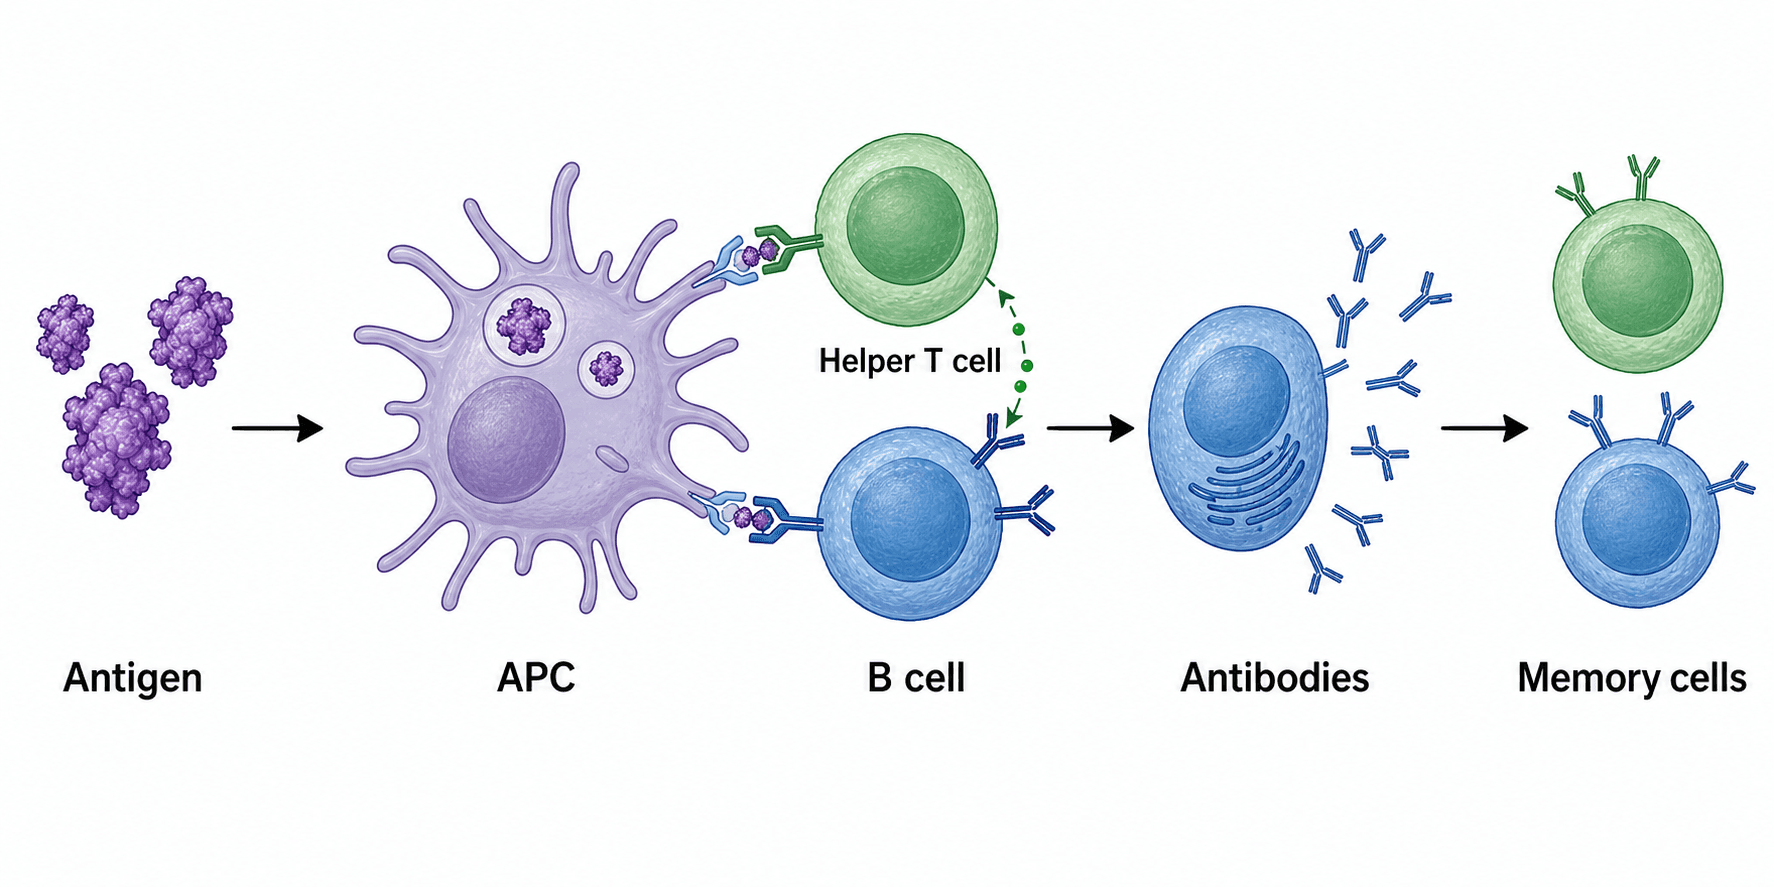
Исследования в области наук об окружающей среде требуют четкой визуализации экологических процессов, путей распространения загрязнения и концепций устойчивого развития. В этом руководстве представлены 30 проверенных AI-промптов, основанных на реальных экологических исследованиях, которые помогут вам создать готовые к публикации диаграммы для журналов, отчетов и презентаций.
Что вы найдете в этом руководстве:
- Диаграммы экологических процессов и биогеохимических циклов
- Иллюстрации источников и путей распространения загрязнения
- Концепции устойчивого проектирования и оптимизации
- Технологические дорожные карты для экологических исследований
1. Устойчивое проектирование и оптимизация
1.1 Пассивное солнечное проектирование
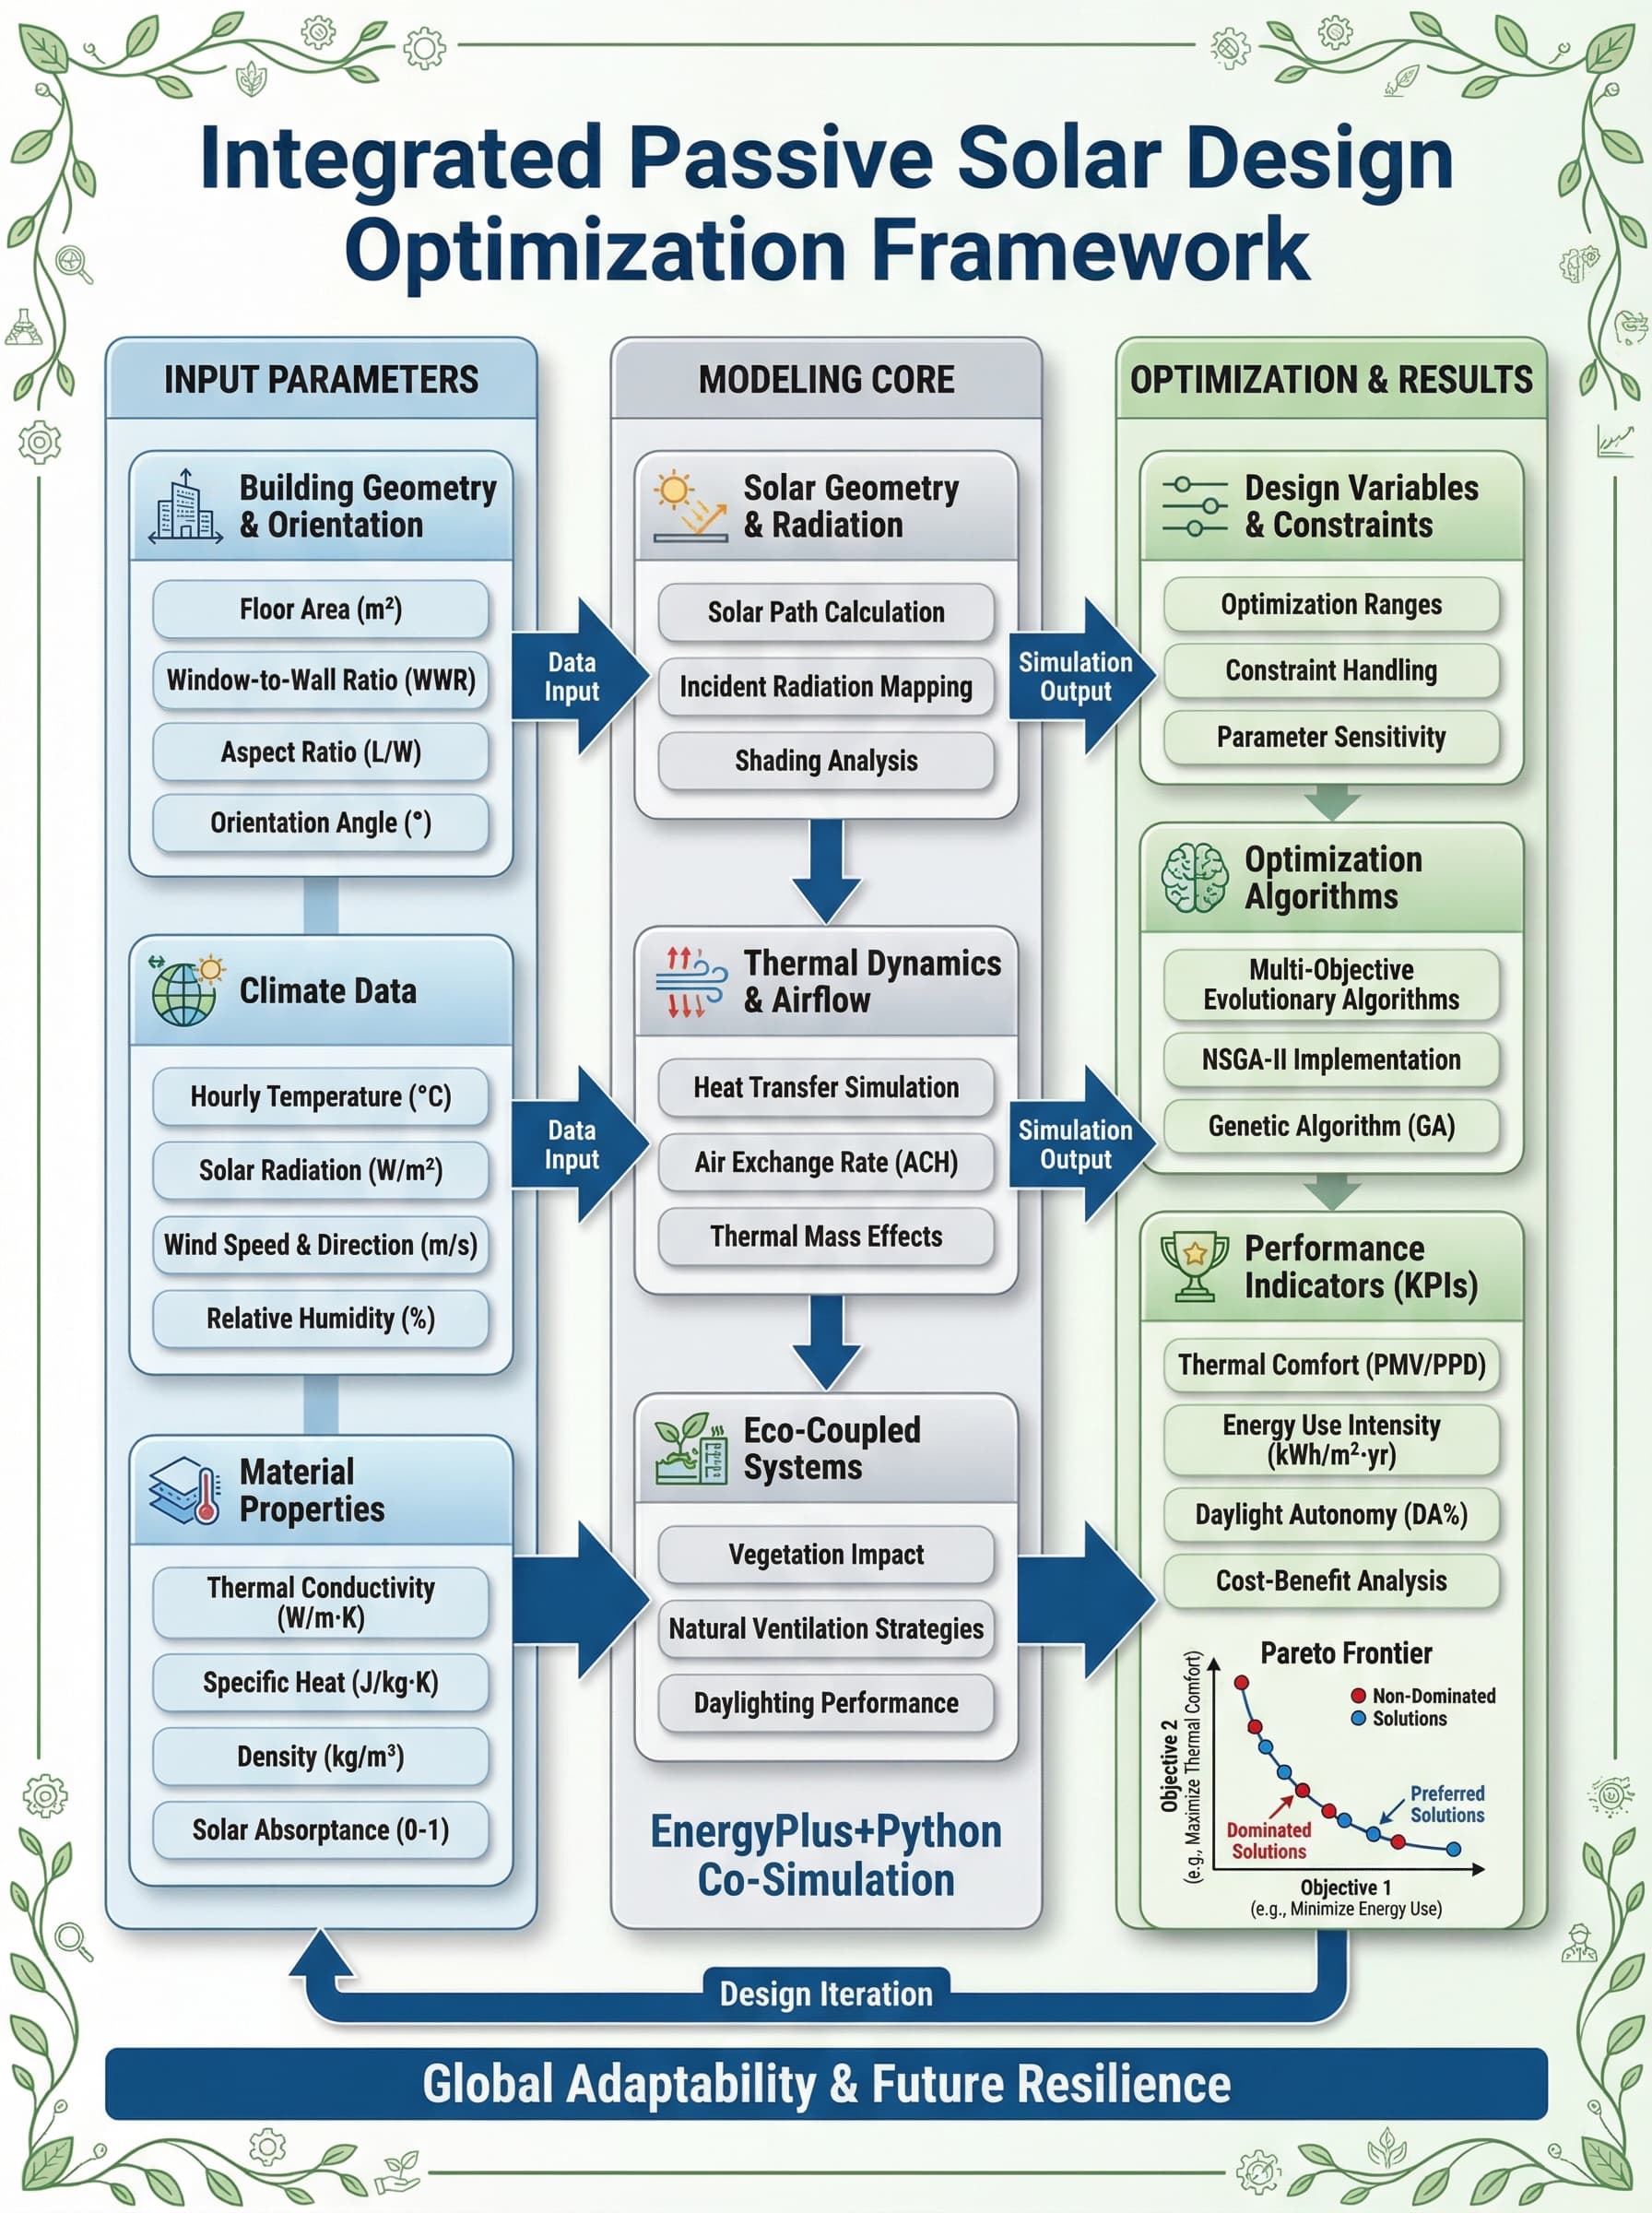
Промпт: Integrated Passive Solar Design Framework
Generate a landscape-oriented scientific framework diagram in English, titled
"Integrated Passive Solar Design Optimization Framework". Show:
- Building orientation and solar geometry
- Thermal mass placement strategies
- Natural ventilation pathways
- Daylighting optimization zones
- Energy performance indicators
- Integration with active systems
Use a professional scientific diagram style with clear hierarchical structure.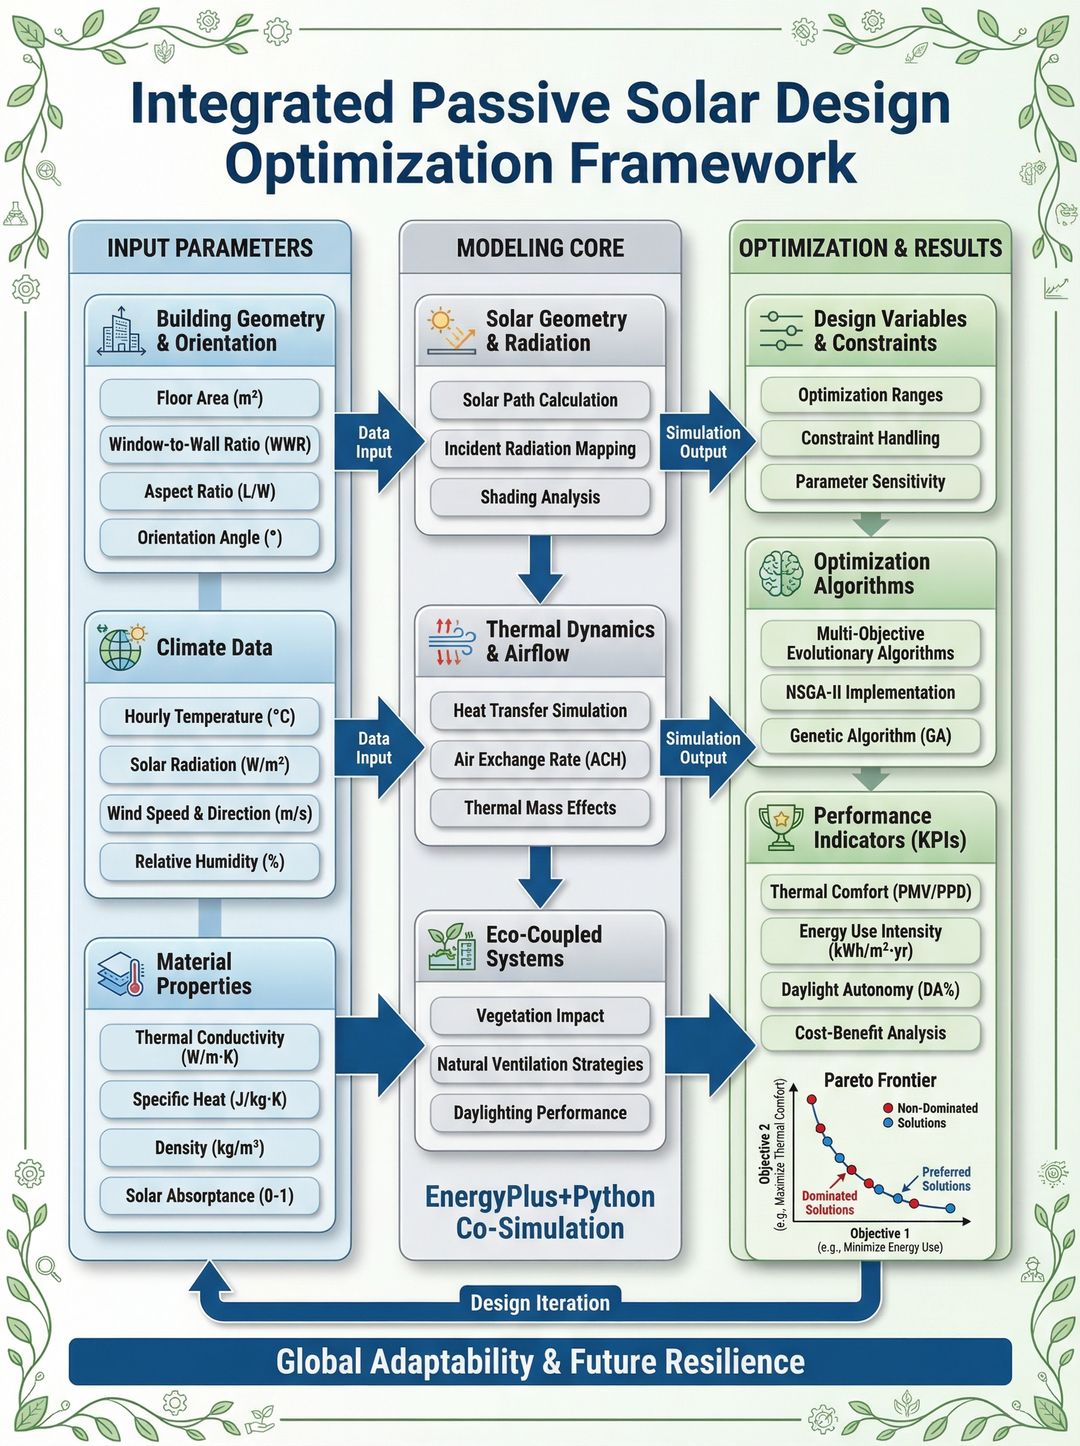
1.2 Реакция сельскохозяйственных культур на стресс
Промпт: Environmental Stress Effects on Crops
Environmental stress and suboptimal planting schedules significantly limit
cauliflower production by disrupting developmental processes. Create a diagram
showing:
- Temperature stress effects on plant physiology
- Water stress indicators and thresholds
- Developmental stage sensitivity windows
- Yield loss pathways
- Mitigation strategies (irrigation, shading)
Include both stress mechanism and management response panels.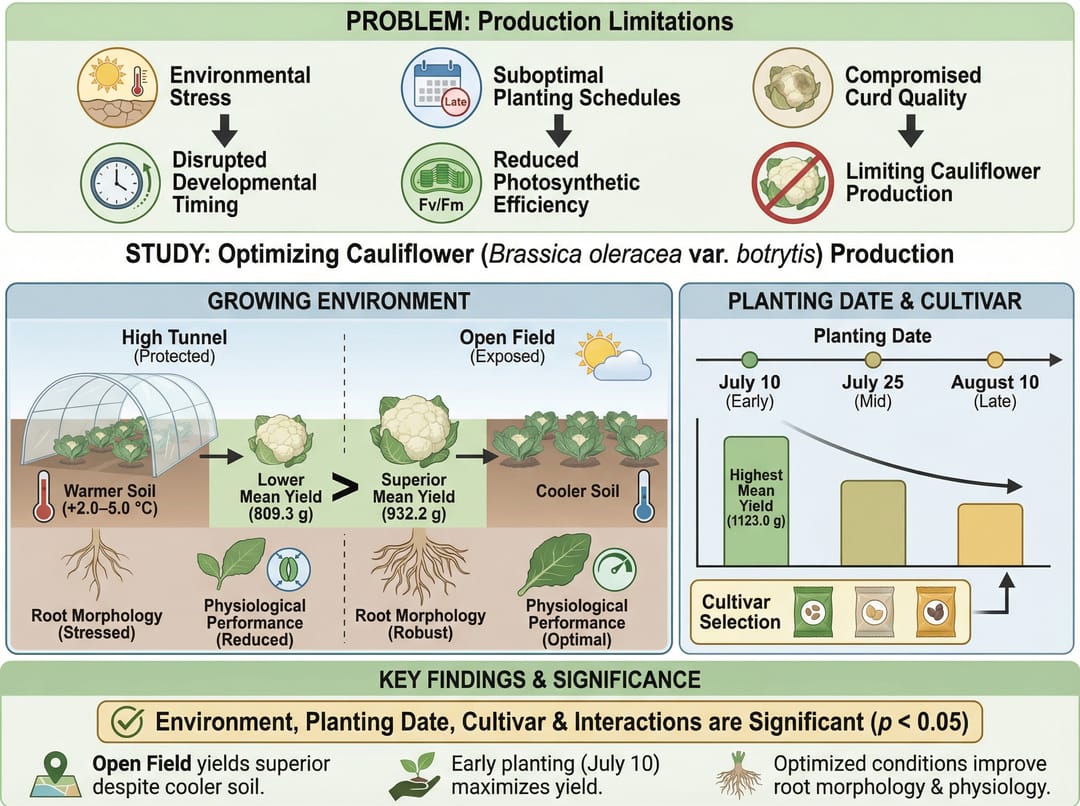
2. Биогеохимические циклы
2.1 Процессы азотного цикла в почве
Промпт: Farmland Soil Nitrification Mechanism
Draw a schematic diagram illustrating the mechanism of the nitrification process
in farmland soil. With ammonia oxidation as the central process, show:
- NH4+ to NO2- conversion (ammonia-oxidizing bacteria)
- NO2- to NO3- conversion (nitrite-oxidizing bacteria)
- Environmental factors affecting rates (pH, temperature, moisture)
- Coupling with denitrification
- N2O emission pathways
Use soil profile cross-section with microbial community visualization.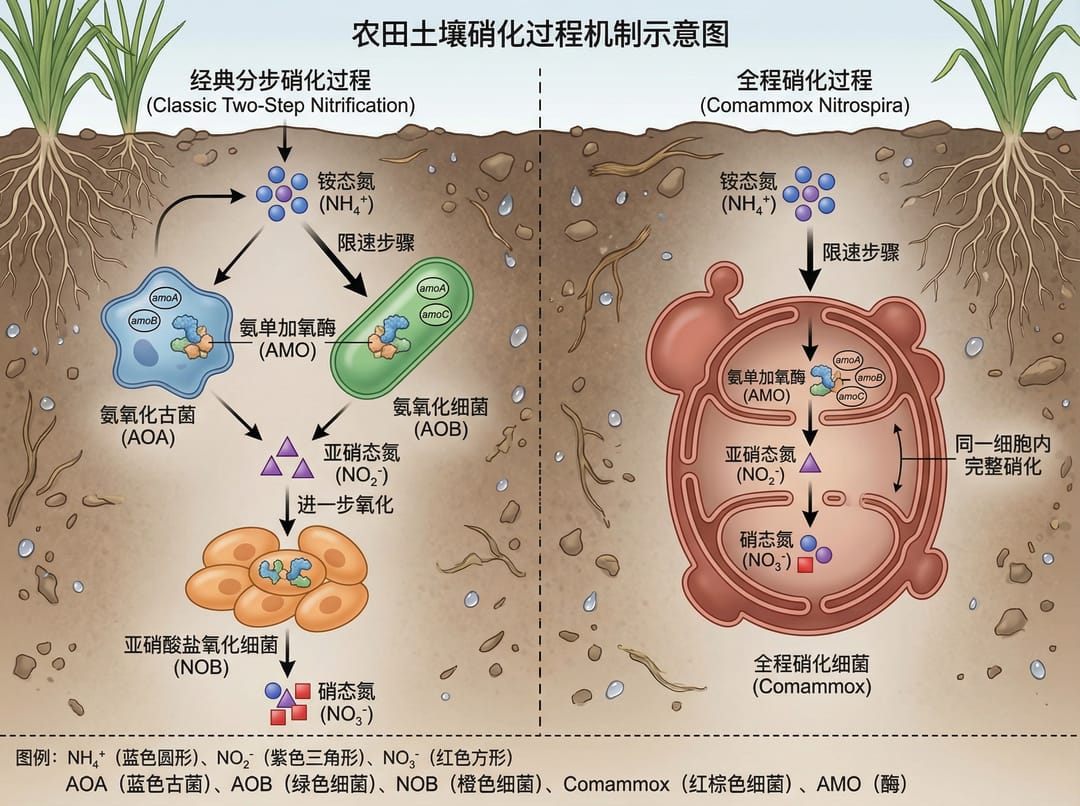
3. Новые виды загрязняющих веществ
3.1 Источники и пути распространения загрязнения
Промпт: Emerging Contaminant Sources
Emerging contaminants originate from diverse sources, with their release closely
linked to human production and lifestyle activities. Create an illustration showing:
- Pharmaceutical sources (hospitals, households, manufacturing)
- Personal care product pathways
- Agricultural chemical inputs
- Industrial discharge points
- Transport through water, soil, and air
- Exposure routes to ecosystems and humans
Use a circular or network diagram style.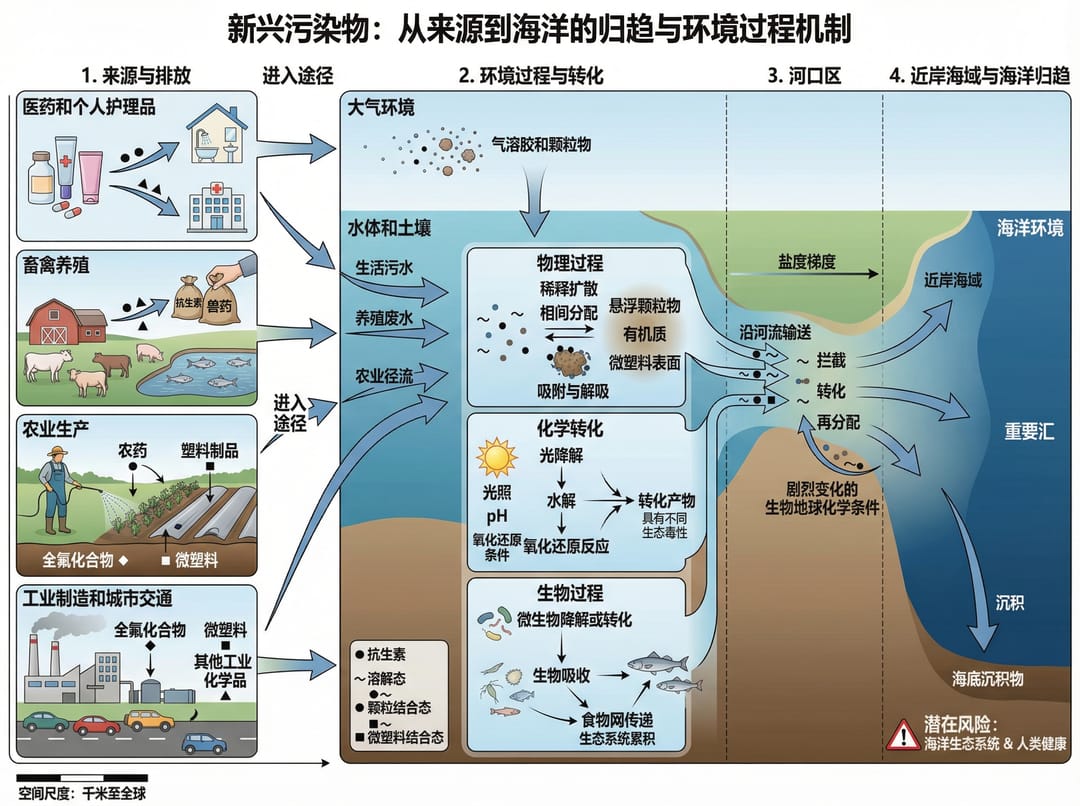
3.2 Перенос в морских пищевых сетях
Промпт: PPCPs Trophic Transfer in Marine Systems
Could you help me generate a technical roadmap? I am a graduate student studying
the trophic transfer of PPCPs (pharmaceuticals and personal care products) in
marine food webs. Show:
- Primary producer uptake mechanisms
- Bioaccumulation at each trophic level
- Biomagnification factors
- Metabolic transformation pathways
- Human exposure through seafood consumption
- Research methodology workflow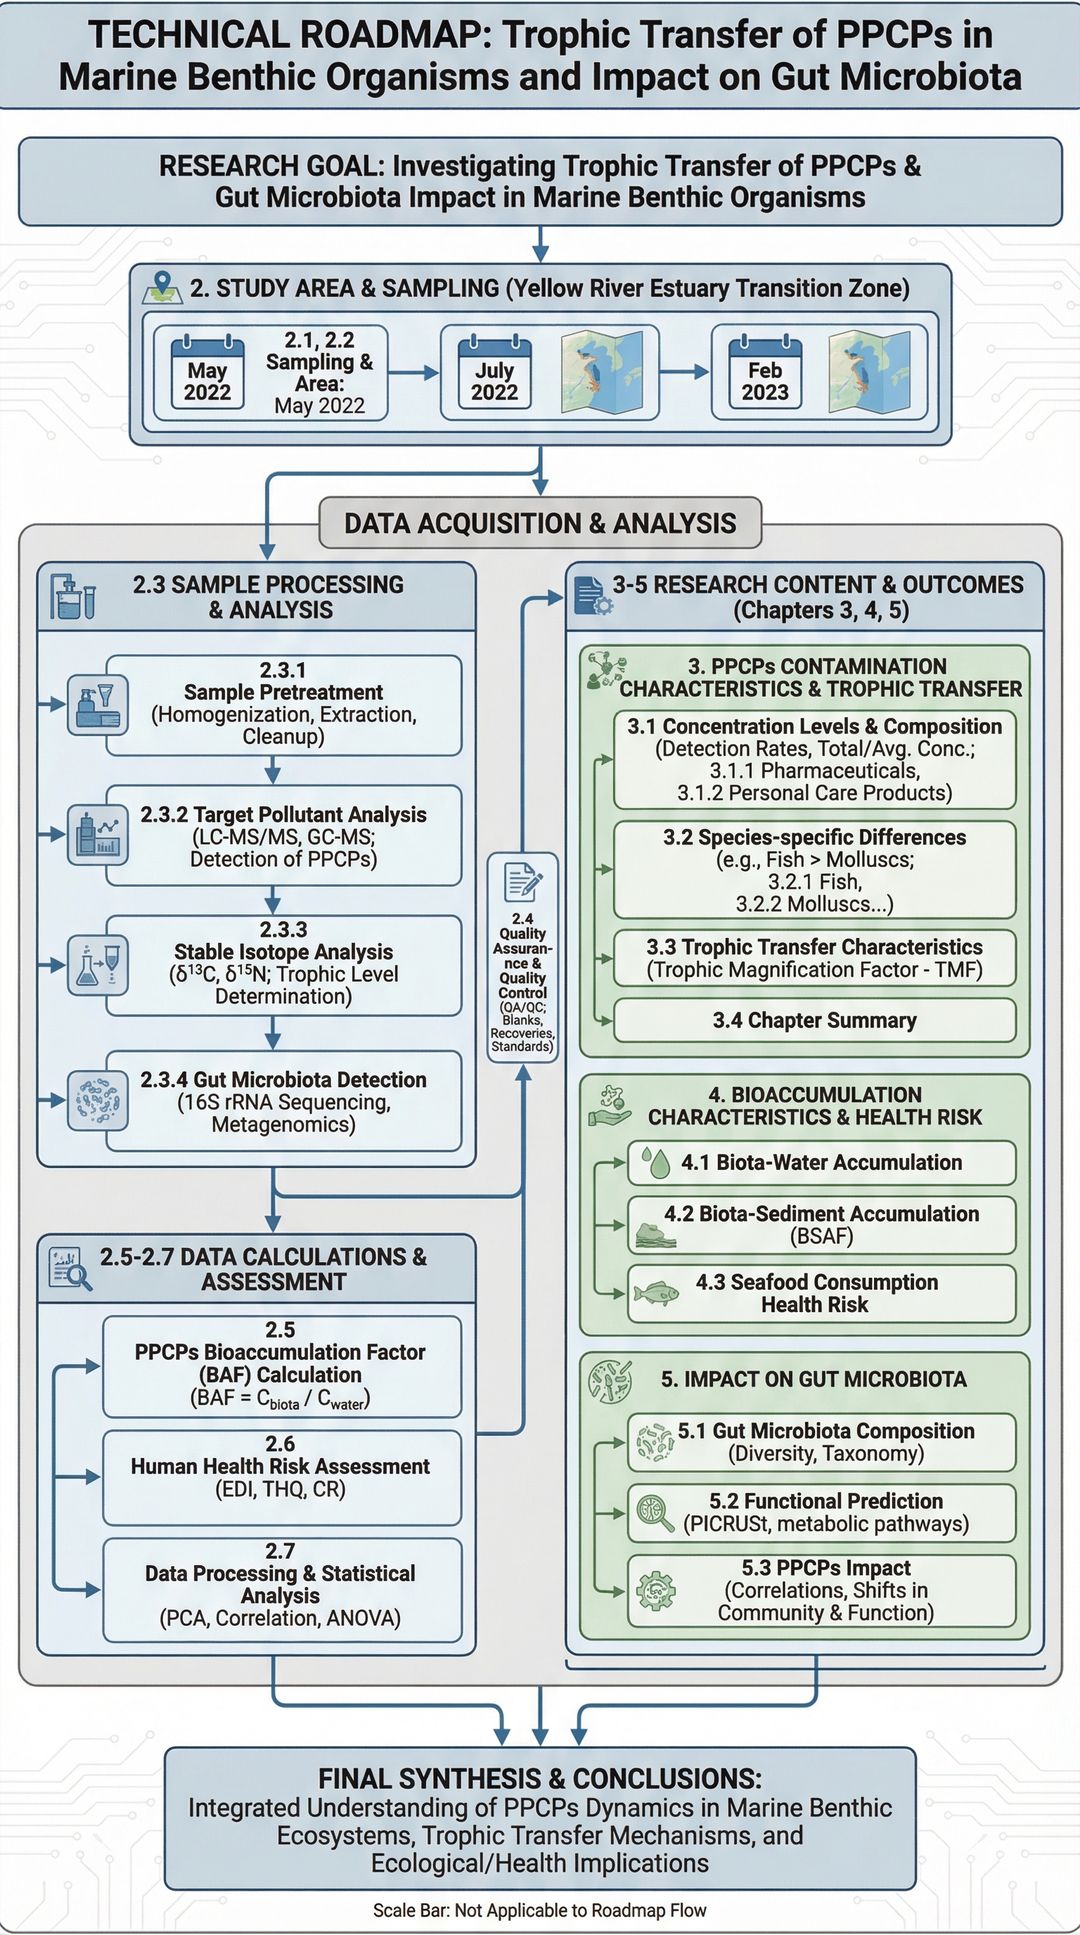
3.3 Экологические процессы и риски для здоровья
Промпт: PPCPs Ecological and Health Risk Framework
This study focuses on the ecological processes and health risks of emerging
contaminants, specifically pharmaceuticals and personal care products in aquatic
environments. Create a framework diagram showing:
- Source identification and quantification
- Environmental fate and transport
- Ecological toxicity pathways
- Human health risk assessment
- Regulatory framework and monitoring
Use a hierarchical or flow-based structure.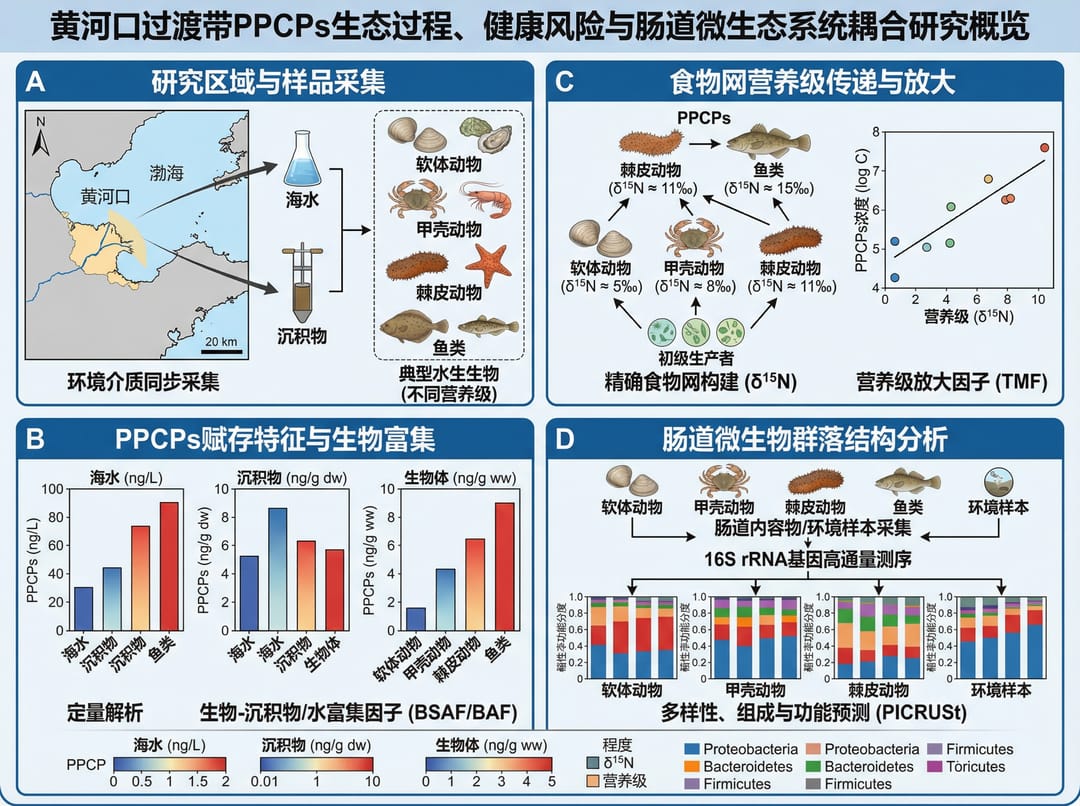
4. Региональные экологические исследования
4.1 Экосистемы эстуариев
Промпт: Yellow River Estuary Technology Roadmap
Generate a technology roadmap. This study focuses on the ecologically sensitive
Yellow River Estuary transition zone as a case study. Include:
- Study area characterization
- Research objectives and hypotheses
- Sampling and monitoring strategy
- Data analysis methods
- Expected outcomes and applications
- Timeline and milestones
Use a professional research roadmap format.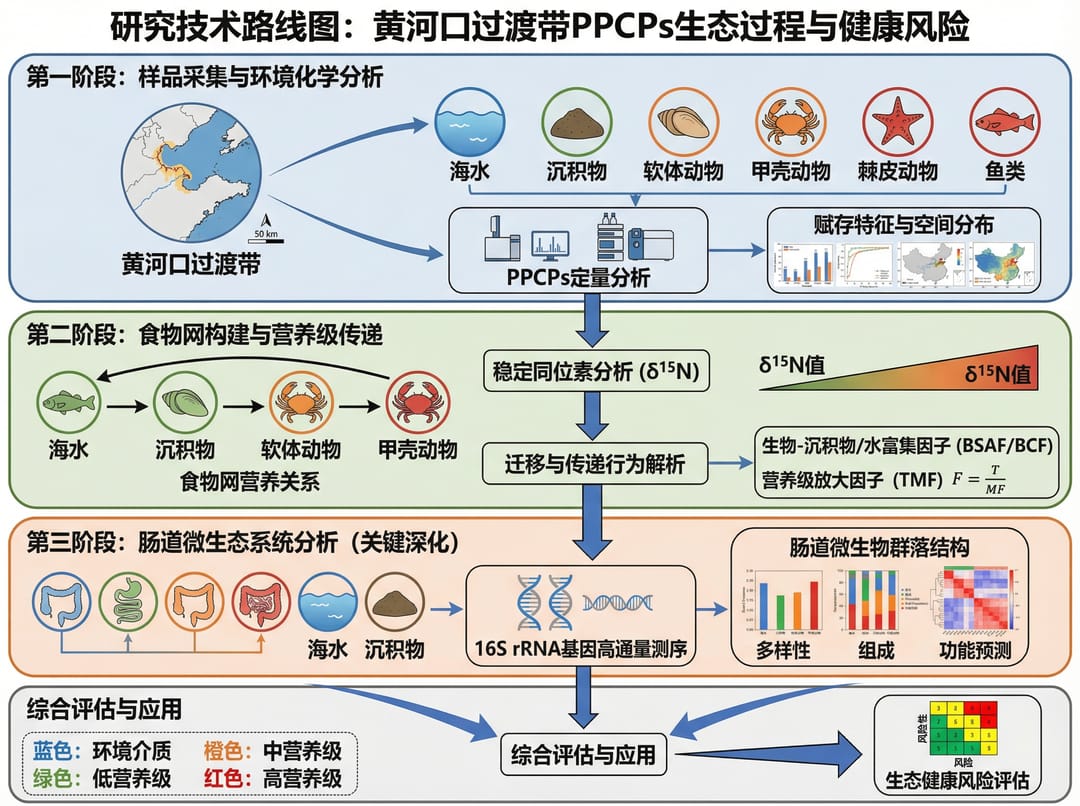
5. Структуры «проблема-решение»
5.1 Кольцевая инфографика
Промпт: Wind Erosion Problem Cascade
Scientific illustration, circular infographic format.
Top Half: Problem Cascade illustrating the effects of wind erosion:
- Soil loss and degradation
- Nutrient depletion
- Vegetation damage
- Air quality impacts

Bottom Half: Solution Framework showing:
- Windbreak establishment
- Cover cropping
- Tillage management
- Monitoring and assessment
Use a professional circular infographic with clear visual hierarchy.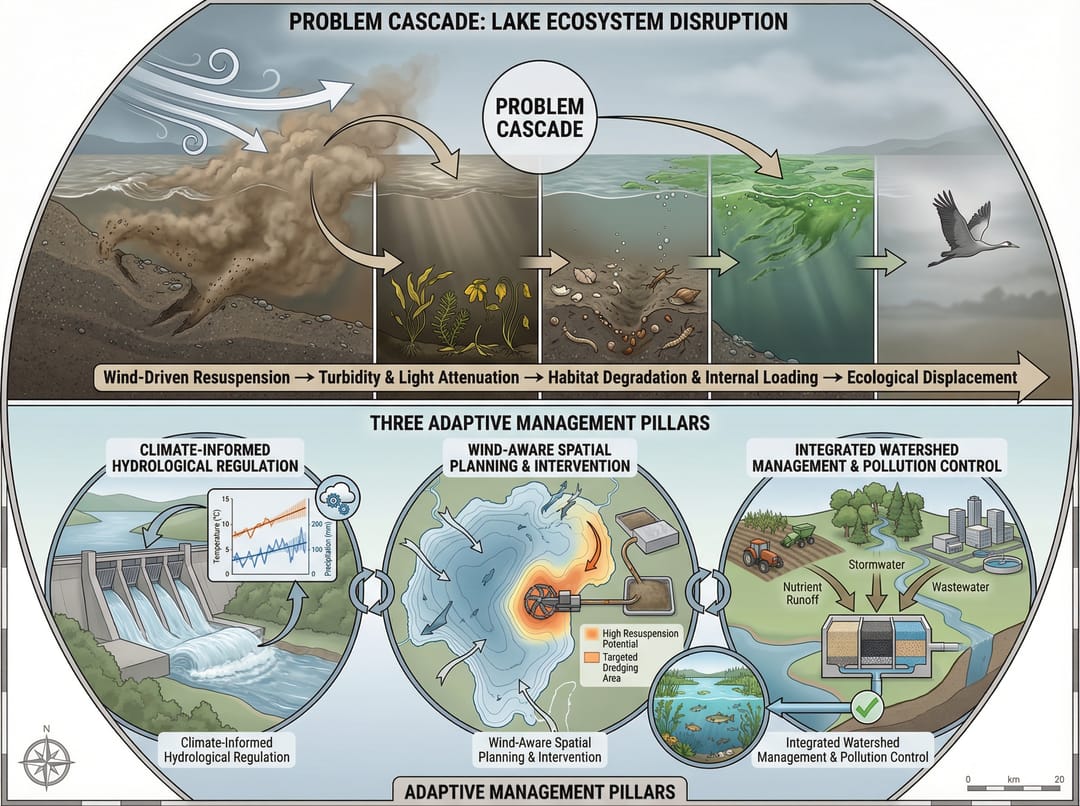
6. Инфраструктура и устойчивое развитие
6.1 Использование материалов для дорожного полотна
Промпт: Roadbed Filling Materials Research
1.1 Research Significance
The efficient utilization of roadbed filling materials is a concrete
implementation of key transportation sustainability goals. Create a figure showing:
- Material sources (recycled, natural, industrial byproducts)
- Processing and treatment methods
- Performance requirements and testing
- Environmental benefits quantification
- Life cycle assessment framework
Use a research significance diagram style.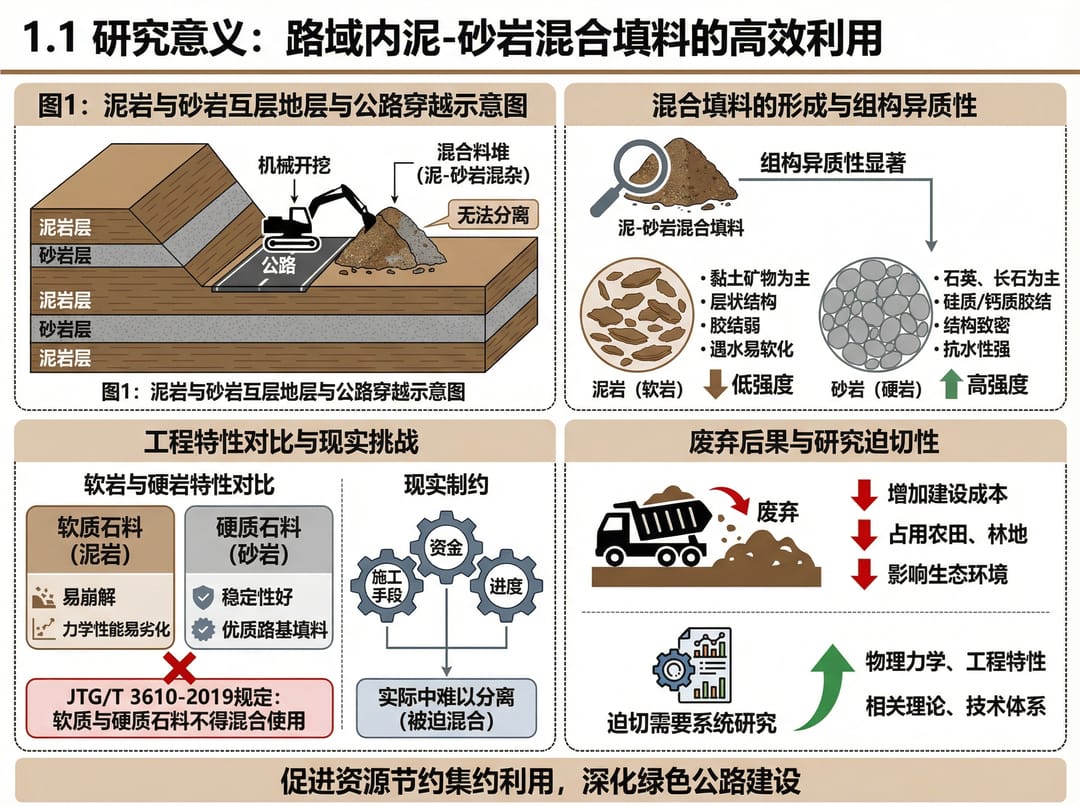
7. Лучшие практики для диаграмм в области наук об окружающей среде
Ключевые элементы по типам диаграмм
| Тип диаграммы | Основные компоненты |
|---|---|
| Биогеохимические циклы | Резервуары, потоки, процессы трансформации, микробные агенты |
| Пути распространения загрязнения | Источники, среды переноса, рецепторы, пути воздействия |
| Исследования экосистем | Трофические уровни, поток энергии, круговорот питательных веществ, взаимодействие видов |
| Концепции устойчивого развития | Входные и выходные данные, петли обратной связи, индикаторы |
Советы по составлению промптов для экологических наук
- Включайте масштаб: Временной (суточный, сезонный, годовой) и пространственный (локальный, региональный, глобальный).
- Показывайте количественные данные: Скорости потоков, концентрации, проценты.
- Указывайте неопределенность: Планки погрешностей, доверительные интервалы, где это применимо.
- Ссылайтесь на стандарты: EPA, ВОЗ или региональные нормативные пороговые значения.
- Используйте общепринятые символы: Стандартные обозначения для процессов и компонентов.
Начните создавать свои диаграммы по экологии
Попробуйте эти промпты с инструментами AI-иллюстрации SciDraw AI: