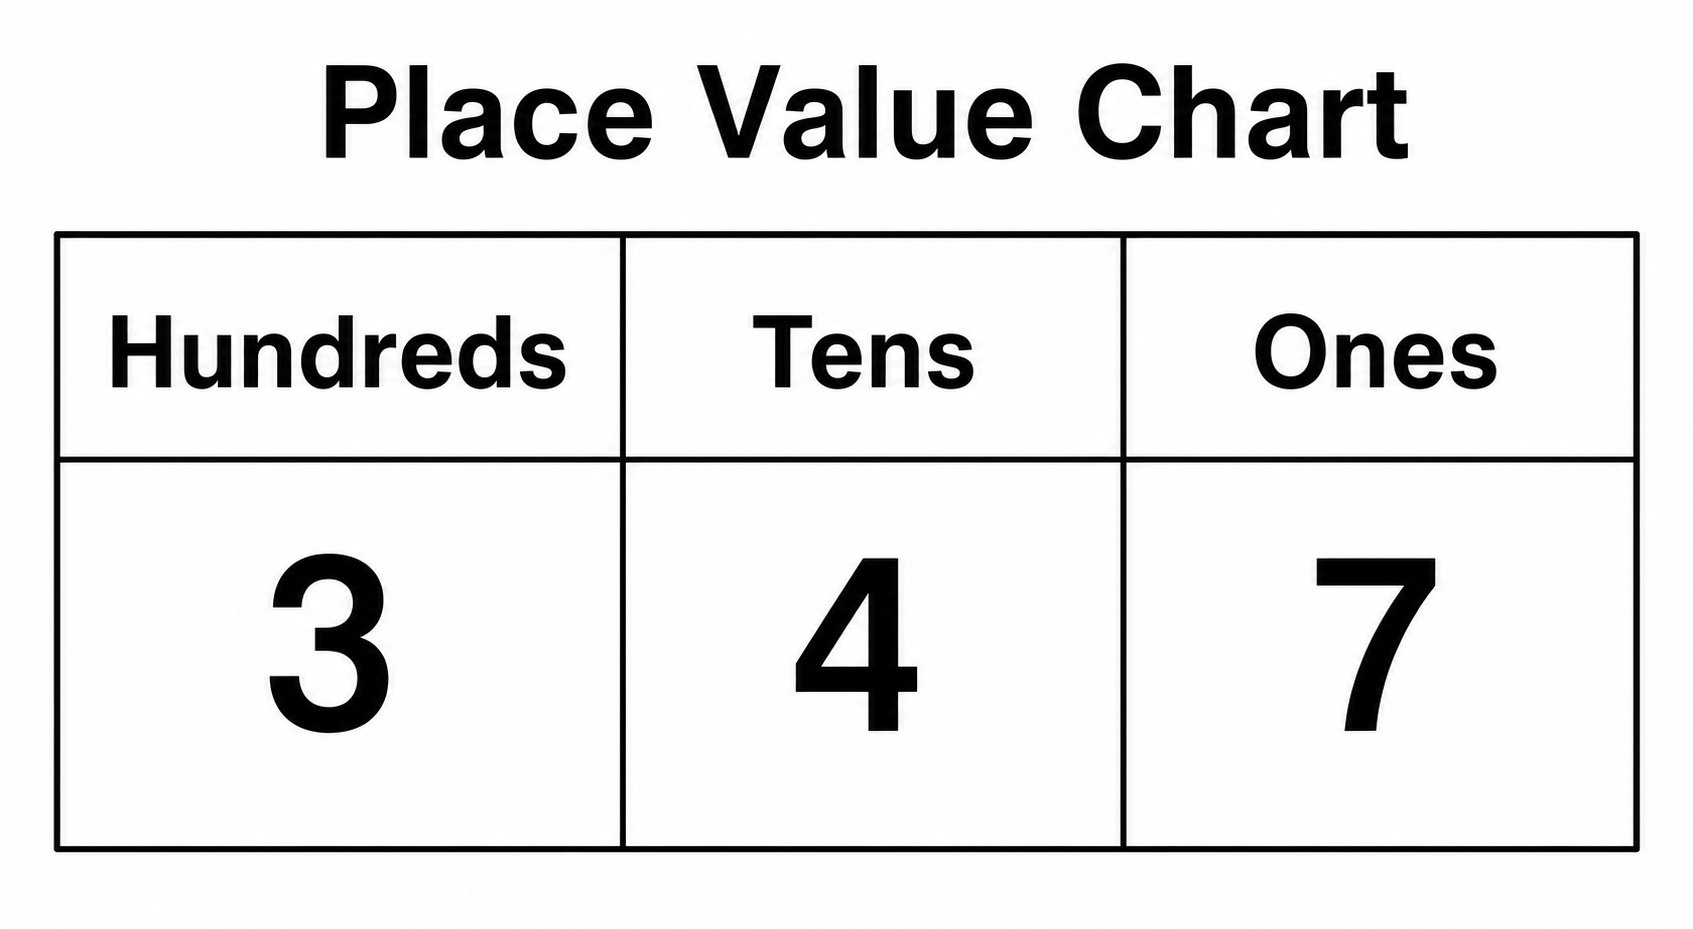
Creador de tablas de valor posicional gratis
Crea una tabla de valor posicional etiquetada a partir de texto sencillo
Describe el número que quieres mostrar y las columnas que necesitas —unidades, decenas, centenas, millares, decimales o millones— y la IA dibuja una tabla de valor posicional limpia y lista para el aula, perfecta para lecciones de matemáticas, fichas y ayuda con las tareas.
Ejemplos de tablas de valor posicional
Haz clic en cualquier ejemplo para cargar su indicación o úsalo como punto de partida para tu propia tabla de valor posicional.
¿Qué es una tabla de valor posicional?
Una tabla de valor posicional (también llamada tabla posicional) es una cuadrícula que organiza los dígitos de un número en columnas etiquetadas —unidades, decenas, centenas, millares y más allá— para que puedas ver el valor que representa cada dígito según su posición. Este creador de tablas de valor posicional convierte una descripción de texto en una tabla limpia y etiquetada: indicas las columnas que necesitas y el número que vas a colocar, y la IA produce una figura bien alineada con etiquetas de encabezado, agrupaciones por periodos opcionales e incluso bloques base diez, todo sin hojas de cálculo ni dibujar a mano.
Por qué usar un creador de tablas de valor posicional
- Las tablas de valor posicional son la forma estándar de enseñar cómo la posición del dígito determina su valor en matemáticas de primaria y secundaria.
- Dibujar a mano o en una hoja de cálculo una tabla bien alineada con las columnas correctas es laborioso y lleva tiempo.
- Los estudiantes entienden mucho más fácilmente las unidades, decenas, centenas y decimales con una tabla de valor posicional claramente etiquetada.
- Los profesores necesitan tablas rápidas e imprimibles para fichas, calentamientos, diapositivas de clase y ayuda con las tareas.
- Cambiar el número, añadir columnas decimales o extender hasta millones y volver a generar es mucho más rápido que redibujar una tabla.
Cómo hacer una tabla de valor posicional
Indica las columnas que quieres —unidades, decenas, centenas, millares, decimales o hasta millones— y proporciona el número que vas a colocar en ellas. Después añade las características adicionales que necesites: agrupaciones por periodos como millares y millones, una coma decimal etiquetada, bloques base diez para cada columna o una plantilla en blanco solo con encabezados. Genera la tabla de valor posicional, comprueba que cada dígito quede bajo el encabezado correcto y refina la descripción si algo está desalineado.
Partes de una tabla de valor posicional
- Encabezados de columna: etiquetas como unidades, decenas, centenas y millares que nombran cada valor posicional.
- Celdas de dígitos: las casillas donde se coloca cada dígito del número bajo su encabezado correspondiente.
- Agrupaciones por periodos: conjuntos de tres columnas (unidades, millares, millones) a menudo separados para números grandes.
- Coma decimal: un marcador que separa las columnas de números enteros de las décimas, centésimas y milésimas.
- Bloques base diez: unidades, barras y placas opcionales que muestran la cantidad que representa cada columna.
- Título: un texto breve que nombra la tabla, como 'Tabla de valor posicional'.
Preguntas frecuentes sobre el creador de tablas de valor posicional
¿Qué es una tabla de valor posicional?
Una tabla de valor posicional es una cuadrícula que organiza los dígitos de un número en columnas etiquetadas —unidades, decenas, centenas, millares y más allá— para que puedas ver el valor que representa cada dígito según dónde se encuentre. Se usa en clase de matemáticas para leer, escribir y comparar números, y puede extenderse hacia la izquierda para números grandes o a la derecha de una coma decimal para décimas, centésimas y milésimas.
¿Cómo hago una tabla de valor posicional en línea?
Escribe una breve descripción de la tabla que quieres, como una tabla de valor posicional con centenas, decenas y unidades y el número 347 colocado. SciDraw AI dibuja entonces una tabla de valor posicional limpia y alineada con encabezados de columna etiquetados. Puedes ajustar las columnas o el número y volver a generar hasta que la tabla de valor posicional coincida con tu lección o ficha.
¿Cómo funciona el valor posicional?
En nuestro sistema numérico, cada columna vale diez veces la columna a su derecha: la columna de las unidades cuenta unidades sueltas, las decenas cuentan grupos de diez, las centenas cuentan grupos de cien, y así sucesivamente. Para leer un número de una tabla de valor posicional, multiplica cada dígito por el valor de su columna y suma los resultados. A la derecha de la coma decimal, las columnas se reducen a décimas, centésimas y milésimas.
¿Puede hacer tablas con decimales o hasta millones?
Sí. Puedes generar una tabla de valor posicional de decimales con décimas, centésimas y milésimas a la derecha de una coma decimal, o una tabla grande que vaya de unidades hasta millones con los periodos de unidades, millares y millones agrupados y etiquetados. Solo indica las columnas y periodos que quieres, y la herramienta los dibuja alineados y etiquetados.
¿El creador de tablas de valor posicional es gratis?
Sí, puedes empezar gratis. Crea una cuenta y recibirás créditos gratuitos para generar tablas de valor posicional de inmediato, con planes de pago disponibles si necesitas hacer muchas tablas y diagramas matemáticos de forma habitual.
¿Es adecuado para clase y enseñanza?
Por supuesto. Las tablas son ideales para matemáticas de primaria y secundaria, así como para fichas, calentamientos, diapositivas de clase y ayuda con las tareas. Genera una tabla de valor posicional en blanco para que los estudiantes la completen o una tabla rellena con un ejemplo resuelto para los valores posicionales exactos que cubra tu lección.
Explorar más herramientas
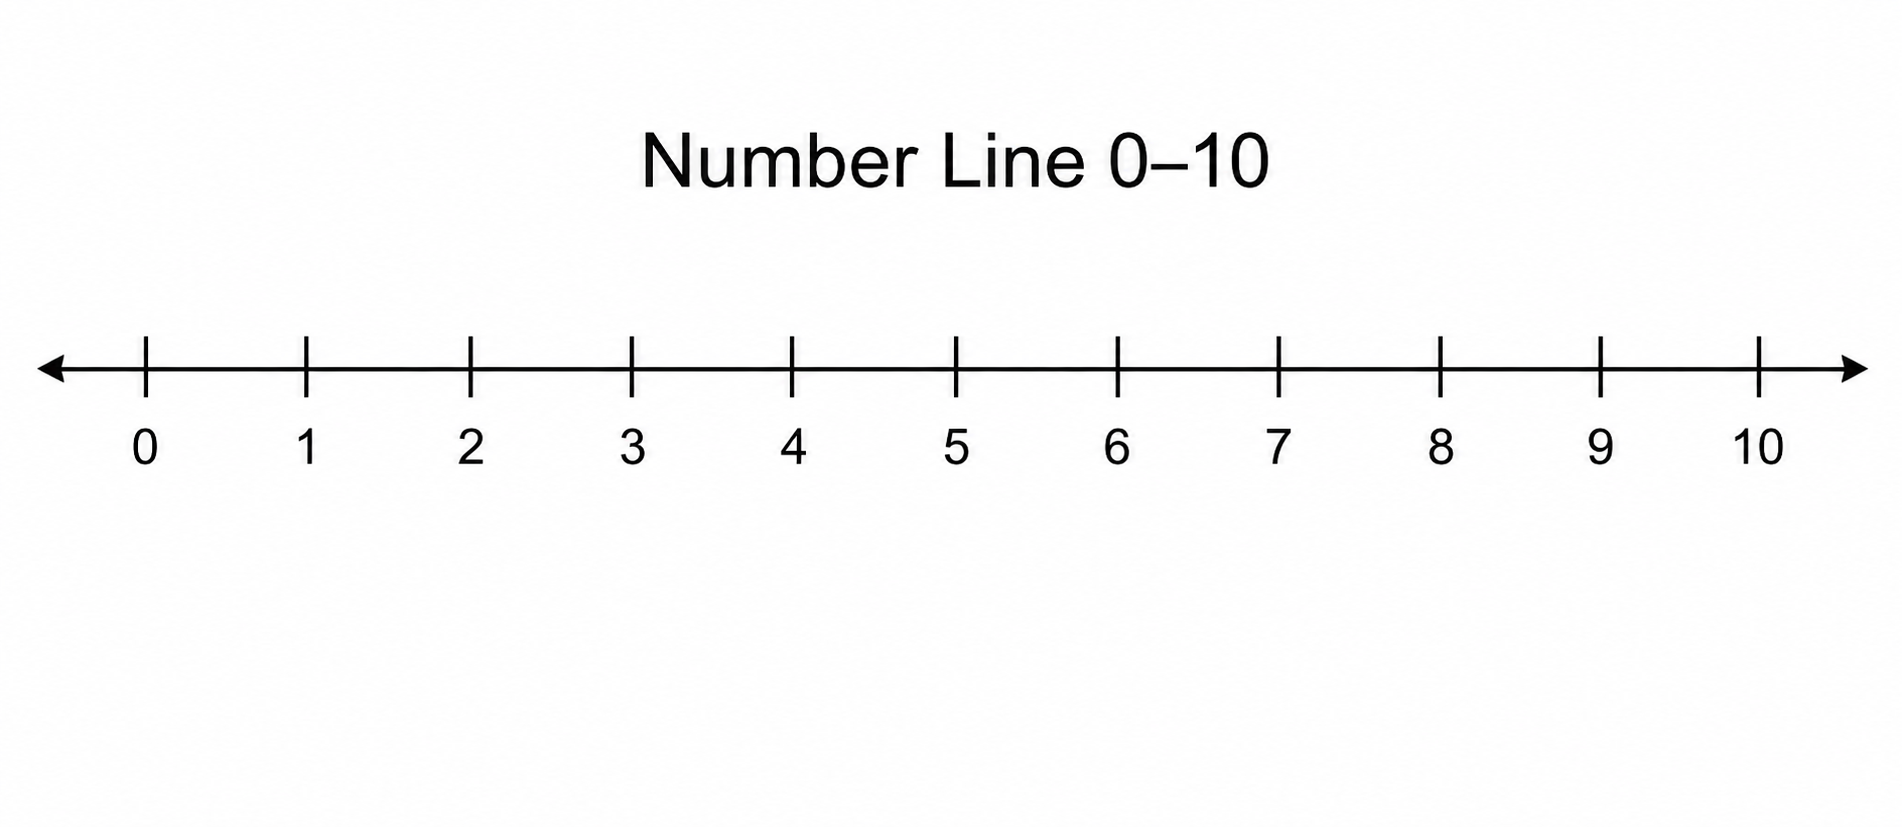
Generador de rectas numéricas
Crea rectas numéricas etiquetadas para enteros, fracciones, decimales y desigualdades a partir de una indicación de texto.
Pruébalo gratis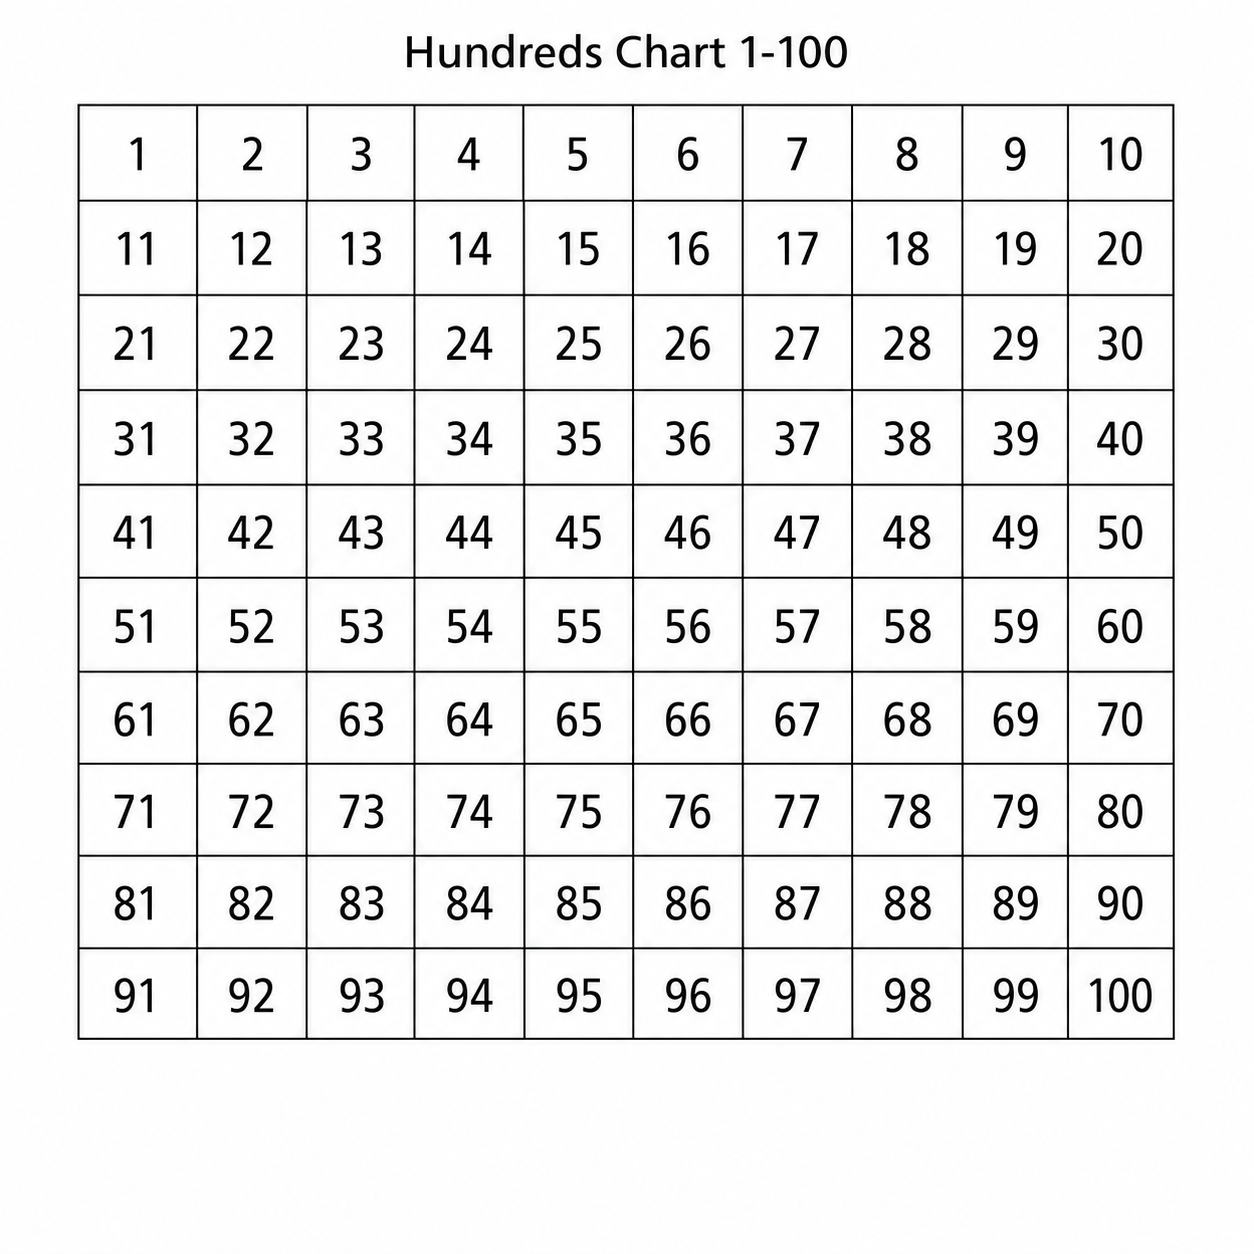
Creador de tablas del cien
Crea tablas del 1 al 100 rellenas o en blanco con conteo salteado, primos y patrones numéricos.
Pruébalo gratis
Creador de Resúmenes Gráficos
Crea resúmenes gráficos impresionantes para publicaciones
Pruébalo gratisDibuja tu tabla de valor posicional ahora
Describe las columnas y el número que necesitas y obtén una tabla de valor posicional limpia y etiquetada en segundos. Empieza gratis con SciDraw AI.