Free Moon Phases Diagram Maker
Create a labeled moon phases diagram from plain text
Describe the lunar cycle, the Sun-Earth-Moon geometry, and the labels you want, and AI draws a clean, professional moon phases diagram — ready for astronomy lessons, science homework, and classroom worksheets.
Moon phases diagram examples
Click any example to load its prompt, or use it as a starting point for your own moon phases diagram.
What is a moon phases diagram?
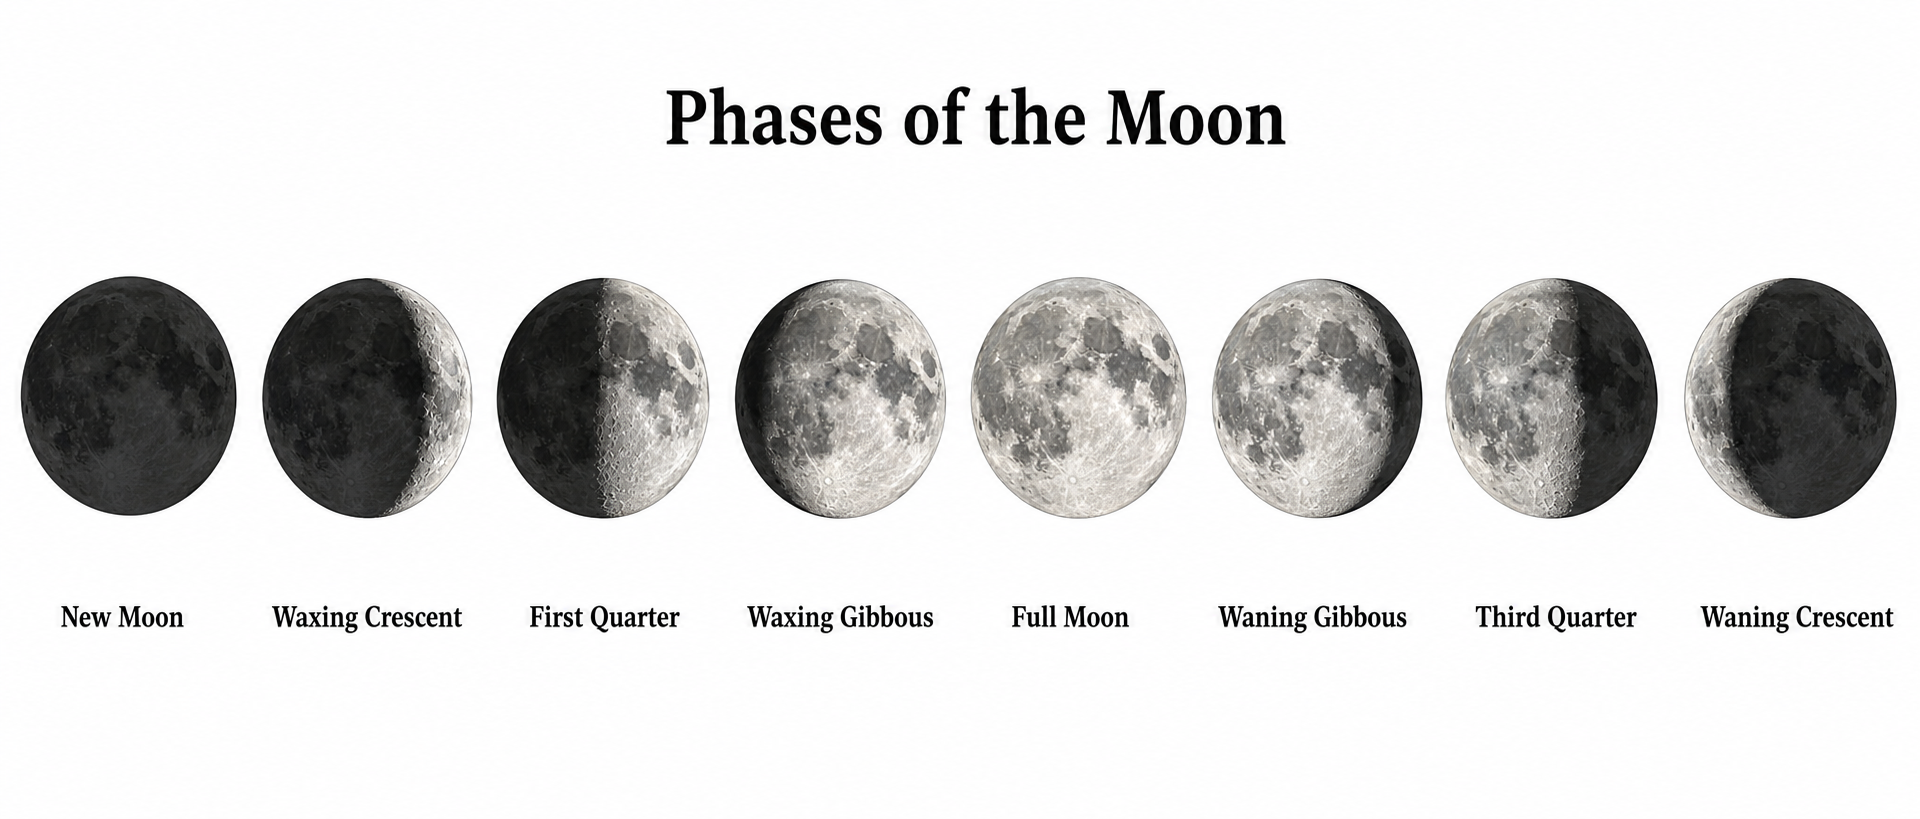
A moon phases diagram is a labeled illustration of the phases of the moon — the changing shapes the Moon appears to take as it orbits Earth, from new moon through full moon and back. It usually shows all eight phases (new moon, waxing crescent, first quarter, waxing gibbous, full moon, waning gibbous, third quarter, and waning crescent), and often the Sun-Earth-Moon geometry that causes them. This moon phases diagram maker turns a plain-text description into a clean, labeled diagram — you describe the phases, layout, and labels you want, and the AI produces a properly proportioned figure with each phase shown and named, all without drawing tools or software.
Why use a moon phases diagram maker
- Moon phases are a core topic in earth science and astronomy, and a clear diagram is the fastest way to teach the lunar cycle.
- Drawing accurate lit and shadowed moon shapes by hand or in software is fiddly and time-consuming.
- Students understand waxing, waning, and the Sun-Earth-Moon geometry far better from a clearly labeled diagram.
- Teachers and tutors need quick, presentable moon phases diagrams for slides, worksheets, and posters.
- Changing the layout, labels, or adding the Sun and Earth positions and regenerating is much faster than redrawing by hand.
How to make a moon phases diagram
Describe the phases you want shown — usually all eight, from new moon to waning crescent — and the layout you prefer, such as a single row or a circle around the Earth. Then add any features you need: phase name labels, a waxing and waning grouping, the Sun's light direction, or the Sun-Earth-Moon positions that cause each phase. Generate the moon phases diagram, check that the lit portions and labels are correct, and refine the description if anything is unclear.
Parts of a moon phases diagram
- New moon & full moon — the two extremes, with the Moon fully dark (new) or fully lit (full) as seen from Earth.
- Crescent phases — the thin waxing crescent and waning crescent, where only a small sliver of the Moon is lit.
- Quarter phases — first quarter and third quarter, where exactly half the visible disc is lit.
- Gibbous phases — waxing gibbous and waning gibbous, where more than half but not all of the disc is lit.
- Waxing vs. waning — the growing-light half (new to full) versus the shrinking-light half (full to new).
- Sun-Earth-Moon geometry — the Sun's light direction and the Moon's orbital positions around Earth that create each phase.
Moon Phases Diagram FAQ
What are the phases of the moon?
The phases of the moon are the different shapes the Moon appears to take over its roughly 29.5-day cycle as it orbits Earth. The eight main phases are new moon, waxing crescent, first quarter, waxing gibbous, full moon, waning gibbous, third quarter, and waning crescent. A moon phases diagram shows these phases in order, with each one's lit and shadowed portion, so you can see how the Moon changes from dark to fully lit and back.
How do I make a moon phases diagram online?
Type a short description of what you want, such as a labeled diagram of all eight moon phases arranged in a circle, and list the labels you need. SciDraw AI then draws a clean, accurate moon phases diagram with each phase shown and named. You can adjust the wording and regenerate until the moon phases diagram matches what your lesson or worksheet needs.
Why does the moon have phases?
The Moon has phases because of the changing geometry between the Sun, Earth, and Moon. The Sun always lights up one half of the Moon, but as the Moon orbits Earth we see different amounts of that lit half. When the Moon is between Earth and the Sun we see its dark side (new moon); when Earth is between them we see the fully lit side (full moon). The phases grow from new to full (waxing) and shrink from full back to new (waning), passing through the crescent, quarter, and gibbous phases in between.
What is the difference between waxing and waning?
Waxing means the lit part of the Moon is growing, from new moon toward full moon, and includes the waxing crescent, first quarter, and waxing gibbous. Waning means the lit part is shrinking, from full moon back toward new moon, and includes the waning gibbous, third quarter, and waning crescent. A moon phases diagram often groups the eight phases into these two halves so the cycle is easy to follow.
Is the moon phases diagram generator free?
Yes, you can start for free. Create an account and you receive free credits to generate moon phases diagrams right away, with paid plans available if you need to make many astronomy diagrams and labeled charts on a regular basis.
Can I use it for class or astronomy lessons?
Absolutely. The diagrams are well suited to earth science and astronomy classes, as well as worksheets, flashcards, lecture slides, and study guides. Generate a fully labeled moon phases diagram, or a blank version for students to label, for the exact lesson or assignment you are teaching.
Explore More Tools
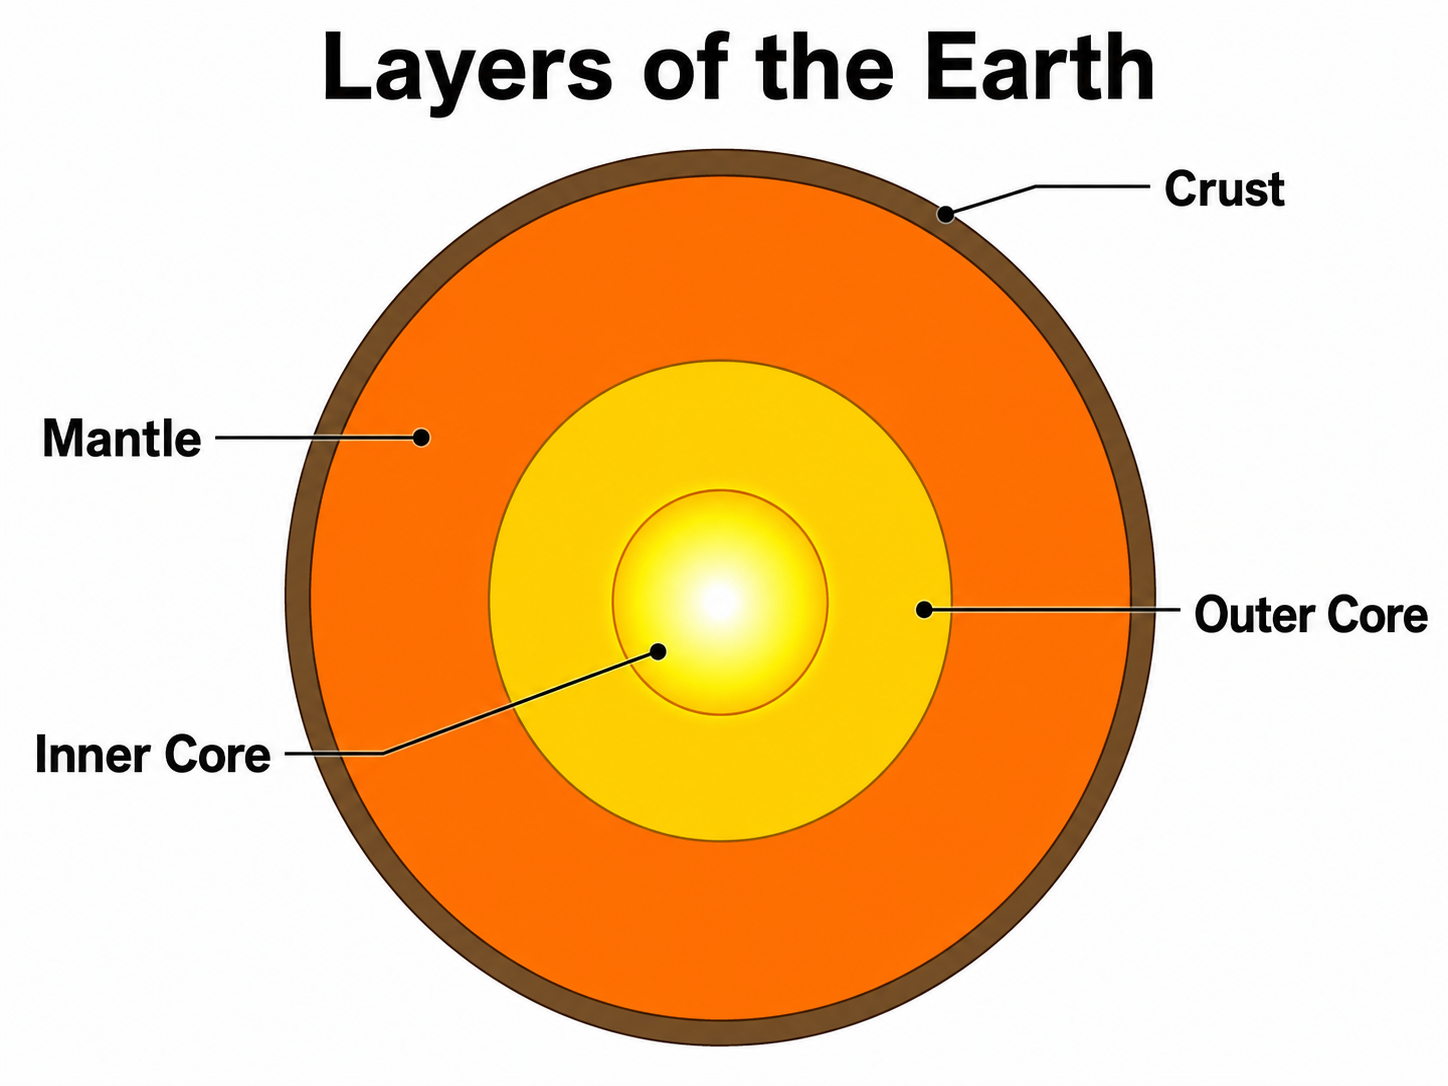
Layers of the Earth Diagram
Draw a labeled cutaway of Earth's layers — crust, mantle, outer core, and inner core.
Try it free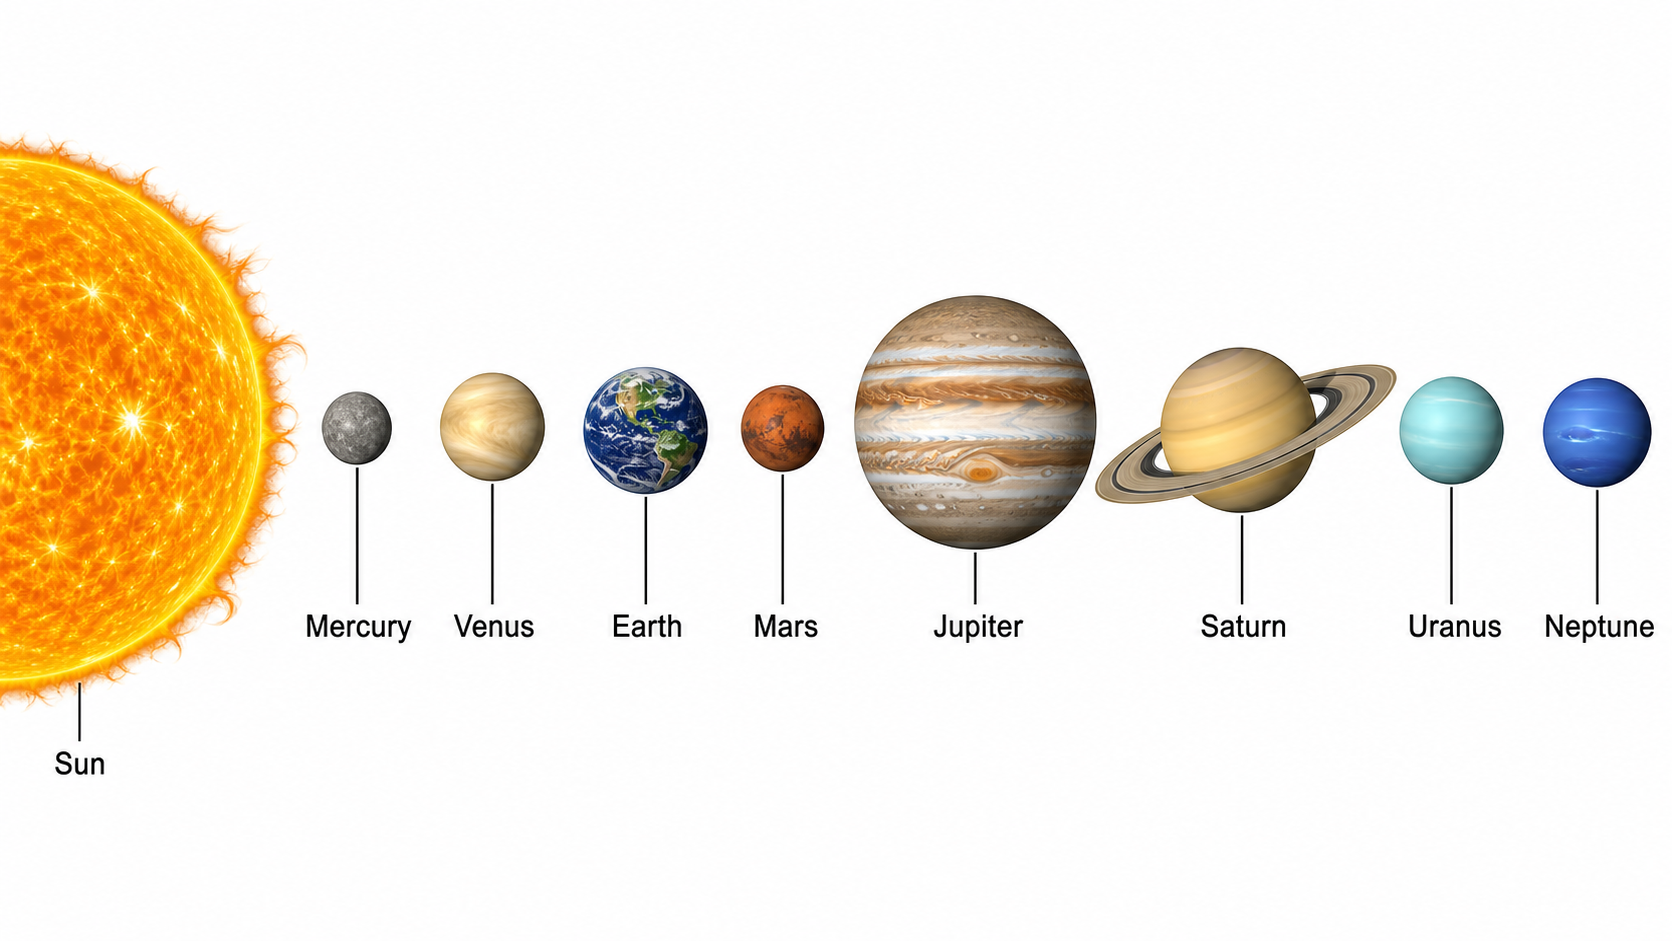
Solar System Diagram
Draw a labeled solar system with the Sun, eight planets, orbits, and the asteroid belt.
Try it free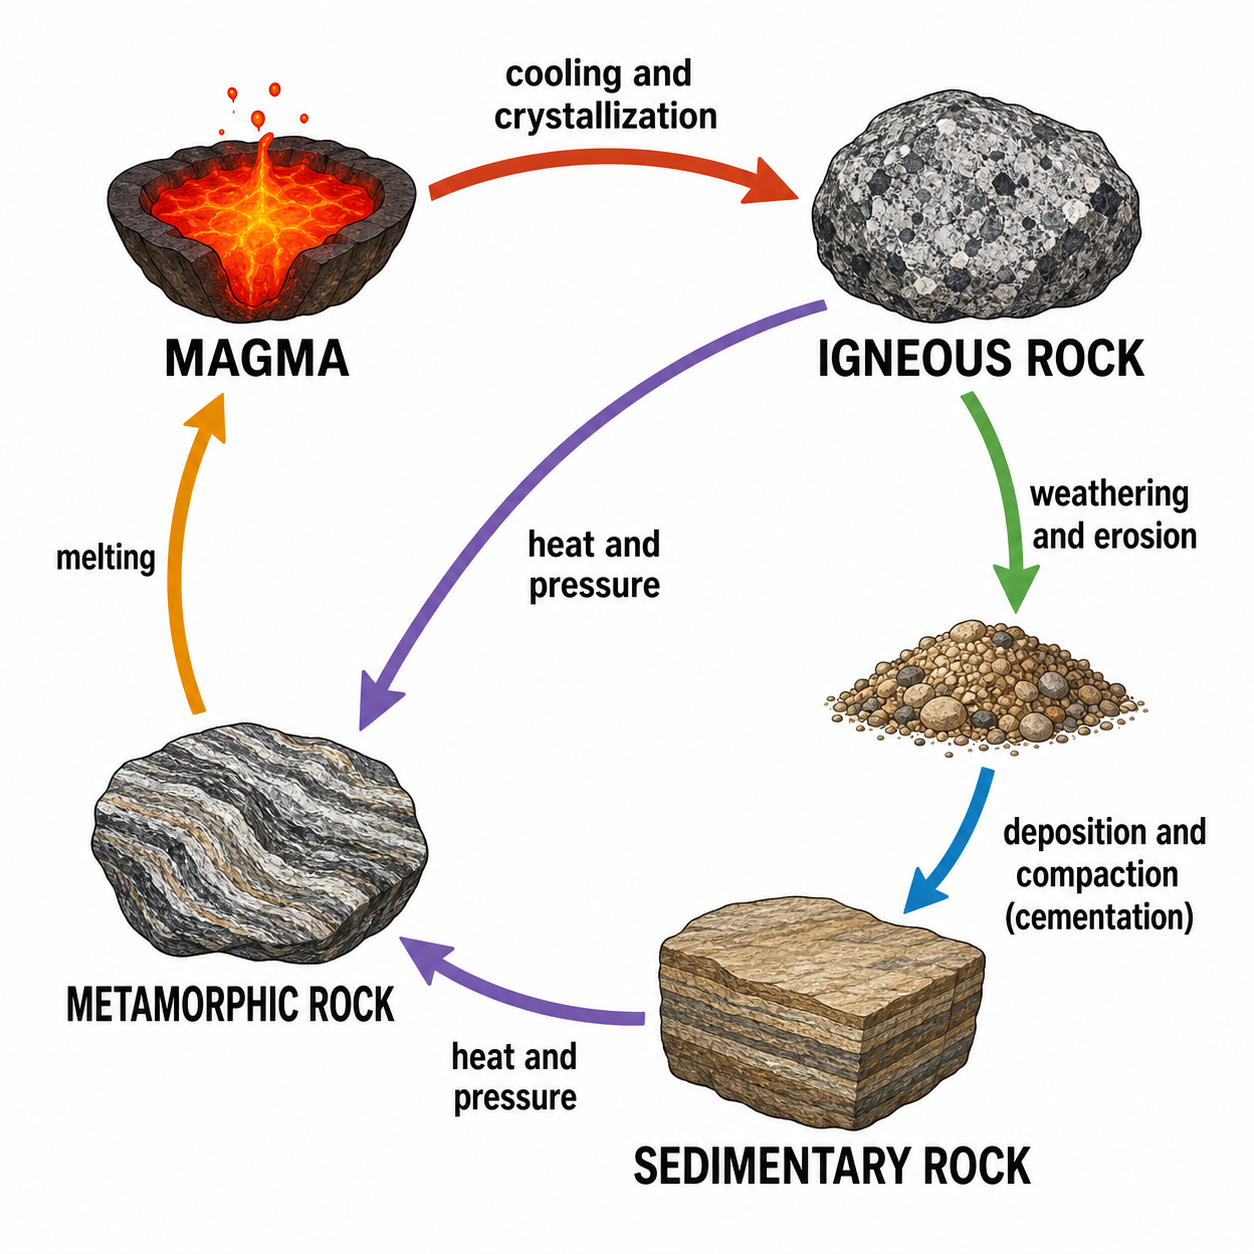
Rock Cycle Diagram Generator
Draw labeled igneous, sedimentary, and metamorphic rock cycle diagrams with AI.
Try it freeDraw your moon phases diagram now
Describe the lunar cycle and labels you need and get a clean, labeled moon phases diagram in seconds. Start free with SciDraw AI.