Boas figuras científicas exigem tempo que a maioria das pessoas não tem — e os softwares que prometem ajudar muitas vezes custam mais do que o orçamento de um estudante ou de um departamento consegue suportar. Seja para finalizar uma tese, preparar uma aula ou formatar um manuscrito para submissão, o problema central é o mesmo: você precisa de visuais claros, precisos e prontos para publicação sem uma curva de aprendizado íngreme ou uma assinatura cara.
Este guia apresenta fluxos de trabalho práticos e de baixo custo para três grupos — doutorandos, educadores e autores preparando submissões a periódicos — e indica a ferramenta certa para cada tarefa.
O que você vai aprender:
- Um fluxo de trabalho rápido e repetível para figuras de capítulos de tese, pôsteres e defesas
- Como educadores podem criar visuais didáticos claros em minutos
- O que os periódicos realmente exigem — e como atender às especificações
- Um processo de 5 etapas compartilhado e uma folha de referência de ferramentas que você pode reutilizar
O custo real das figuras científicas
Antes de falar sobre ferramentas, vale nomear os dois custos que mais pesam para os pesquisadores:
- Tempo. Uma única figura polida pode consumir uma tarde inteira — desenhando, alinhando, relabelando após o feedback, e exportando de novo. Multiplique isso por uma tese ou um artigo e são dias perdidos.
- Dinheiro. Softwares vetoriais profissionais e ferramentas científicas por usuário se acumulam rapidamente, e a maior parte do que oferecem nunca é usada para figuras do dia a dia.
Os fluxos de trabalho abaixo atacam os dois: rascunhe rapidamente a partir de texto, itere sem custo alto, e só recorra a softwares pesados quando uma figura realmente precisar.
 Os dois custos reais das figuras científicas — tempo e dinheiro — e um jeito mais tranquilo de trabalhar com o SciDraw AI.
Para doutorandos: figuras de tese, pôsteres e defesas
Uma dissertação pode precisar de dezenas de figuras: diagramas de fluxo de trabalho, modelos conceituais, esquemas de mecanismos e um ou dois resumos gráficos. Fazê-los manualmente em software vetorial é lento, e redesenhá-los após cada comentário do orientador é pior ainda.
Um ciclo mais rápido:
- Rascunhe a partir de texto. Descreva a figura e gere uma primeira versão com o criador de figuras científicas ou um criador de resumo gráfico.
- Itere sem custo. Regenere variações em vez de realinhar caixas manualmente a cada rodada de feedback.
- Exporte no formato que você precisa — um roteiro de pesquisa para sua banca, uma figura em formato de pôster para uma conferência, ou slides para a defesa.
Onde cada tipo de figura se encaixa:
| Necessidade | Comece com |
|---|---|
| Figura conceitual/geral da tese | Criador de figuras científicas |
| Resumo gráfico do artigo | Criador de resumo gráfico |
| Fluxo de métodos / experimental | Gerador de diagrama de fluxo de trabalho |
| Roteiro para banca / financiamento | Criador de roteiro de pesquisa |
Mais dicas e exemplos na página do SciDraw AI para doutorandos.
Para educadores: visuais claros, rapidamente
Figuras para ensino têm um objetivo diferente: clareza acima de detalhes. Um diagrama para um slide de aula ou uma folha de exercícios deve ser legível do fundo da sala e simples o suficiente para os alunos acompanharem na primeira leitura.
O que funciona para educadores:
- Gere diagramas limpos e rotulados (células, ciclos, processos) em linguagem natural com o gerador de ilustrações celulares ou o criador de ilustrações para livros didáticos.
- Mantenha um estilo visual consistente ao longo de um curso para que os alunos reconheçam conceitos recorrentes de semana a semana.
- Exporte para PPTX editável para inserir figuras diretamente nos slides e ajustar rótulos por turma — use a ferramenta Vectorize Image para obter uma versão editável no PowerPoint com rótulos de texto reais.
- Torne os materiais acessíveis: prefira paletas de alto contraste e seguras para daltônicos para que todos os alunos consigam lê-los.
Veja a página do SciDraw AI para educadores para mais informações.
Para submissão a periódicos: atenda às especificações
Revisores e editores de produção são rigorosos quanto às figuras. Os motivos mais comuns de rejeição são técnicos, não científicos:
| Requisito | Especificação típica do periódico |
|---|---|
| Resolução | 300 DPI (cor/halftone), 600–1000 DPI (arte em linha) |
| Formato de arquivo | TIFF, EPS ou PDF de alta qualidade |
| Modo de cor | CMYK ou RGB conforme o periódico |
| Fontes e rótulos | Incorporados, legíveis no tamanho impresso |
| Acessibilidade | Paletas seguras para daltônicos |
Um fluxo de trabalho pronto para submissão:
- Finalize a figura, depois exporte PNG/PDF/TIFF pronto para impressão com o conversor de imagens científicas.
- Verifique os requisitos do periódico — DPI, modo de cor e segurança para daltônicos — com o verificador de figuras.
- Escreva a legenda com o gerador de legenda de figura para que cada painel seja descrito da forma que os revisores esperam.
Checklist completo na página de submissão a periódicos.
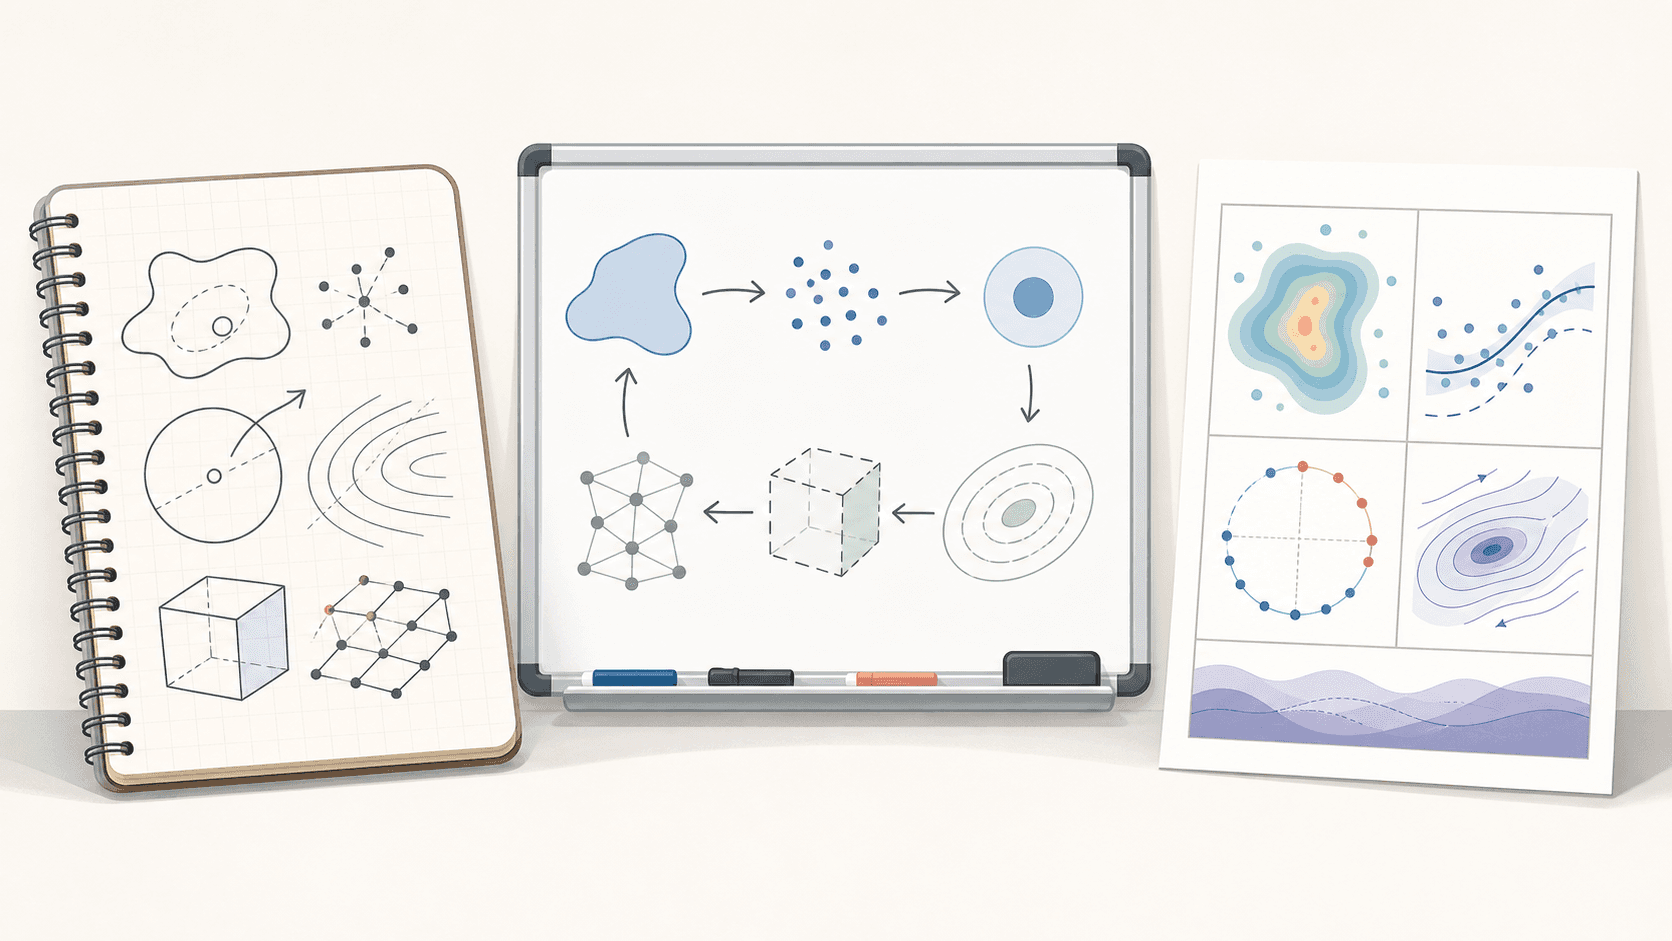
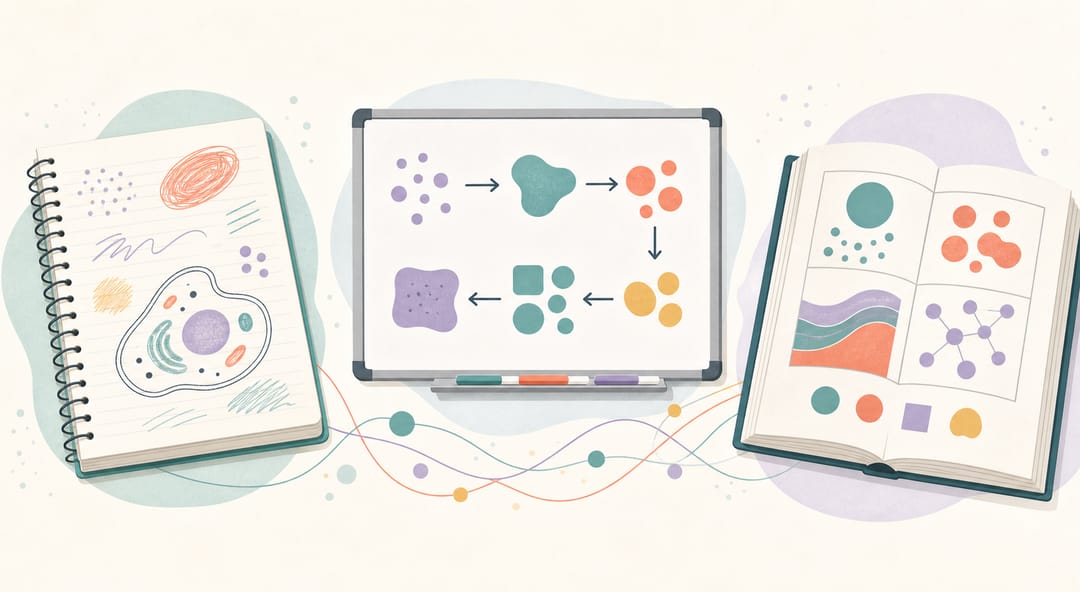 Três públicos, um único conjunto de ferramentas — rascunhos de caderno, diagramas de aula e figuras prontas para periódico passam todos pelo SciDraw AI.
O fluxo de trabalho compartilhado de 5 etapas
Independentemente do grupo em que você se encaixa, o mesmo ciclo funciona:
- Descreva a figura em uma ou duas frases simples.
- Gere um primeiro rascunho em vez de começar de um canvas em branco.
- Refine — regenere ou edite até que o conteúdo esteja correto.
- Exporte no formato que seu público precisa (PPTX para slides, SVG para edição, TIFF/PDF para periódicos).
- Verifique os requisitos — precisão primeiro, depois especificações técnicas como DPI e modo de cor.
 O ciclo comum de cinco etapas: descrever, gerar, refinar, exportar e verificar.
Folha de referência de ferramentas
| Seu objetivo | Use |
|---|---|
| Rascunhar qualquer figura a partir de texto | AI Drawing |
| Resumo gráfico | Criador de resumo gráfico |
| PPTX / SVG editável de uma figura | Vectorize Image |
| PNG / PDF / TIFF pronto para impressão | Conversor de imagens científicas |
| Verificar conformidade com o periódico | Verificador de figuras |
| Escrever uma legenda de figura | Gerador de legenda de figura |
Erros comuns a evitar
- Exportar na resolução de tela. Slides e capturas de tela normalmente têm 72–96 DPI e ficam desfocados na impressão. Sempre exporte no DPI exigido pelo periódico.
- Estilo inconsistente. Cores, fontes e estilos de seta diferentes entre as figuras de um artigo parecem pouco profissional — defina um estilo uma vez e reutilize-o.
- Escrever legendas no final, às pressas. Uma legenda vaga pode confundir os revisores. Rascunhe-a cedo com um gerador de legenda de figura e refine.
- Ignorar acessibilidade. Paletas vermelho/verde são ilegíveis para leitores daltônicos; verifique com um verificador de figuras.
Uma plataforma, três usos
O fio condutor entre os três grupos é o mesmo: rascunhe rapidamente a partir de texto, refine e exporte no formato exato que seu público precisa — slides para ensino, pôsteres para conferências, TIFF para periódicos. Isso é muito mais barato e rápido do que aprender softwares vetoriais profissionais ou pagar assinaturas por usuário.
Comece a criar com SciDraw AI — créditos gratuitos, sem necessidade de assinatura.
Perguntas frequentes
Qual é a maneira mais barata de fazer figuras para a tese? Gere rascunhos a partir de texto com uma ferramenta de IA que oferece créditos gratuitos e depois refine. Isso evita tanto softwares caros quanto horas de desenho manual.
Consigo obter um PowerPoint editável de uma figura? Sim — converta qualquer figura para PPTX editável (com rótulos de texto reais) usando a ferramenta Vectorize Image.
Como sei se minha figura atende aos requisitos de um periódico? Passe-a por um verificador de figuras que valida DPI, modo de cor, fontes e paletas seguras para daltônicos antes de submeter.
Qual resolução os pôsteres de conferência precisam? Mire em pelo menos 150 DPI no tamanho de impressão completo para pôsteres grandes, e 300 DPI para figuras que também aparecerão em um artigo. Exporte com o conversor de imagens científicas.
Estudantes e educadores podem usar as mesmas ferramentas? Sim. Os mesmos geradores funcionam para figuras de tese, visuais de aula e gráficos prontos para submissão — apenas o formato de exportação e o nível de polimento mudam.