Labeled Action Potential Graph Maker
Create Labeled Action Potential Graph Maker from experimental or research data
Make a labeled action potential graph from data: resting potential, threshold, depolarization, peak, repolarization, hyperpolarization and refractory periods.
Create your scientific chart
Drag a data file here, or click to upload
CSV, TSV, TXT, Excel · Max 5MB
Preview
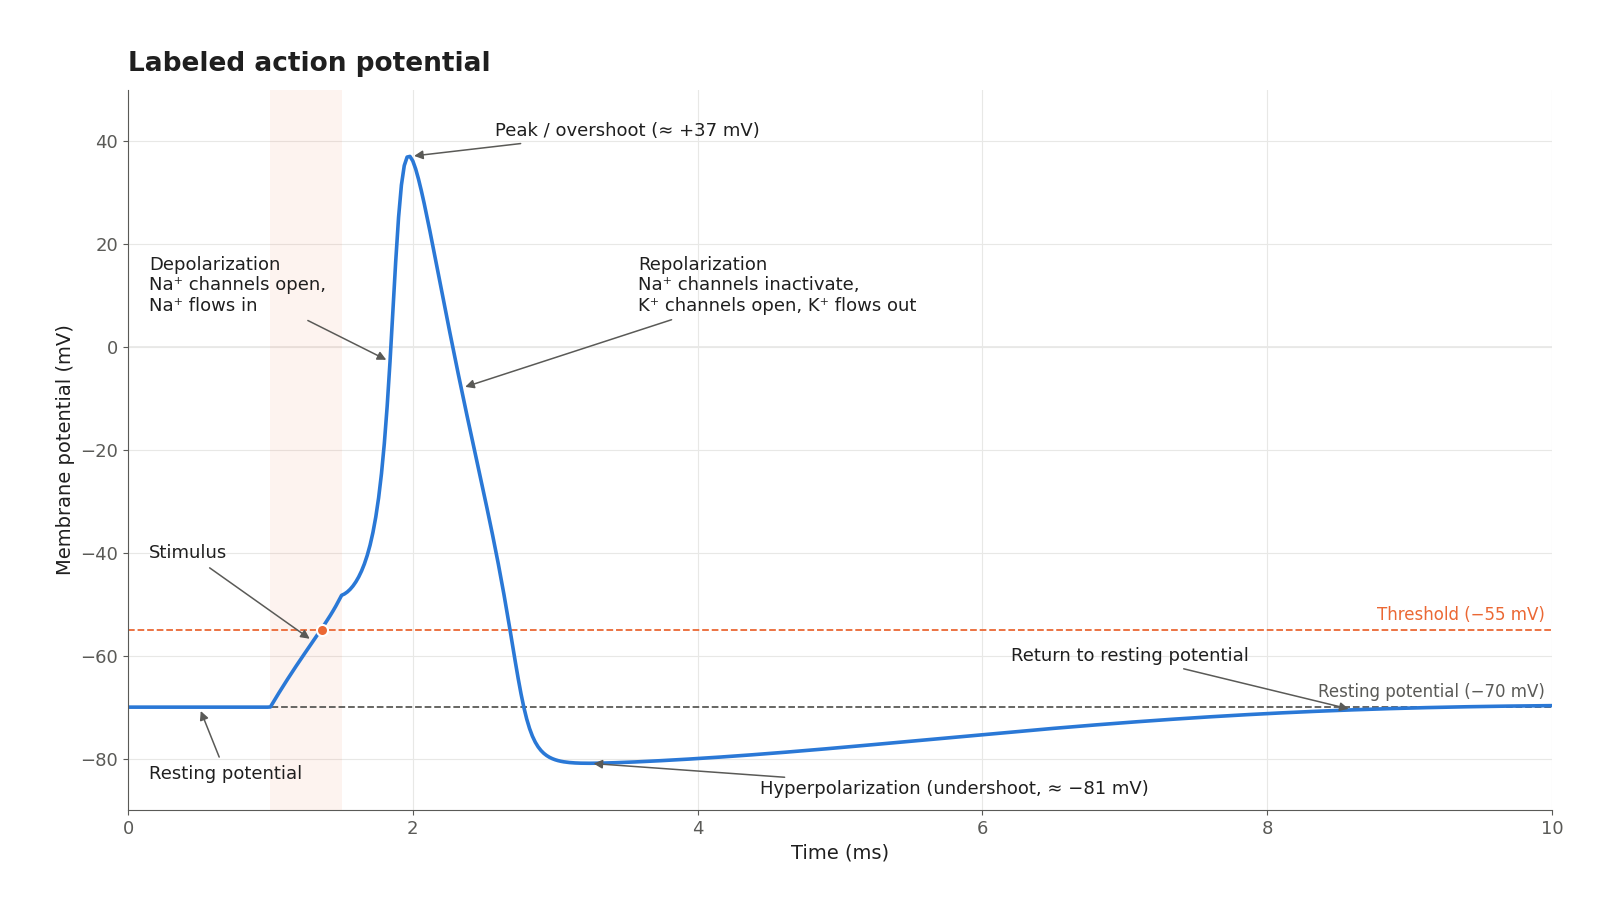 Example
This preview uses the selected sample dataset. Generate it with Python, or upload your own data to create a new chart.
Action potential graph examples with downloadable data
Every trace comes from a Hodgkin–Huxley-type simulation of a neuron. Open an example to inspect the graph, download its CSV, or load the same data into the generator above.
What is an action potential graph?
An action potential graph plots membrane potential (mV) on the y-axis against time (ms) on the x-axis for the brief electrical impulse a neuron fires. The membrane sits at a resting potential of about −70 mV until a stimulus depolarizes it to threshold, about −55 mV. Voltage-gated Na⁺ channels then open and Na⁺ rushes in, driving a rapid depolarization to a peak of roughly +30 to +40 mV within about a millisecond. Na⁺ channels inactivate and voltage-gated K⁺ channels open, so K⁺ flows out and the membrane repolarizes, overshooting into a brief hyperpolarization near −80 mV before it returns to rest. This tool draws that curve from numbers — your own recording or the included simulated data — so every phase sits at the right value, then lets you label, shade or blank it out in SciVis.
Data for an action potential graph
- Two numeric columns: time in ms and membrane potential in mV. Sample every 0.01–0.1 ms so the fast upstroke stays smooth.
- Optional text columns such as phase or refractory_period mark the regions to label or shade.
- To compare traces, use long format: one row per time point per trace, with a column such as stimulus naming each trace.
- Put units in the headers (time_ms, membrane_potential_mV) and remove notes, totals and blank rows before uploading.
Action potential graphs for biology and neuroscience classes
- Labeled Action Potential
- Absolute and Relative Refractory Periods
- Blank Action Potential Worksheet
- All-or-None Principle
- Na⁺ and K⁺ Conductance During an Action Potential
- Action Potential and Equilibrium Potentials
Why make an action potential graph from data?
- The resting potential, threshold, peak and undershoot land at the correct millivolt values instead of a hand-drawn guess.
- One trace gives you a fully labeled answer key, a refractory-period version and a blank A–H worksheet.
- Subthreshold and suprathreshold traces on one set of axes make the all-or-none principle obvious.
- Swap in your own lab recording or simulation and keep the same clean layout.
- Labels, colors and export stay editable in SciVis for slides, handouts and lab reports.
How to use Labeled Action Potential Graph Maker
Choose an example or upload one CSV, TSV, TXT, XLSX, or XLS file, check the detected columns, generate the chart, and continue editing it in SciVis. For Excel files, the first worksheet is imported.
What a labeled action potential graph should show
- Time (ms) on the x-axis and membrane potential (mV) on the y-axis, with 0 mV in range so the overshoot is visible.
- Dashed reference lines for the resting potential (about −70 mV) and the threshold (about −55 mV).
- Depolarization: voltage-gated Na⁺ channels open and Na⁺ flows into the cell.
- Repolarization: Na⁺ channels inactivate while voltage-gated K⁺ channels open and K⁺ flows out.
- Hyperpolarization: K⁺ channels close slowly, so the membrane briefly dips below rest toward E_K.
- Optional shading for the absolute and relative refractory periods, or Na⁺ and K⁺ conductance on a separate panel.
Absolute vs relative refractory period
During the absolute refractory period — from threshold through most of repolarization — voltage-gated Na⁺ channels are either already open or inactivated, so no second action potential can fire, however strong the stimulus. During the relative refractory period, which covers the undershoot, enough Na⁺ channels have recovered for a second spike, but K⁺ conductance is still high and the membrane is further from threshold, so only a stronger-than-normal stimulus works. Refractory periods cap how fast a neuron can fire and keep the impulse travelling one way along the axon.
Labeled Action Potential Graph Maker FAQ
What are the labeled parts of an action potential graph?
From left to right: the resting potential (about −70 mV); the stimulus, which depolarizes the membrane to threshold (about −55 mV); depolarization, when voltage-gated Na⁺ channels open and Na⁺ rushes in; the peak or overshoot (about +30 to +40 mV); repolarization, when Na⁺ channels inactivate and K⁺ flows out through voltage-gated K⁺ channels; hyperpolarization (the undershoot), when the membrane briefly falls below rest; and the return to the resting potential. The dashed lines for rest and threshold are usually labeled too.
What does the all-or-none principle mean on an action potential graph?
A stimulus that fails to reach threshold produces only a small, local depolarization that fades back to rest. Any stimulus that reaches threshold fires a full action potential of about the same height, because the opening of Na⁺ channels feeds on itself once it starts. A stronger stimulus does not make a bigger spike; it makes the neuron fire more often and, in a nerve, recruits more neurons.
Can I edit a figure after creating it with Labeled Action Potential Graph Maker?
Yes. Open the figure generated with Labeled Action Potential Graph Maker in SciVis to change labels, colors, annotations, layout, and other visual settings.
Can I use figures from Labeled Action Potential Graph Maker in a research paper?
Yes. Labeled Action Potential Graph Maker is designed to produce clean, publication-ready scientific figures. Always verify values and journal requirements before submission.
Can Labeled Action Potential Graph Maker export high-resolution figures?
Yes. After editing a Labeled Action Potential Graph Maker figure in SciVis, you can export it in formats suitable for papers, posters, slides, and reports.
Do I need coding experience to use Labeled Action Potential Graph Maker?
No. Labeled Action Potential Graph Maker creates the first version through a guided upload workflow, while SciVis provides visual controls for refinements.
Learn how to use Labeled Action Potential Graph Maker with research data
Review chart selection, required data columns, interpretation, and related scientific visualization workflows before preparing your final figure.
Explore More Tools
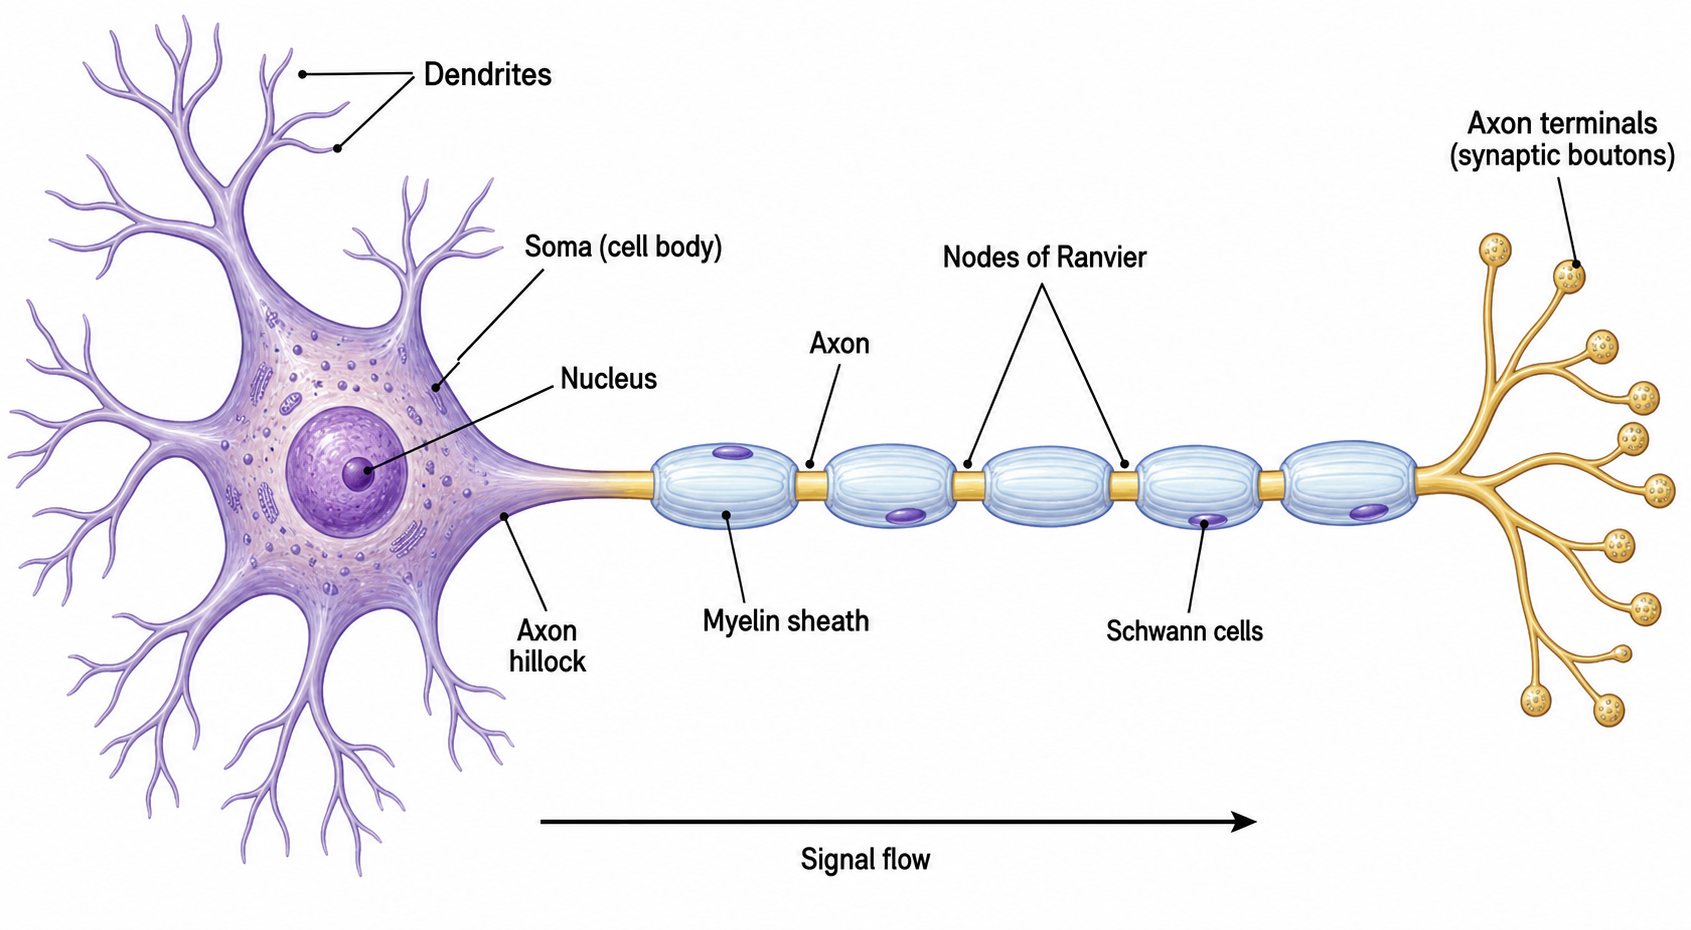
Neuron Diagram Generator
Draw labeled nerve cells with dendrites, axon, myelin, and synapses.
Try it free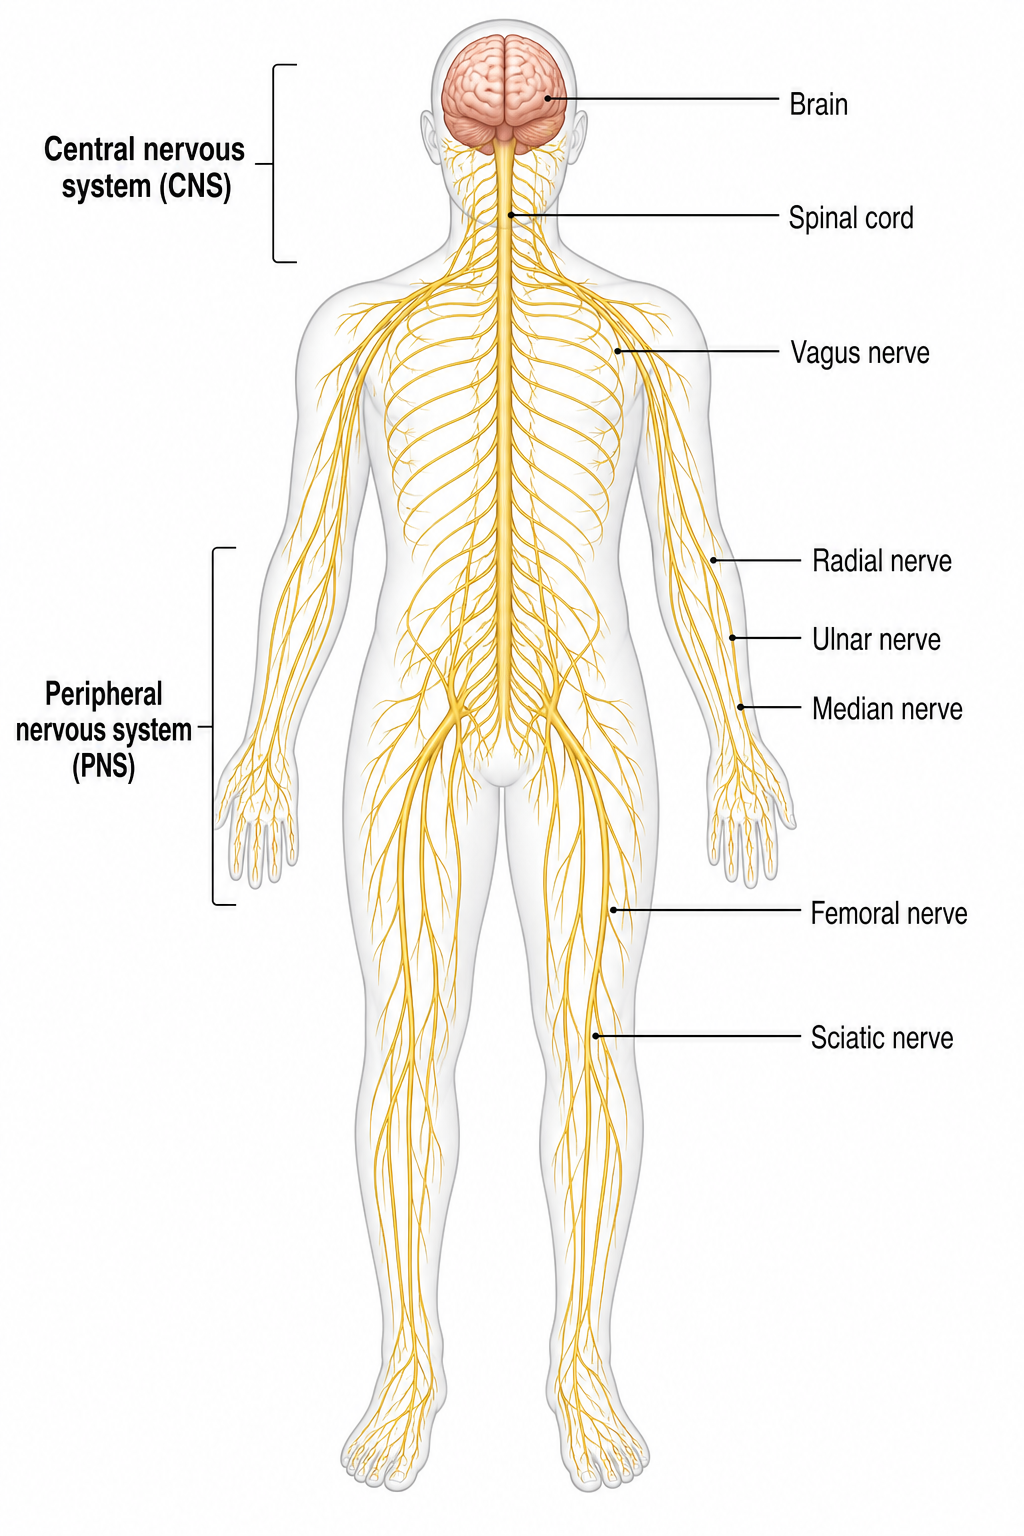
Nervous System Diagram Generator
Draw a labeled human nervous system, central and peripheral divisions, and nerves with AI
Try it free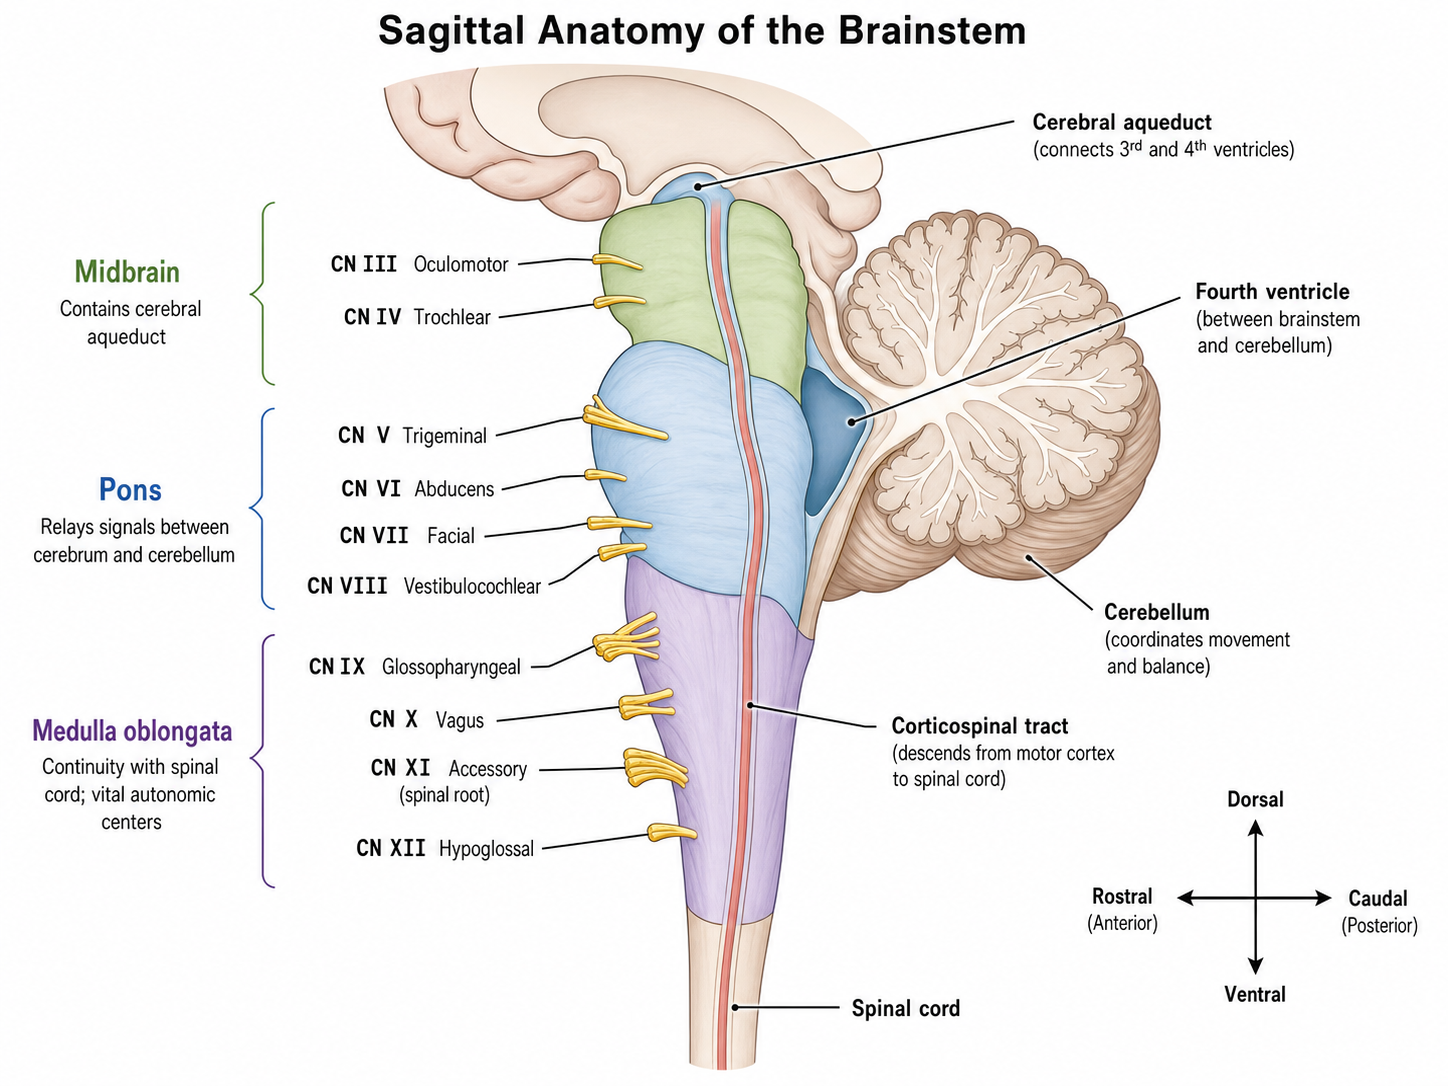
Brainstem Diagram Generator
Create brainstem diagram visuals for midbrain, pons, medulla, cranial nerve nuclei, tracts, vascular territories, and clinical lesion callouts.
Try it freeCreate a figure with Labeled Action Potential Graph Maker
Start with sample data or upload one supported data file, then finish the figure in SciVis.