
心電圖 (ECG) 圖表是需求最高的醫學視覺效果之一,因為學習者需要同時具備三項要素:波形準確性、標籤清晰度以及並列比較。通用的圖片提示詞通常在這三方面都會失敗。
本指南為您提供了一個實用的 ECG 提示詞系統,以及 30 個您可以立即在 SciDraw AI 中使用的模板。
使用場景:醫學教育投影片、考試複習講義、床邊教學以及可用於發表的概念圖表。
為什麼 ECG 提示詞通常會失敗
大多數提示詞都太短,例如:「畫一個三度心臟傳導阻滯的 ECG」。這通常會產生過於藝術化的軌跡、缺失標籤或臨床上不一致的間期。
強大的 ECG 提示詞應包含:
- 臨床情境(什麼樣的節律或病理)
- 波形規則(PR、QRS、ST、T 波的具體表現)
- 面板結構(單條圖 vs 並列比較)
- 標註要求(導程名稱、箭頭、間期數值標籤)
- 教學背景(學生程度和預期學習目標)
準確 ECG 圖表的提示詞公式
使用此結構:
Create a medical teaching ECG diagram of [condition].
Layout: [single strip / 2-panel / 4-panel comparison], white background.
Show leads: [lead II / V1-V6 / 12-lead summary].
Waveform rules: [PR/QRS/ST/T specifics].
Add labels: [key findings, arrows, interval values].
Style: clean textbook-style vector, high contrast, publication-ready.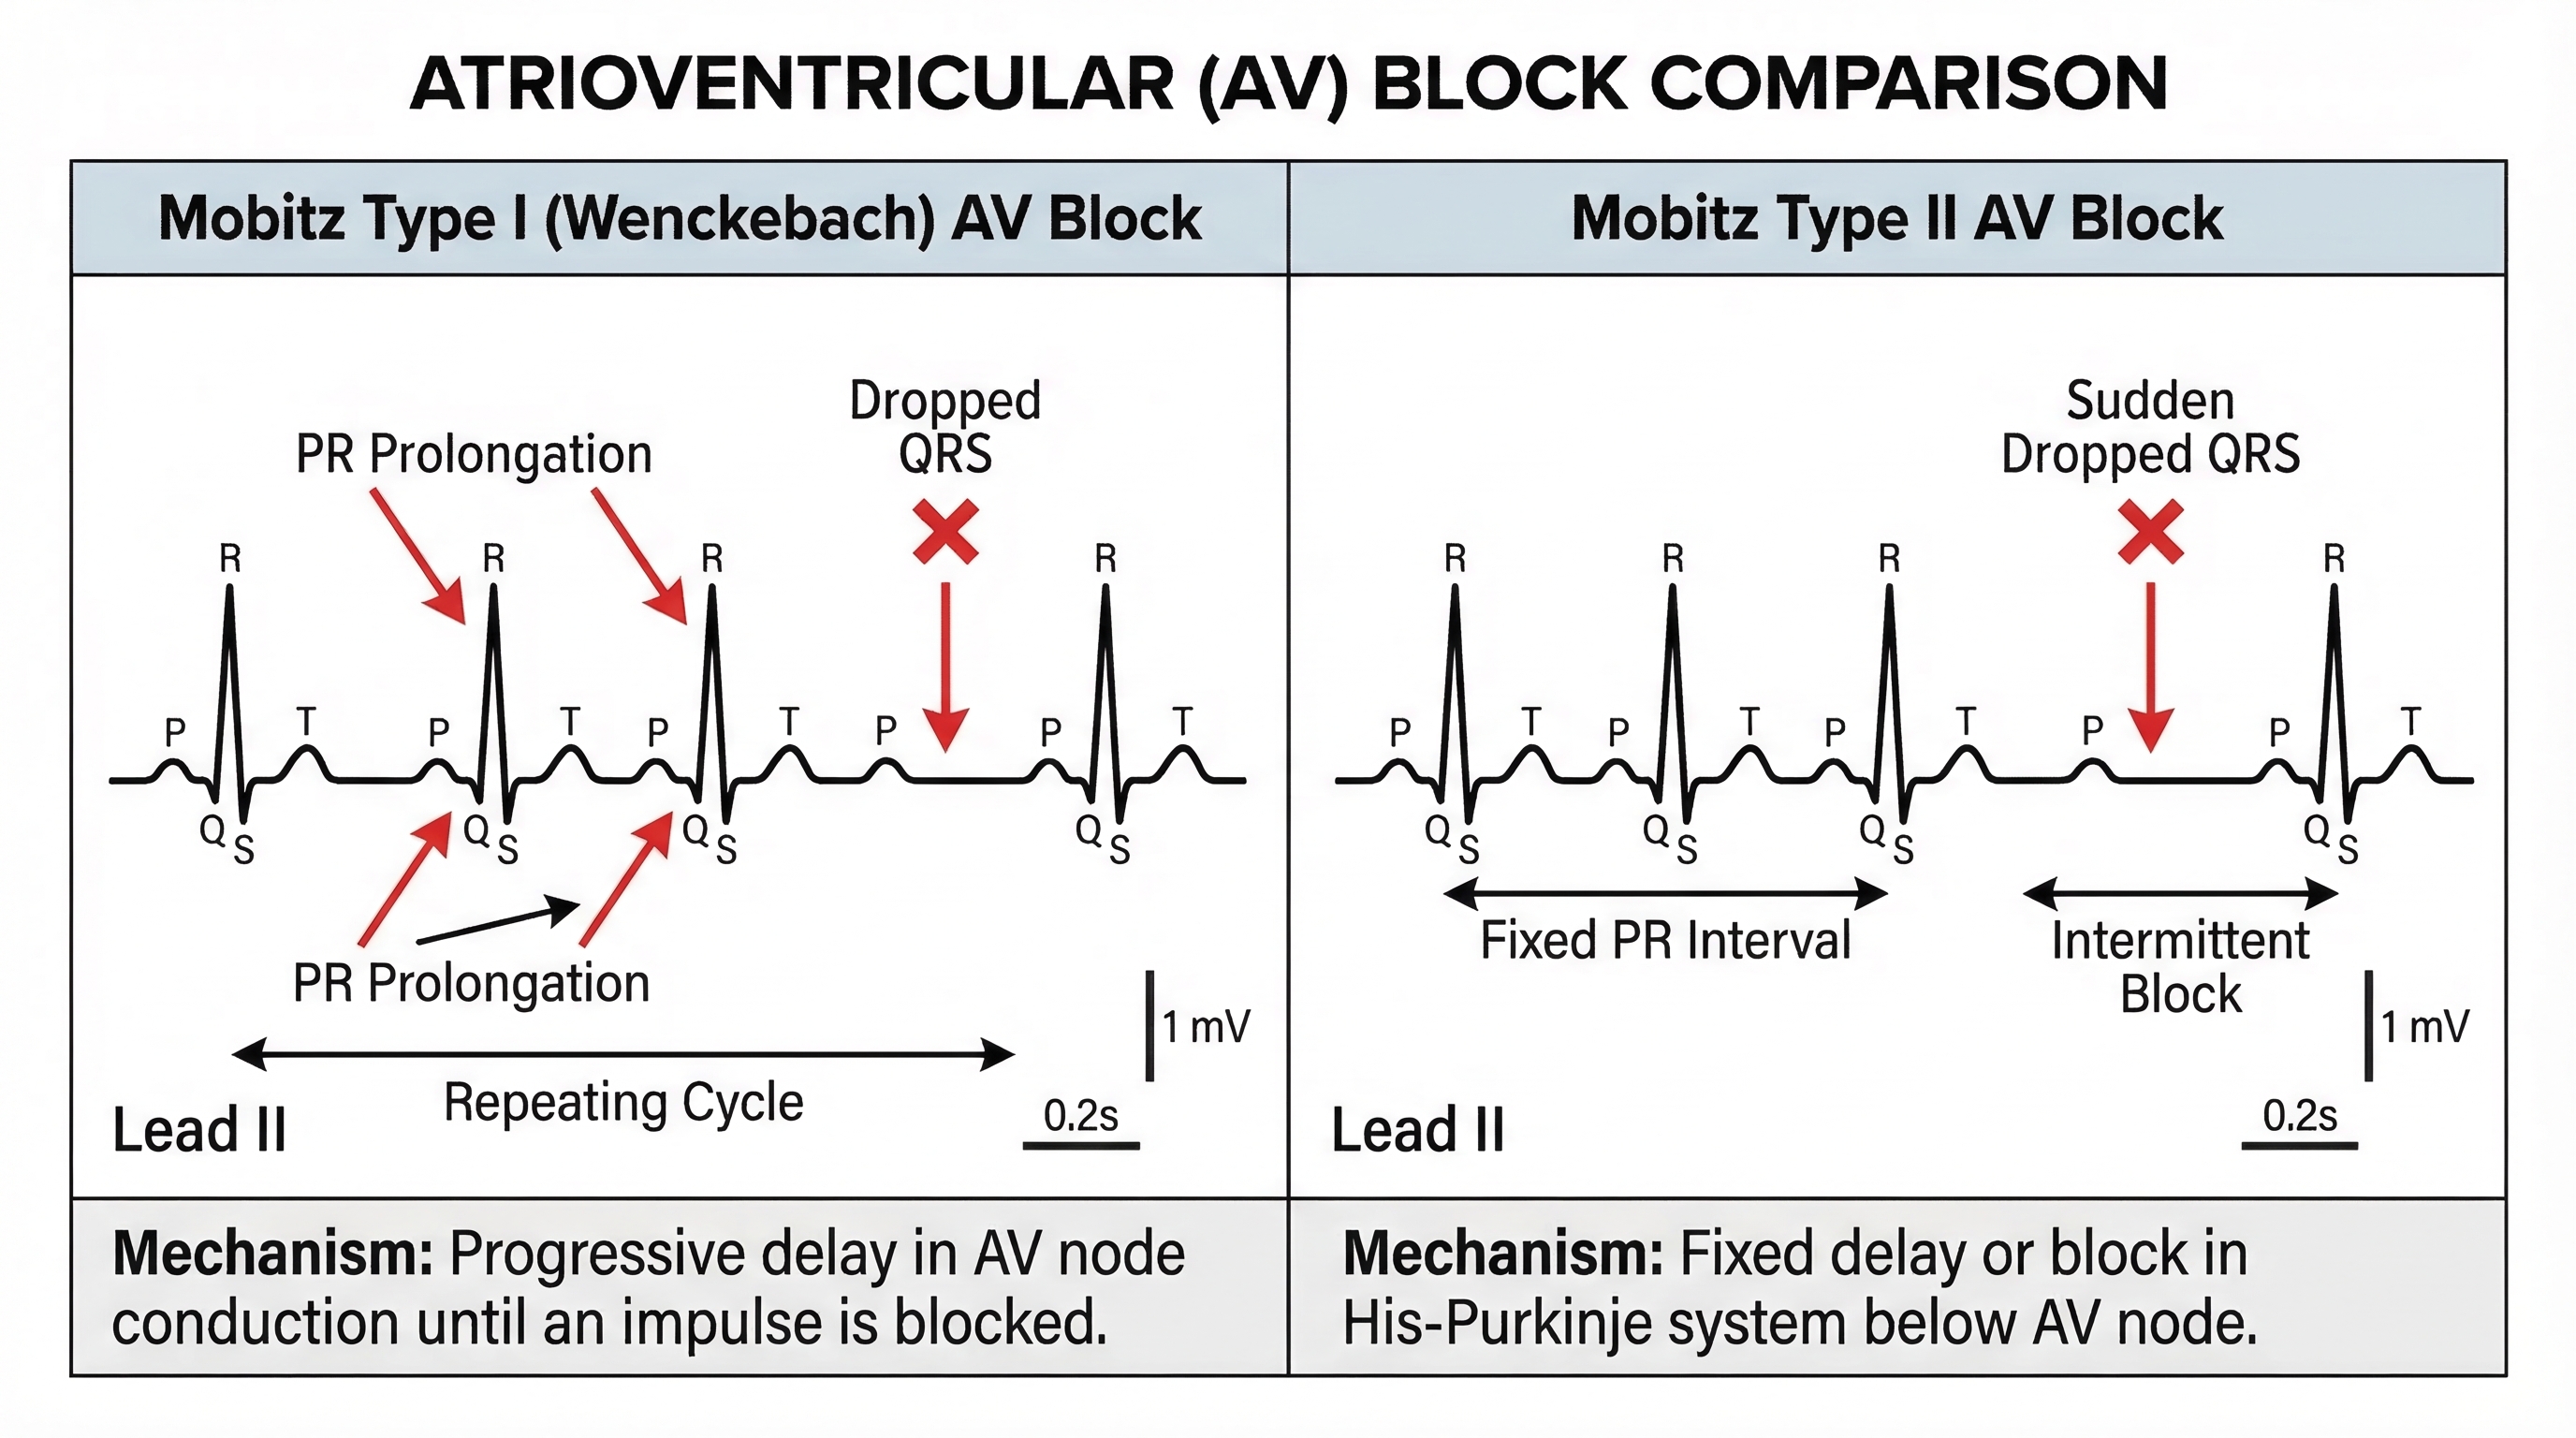
30 個 ECG 提示詞模板
1) 傳導阻滯 (Conduction Blocks)
Third-degree AV block ECG teaching diagram, 2-panel layout.
Panel A: normal sinus rhythm reference. Panel B: complete AV dissociation with
independent P waves and QRS escape rhythm. Label PR inconsistency, slow
ventricular rate, and AV dissociation arrows. Clean textbook style.
Mobitz I vs Mobitz II comparison ECG, side-by-side.
Left: progressive PR prolongation before dropped QRS. Right: fixed PR with
intermittent non-conducted P wave. Add interval callouts and color-coded labels.First-degree AV block ECG, lead II strip with normal morphology but prolonged
PR interval >200 ms. Add measurement bars and label thresholds.2) 缺血與梗塞 (Ischemia and Infarction)
STEMI localization ECG chart, 4-panel grid.
Inferior, anterior, lateral, and posterior patterns with affected leads and
reciprocal changes labeled. Include artery correlation notes.
NSTEMI vs STEMI ECG teaching figure, 2-panel comparison.
Left: NSTEMI ST depression/T inversion pattern. Right: STEMI ST elevation with
contiguous leads. Add decision labels for emergency pathway.Hyperacute T wave progression to ST elevation timeline in acute MI, 3-stage
horizontal diagram with clear temporal arrows.3) 節律不整辨識 (Arrhythmia Recognition)
Atrial fibrillation ECG teaching figure, irregularly irregular rhythm,
no discrete P waves, variable R-R intervals. Add rhythm strip markers.
Atrial flutter ECG with sawtooth flutter waves and 2:1 conduction example.
Include lead II emphasis and comparison inset with sinus rhythm.SVT vs ventricular tachycardia quick differentiation chart with QRS width,
rate range, and AV relationship labels.4) 波形形態與電解質 (Wave Morphology and Electrolytes)
T-wave morphology atlas ECG panel: peaked T wave, inverted T wave,
biphasic T wave, and hyperacute T wave with labels and clinical hints.
Hyperkalemia progression ECG sequence: peaked T, PR prolongation,
QRS widening, sine-wave morphology. Four-stage panel with arrows.Osborn wave (J wave) educational ECG figure in hypothermia context,
with notch labeling at J point and differential notes.5) 教學與評估版面 (Teaching and Assessment Layouts)
ECG interpretation checklist infographic for medical students.
Sections: rate, rhythm, axis, intervals, morphology, ischemia signs.
Include icon-based flow and quick examples.
12-lead ECG systematic reading workflow, top-to-bottom algorithm chart with
branch decisions and common pitfalls.ECG exam review summary page with mini-strips and key diagnostic clues,
optimized for one-page print handout.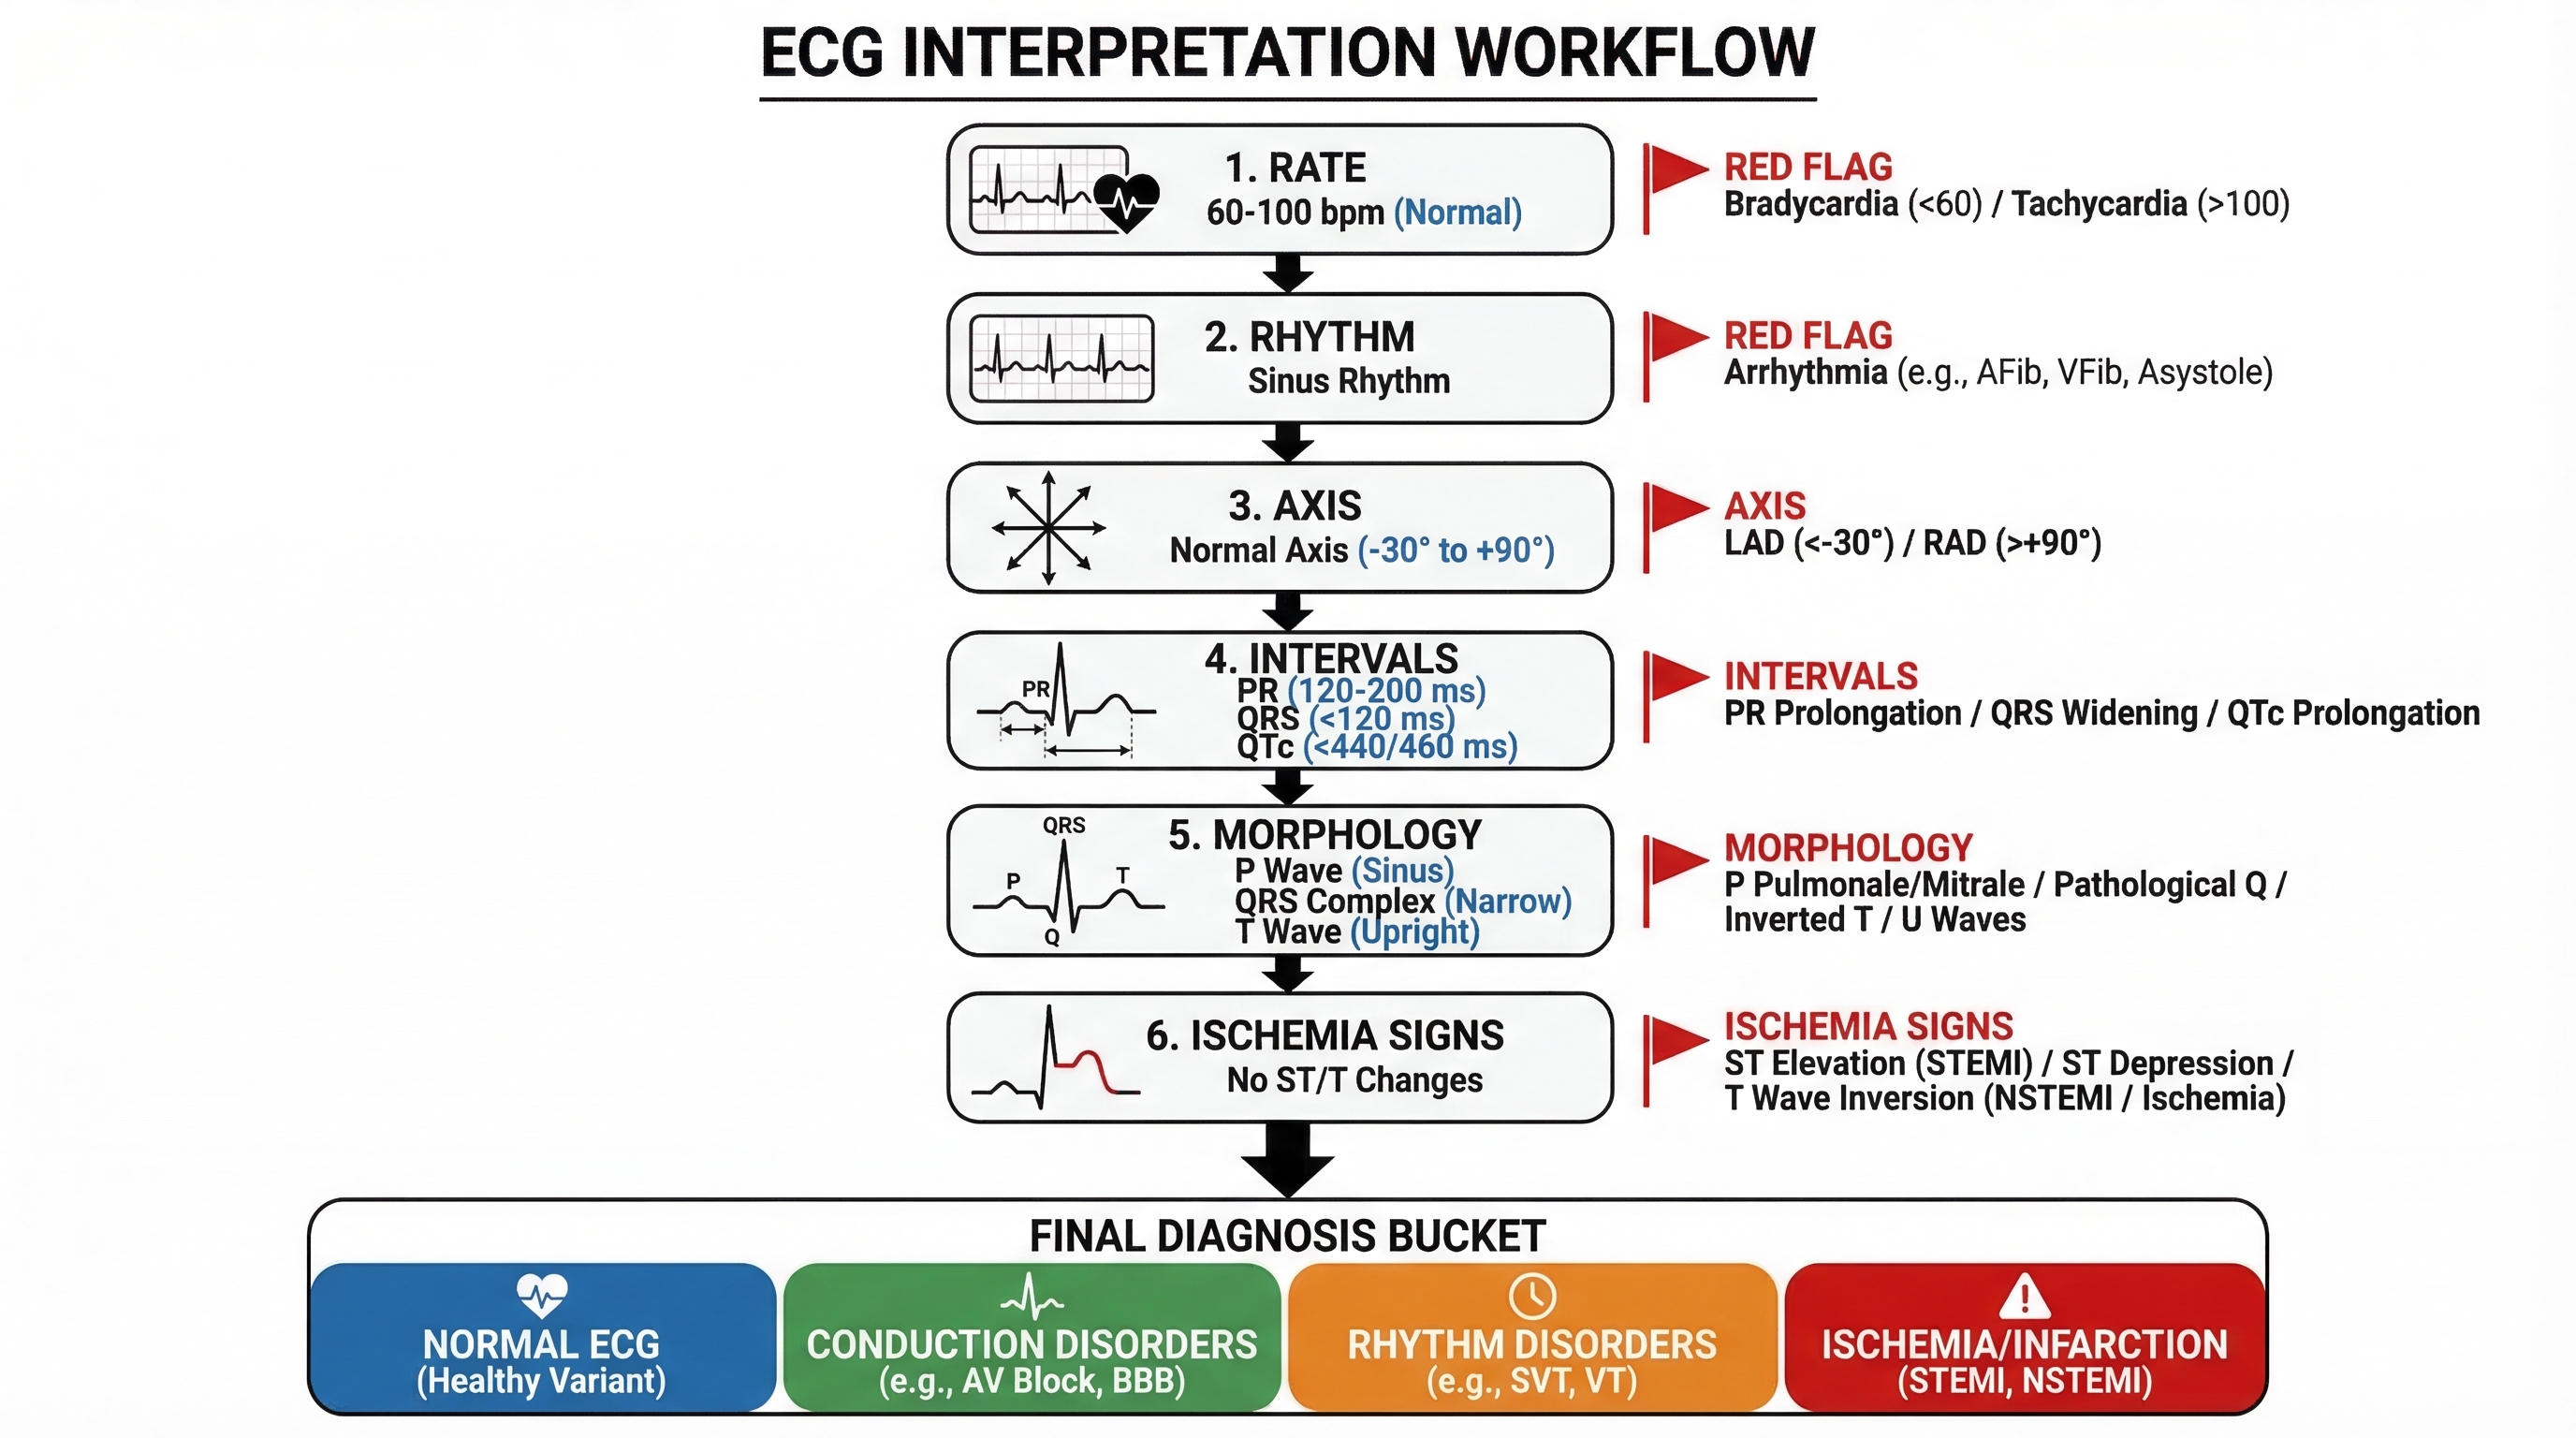
您可以透過僅替換疾病狀況和波形規則來調整每個模板。
匯出前的品質檢查清單
- 波形在臨床上是否合理?
- 導程名稱和標籤在投影片比例下是否清晰可讀?
- 比較版面是否清楚地回答了一個教學問題?
- 間期數值和診斷線索是否已明確標註?
- 配色方案是否足夠簡潔,適合投影和列印?
最後的建議
如果您的輸出結果看起來「漂亮但模糊」,請加入更嚴格的波形約束和明確的標籤要求。在 ECG 視覺效果中,精確度勝過裝飾。
準備好生成您自己的 ECG 教學圖表了嗎?


")
")