A logic model is the one page in an evaluation thesis or grant proposal where a program cannot hide. Prose can describe a project generously; five columns cannot. A reviewer reads them left to right and learns, in about fifteen seconds, whether you know the difference between what you delivered and what changed.
That is why logic models are required so often — by education programs, public health departments, and nearly every foundation funding nonprofit work. Their value is not that they look organized: laying resources, actions and expected change side by side makes any gap between them visible.
This guide covers what belongs in each column, where assumptions and external factors go, the single error that gets the most drafts sent back, and how to get a first draft out of a paragraph of text.
What you'll learn:
- What each of the five columns is actually for
- Where assumptions and external factors belong
- The outputs-versus-outcomes mistake, and how to test for it
- How a logic model differs from a theory of change
- A worked example and a formula for measurable outcomes
The five columns
The standard logic model runs left to right in five columns joined by arrows. The W.K. Kellogg Foundation's Logic Model Development Guide and the CDC's program evaluation framework both use this structure, and most funder templates are variations on it.
| Column | Question it answers | What goes in it |
|---|---|---|
| Inputs | What are we putting in? | Staff, funding, space, curriculum, partners |
| Activities | What do we do with those resources? | Training, sessions, outreach, services |
| Outputs | How much did we deliver? | Countable units: sessions, participants, materials |
| Short-term outcomes | What changed for participants? | Knowledge, skills, attitudes, intentions |
| Long-term outcomes | What changed for the population or system? | Behavior, conditions, institutional practice |
The structural rule underneath the table: the first three columns describe what your program does; the last two describe what happens to other people. That line is the spine of the figure. Get it wrong and every column to the right of it is wrong too.
Many programs add an intermediate outcomes column — usually behavior change — between short and long term. Column counts are not sacred; label them clearly and no reviewer will mind that you did not reach five.
Where assumptions and external factors go
These two get left out or, worse, jammed into the main columns.
Assumptions are the beliefs that make your arrows work — the reasons you expect A to produce B. "Students attend consistently." "Administrators will fund release time for teachers." They are internal to your program logic, just not drawn as boxes.
External factors are conditions you do not control but that will shape the results: family mobility, the local labor market, policy shifts, transportation and insurance access.
Draw them as a separate horizontal band beneath the five columns, assumptions on the left, external factors on the right, parallel to the main flow but outside the arrows. Do not list "parent support" as an input or draw "policy change" as an activity box. Once those slip into the main row, the reviewer concludes you cannot tell the inside of your program from the outside.
The most common error: outputs written as outcomes
If you take one sentence from this guide, take this: outputs count what you delivered; outcomes describe a change in people or systems.
Rejected drafts almost always look the same:
- ❌ Short-term outcome: 16 health education sessions delivered
- ❌ Short-term outcome: 40 teachers trained
- ❌ Long-term outcome: 600 brochures distributed
All three are outputs. Running 16 sessions does not mean anyone's behavior changed, and training 40 teachers only establishes that 40 teachers were in the room. As outcomes, they become:
- ✅ Participants can name at least three diabetes risk factors
- ✅ Teachers report greater confidence in inquiry methods, and more student-led investigation is observed in their classrooms
- ✅ Fewer diarrheal disease visits among children under five in the project communities
The test is fast: change the subject of the sentence to a participant. If the only possible subject is "we" — we ran, we distributed, we trained — it is an output. If the subject can be a student, a patient, a resident, or an agency, it is an outcome.
The mirror-image error shows up too: "students improve in math" in the Outputs column. Outputs should read like something you count off an attendance sheet — 120 students served, 90 sessions per semester.
Logic model vs. theory of change
The two get used interchangeably, but they do different jobs.
A logic model is the summary layout — five columns, arrows, one page. It answers what you have, what you do, and what comes out, in a form a reviewer can scan.
A theory of change explains why the arrows hold. Why should three 45-minute small-group sessions a week produce greater math confidence? Which theory says so, what prior evidence supports it, what preconditions have to be in place first? That is usually several pages of argument.
Proposals often contain both: the theory of change carries the reasoning in the narrative, and the logic model sits in an appendix so reviewers can orient themselves quickly.
One limit worth knowing. A logic model is linear by design. If your program runs on feedback — community participation improves service quality, which raises participation further — a left-to-right chain cannot show it. Draw a separate causal loop diagram for the feedback dynamics instead of bending arrows backwards in the logic model.
Worked example: an after-school math tutoring program
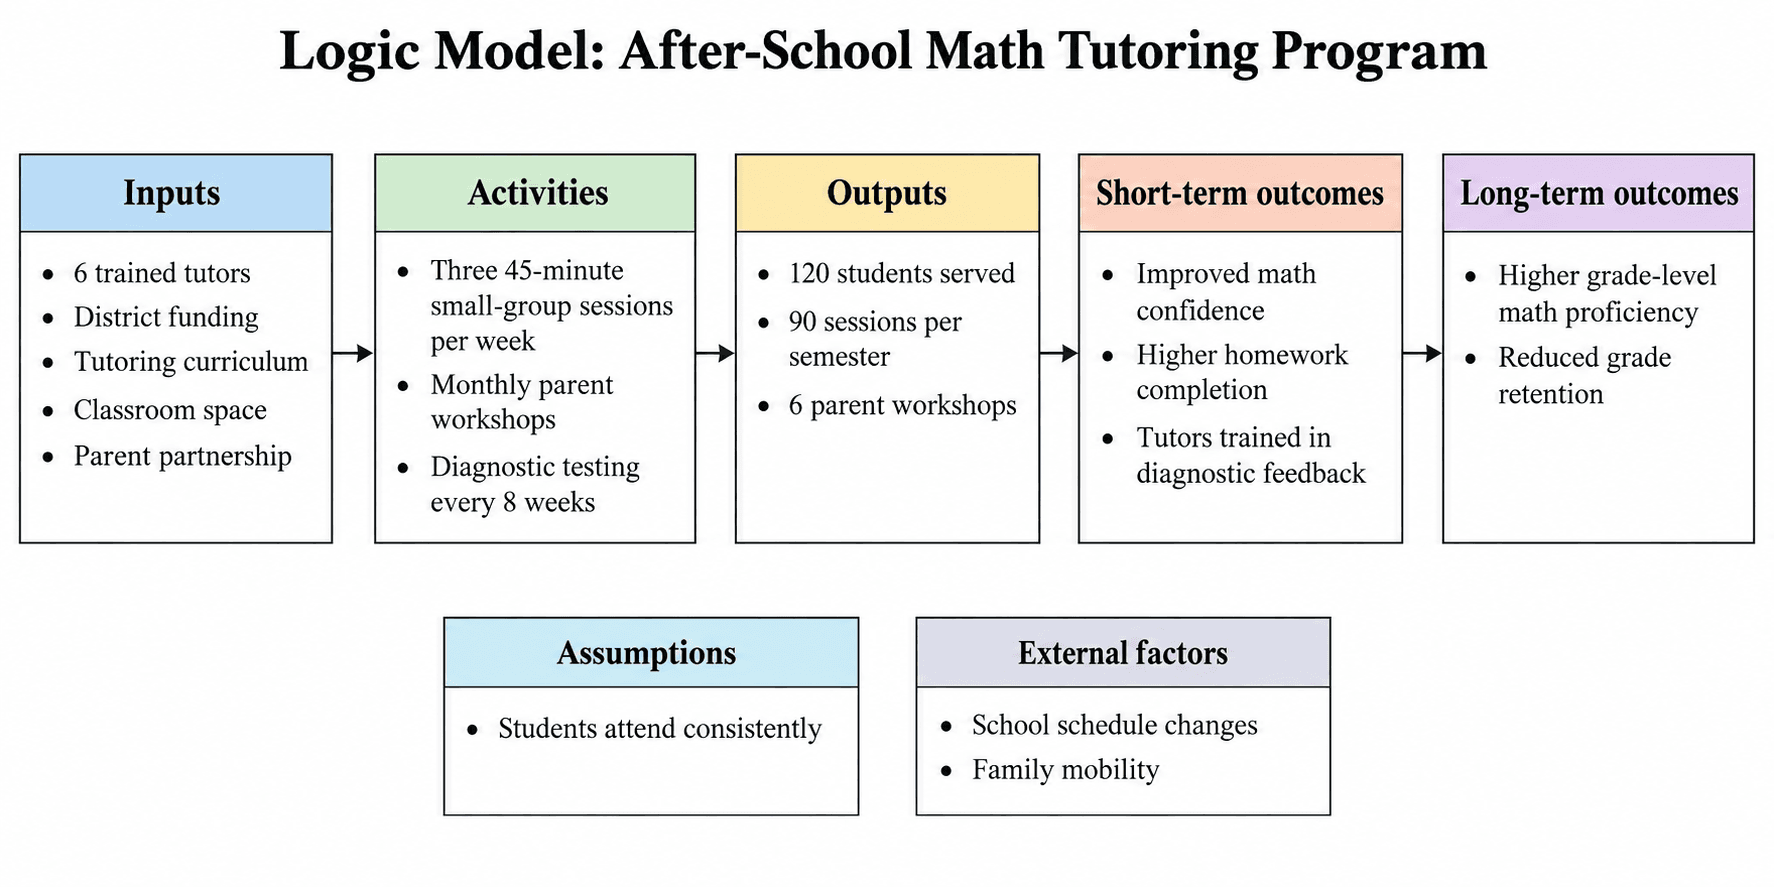
Two middle schools, one tutoring program, five columns:
Inputs
- 6 trained tutors
- District program funding
- Tutoring curriculum and diagnostic assessments
- Classroom space and evening time slots
- Parent partnership agreement
Activities
- Three 45-minute small-group sessions per week
- Monthly parent workshops
- Diagnostic testing every 8 weeks
Outputs
- 120 students served
- 90 sessions per semester
- 6 parent workshops held
Short-term outcomes
- Improved student confidence in math
- Higher homework completion
- Tutors skilled in diagnostic feedback
Long-term outcomes
- Higher share of students at grade-level math proficiency
- Reduced grade retention
Assumptions: students attend consistently. External factors: school schedule changes, family mobility.
Every item under Outputs is countable; every item under outcomes is a change in a student or a tutor. That contrast is the whole discipline.
Writing measurable outcome statements
Reviewers judge whether an outcome can be assessed by looking for four parts: who + what changes + by how much + measured when.
- Too vague: students improve in math
- Measurable: by the end of the program, the share of students tutored for a full semester who reach grade-level proficiency increases from baseline
Two templates worth reusing:
- Short-term: [what share of participants] will [demonstrate a specific observable behavior or knowledge] by [time point]
- Long-term: [target population] shows [a directional change] in [indicator] over [period], measured by [data source]
Two habits keep outcomes honest. Every outcome should point to a real data source — a pre/post test, an attendance record, clinic records; if you cannot name one, you have not decided how to evaluate it. And name the direction of change: "attention to nutrition" is not an outcome, "increased daily vegetable servings" is. A method name — "administer a survey" — is an activity.
How reviewers read a logic model in a grant proposal
Knowing the reading order tells you where to spend your effort:
- The rightmost column first. Do your long-term outcomes match what this funder exists to do? If not, little else matters.
- Backwards from there. Can the short-term outcomes you listed plausibly produce those long-term ones? Can these activities produce those short-term outcomes?
- A check for column confusion. Outputs sitting in an outcomes column is the fastest signal there is of an applicant's evaluation literacy.
- Cross-reference against the budget. If Inputs lists three full-time coaches and the budget funds one, the discrepancy surfaces immediately.
- Honesty in the assumptions band. A proposal that names external risks and says how it will respond reads as more credible than one where nothing can go wrong.
Layout habits that help: one page; arrows in one direction only; three to six items per column, merged beyond that; two or three colors to distinguish columns, not to decorate.
Drafting one with SciDraw AI
Dragging five columns of boxes around in PowerPoint and realigning arrows after every round of comments is the slow path. Write the program as a paragraph instead, generate a draft, then edit the wording.
The program logic model generator separates the common settings into modes, switchable above the input box:
- Education interventions — short-term outcomes framed as knowledge, skills and attitudes; long-term as achievement and behavior. Suits curriculum reform, teacher professional development, after-school programs.
- Public health programs — long-term outcomes layered into health behaviors, clinical indicators, and population impact. Suits community health, screening, health education.
- Nonprofit programs and grant proposals — resources, activities, outputs and impact arranged in the format funders expect in an appendix.
Write your input in labeled segments — "Inputs: … Activities: … Outputs: … Short-term outcomes: … Long-term outcomes: … Assumptions: … External factors: …" — and the columns come out cleanly separated.
Two things the tool deliberately does not do: it does not evaluate your program or calculate indicators, and it will not invent content for a column you left blank. An empty column stays empty. In an evaluation figure, that restraint is exactly what you want. It is free to try, so it costs nothing to generate one and see whether the structure holds.
For the other figures a thesis needs, browse thesis figures by discipline and start from the matching preset so your logic model and framework diagrams share one visual style.
Frequently asked questions
Does a logic model have to have five columns? No. Five is the most common form, but a short program is entirely defensible with four — inputs, activities, outputs, outcomes — and a complex one may split outcomes into short, intermediate and long term. What matters is that the column headings are explicit and nothing crosses between them. If your funder supplies a template, use their columns.
I still can't tell outputs from outcomes. What's the quickest check? Apply the subject test: if the sentence can only start with "we," it is an output. If it can start with a student, patient, resident or organization, it is an outcome. A second check: outputs can be counted straight off an attendance sheet or activity log, while outcomes require a test, an observation, or a records comparison to know.
Can a logic model include feedback arrows? Not in the main flow. Its readability comes entirely from a single left-to-right direction, and one loop forces the reader to work out which path is primary. When feedback genuinely drives your program, draw a separate causal loop diagram for the dynamics and let each figure do one job.
Where does the logic model go in a proposal or thesis? In a grant proposal it usually sits in the program design or evaluation plan section as a one-page figure. In an evaluation thesis it belongs at the start of the research design chapter, establishing the whole program before you detail indicators and data sources. In both cases, walk through the columns in the text — do not leave the figure to speak for itself.