Free Gene Map Maker
Create a labeled gene map from plain text
Describe a chromosome, the gene loci and markers along it, and whether you want positions in centimorgans or megabases, and AI draws a clean, professional gene map — ready for genetics homework, lab reports, and research papers.
Gene map examples
Click any example to load its prompt, or use it as a starting point for your own gene map.
What is a gene map?
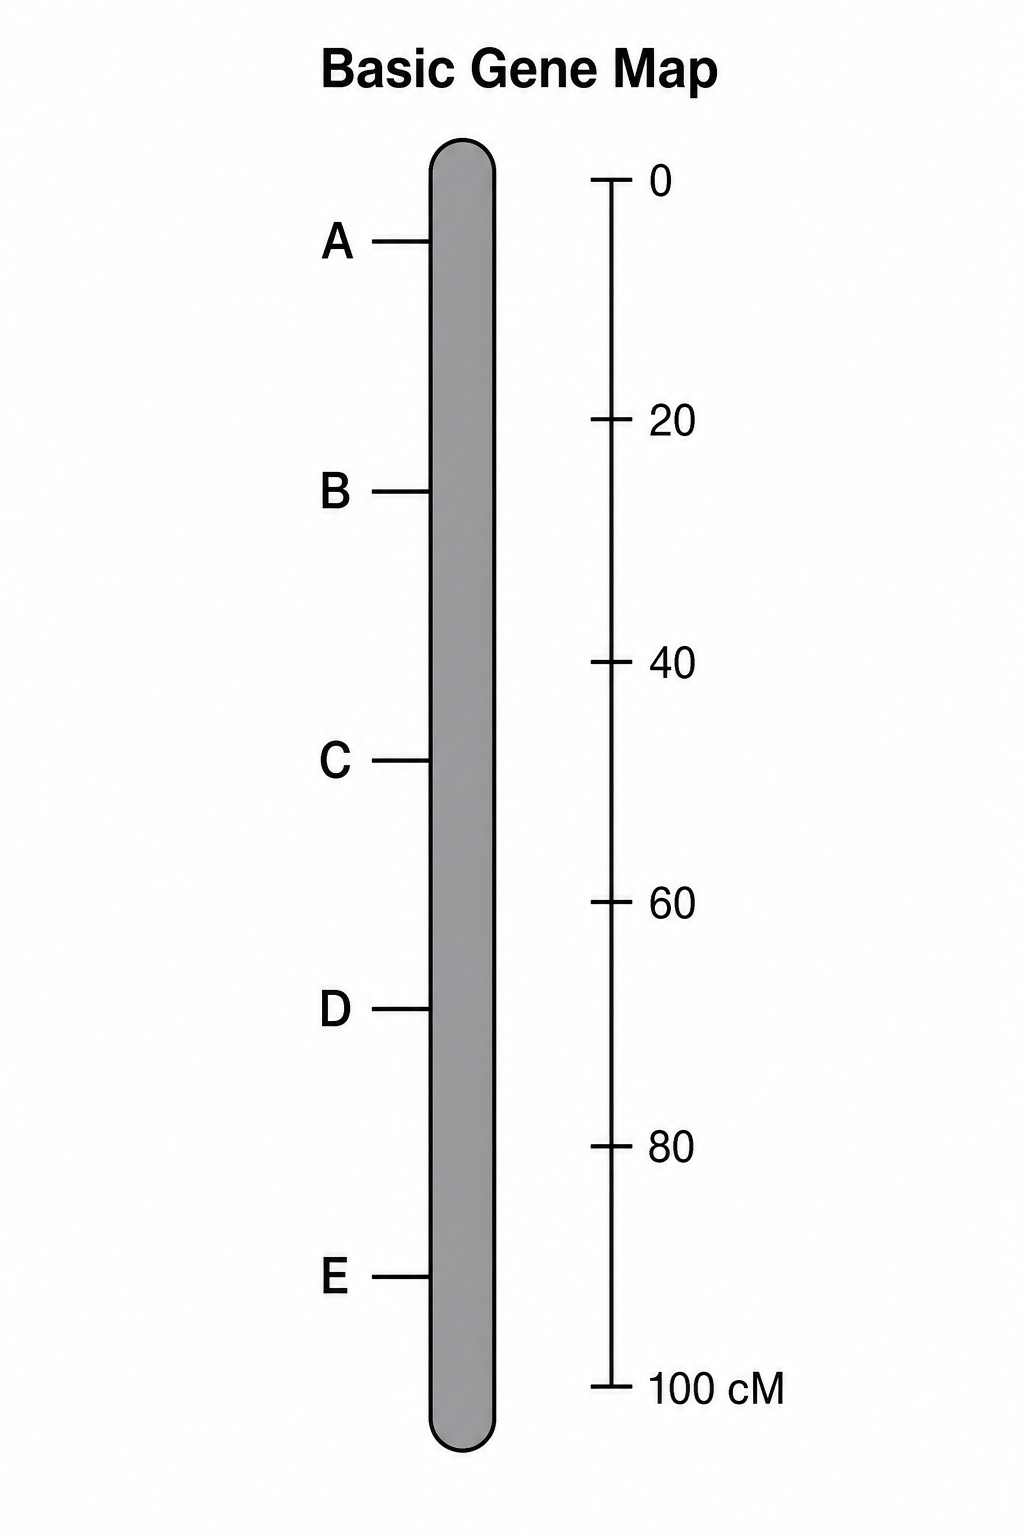
A gene map is a diagram showing the relative positions of genes and genetic markers along a chromosome. A genetic (linkage) map measures distances in centimorgans (cM) derived from recombination frequency, while a physical map measures distances in base pairs or megabases (Mb). The chromosome is usually drawn as a bar or ideogram with labeled loci, tick marks, and a position scale. SciDraw AI turns your text description into a clean, labeled gene map so you do not have to align loci and draw chromosomes by hand.
Why use a gene map generator?
- Get a labeled gene map in seconds instead of drafting chromosome bars and loci by hand.
- Choose a genetic linkage map in centimorgans or a physical map in megabases.
- Place loci and markers in the right order with clean tick marks and a position scale.
- Create custom maps for genetics lectures, problem sets, lab reports, and study guides.
- Save time for coursework and research where accurate locus positions and labels matter.
How to make a gene map
Describe the chromosome and list the gene loci and markers you want shown, in order, along with the distances between them in centimorgans or megabases. Say whether you want a plain chromosome bar or a banded ideogram with a centromere, then generate. SciDraw AI draws a clean gene map with labeled loci, tick marks, and a position scale, and you can refine the prompt and regenerate until the map looks exactly right.
What you can draw
- A chromosome drawn as a bar or banded ideogram, with or without a centromere
- Labeled gene loci and molecular markers at their positions
- A position scale in centimorgans (cM) for linkage or megabases (Mb) for physical maps
- Tick marks and distance labels between adjacent markers
- A centromere and chromosome banding pattern on the ideogram
- Comparative maps aligning shared loci across two chromosomes or species
Gene map FAQ
What is a gene map?
A gene map is a diagram showing the relative positions of genes and genetic markers along a chromosome. The chromosome is drawn as a bar or ideogram, and each locus is marked and labeled at its position. A genetic (linkage) map gives distances in centimorgans, while a physical map gives them in base pairs or megabases, and both are used to study how genes are arranged and inherited.
What is the difference between a genetic (linkage) map and a physical map?
A genetic, or linkage, map measures the distance between loci in centimorgans (cM), which come from how often recombination separates them during meiosis. A physical map measures the actual distance in base pairs or megabases (Mb) along the DNA. Genetic distances reflect recombination frequency and can differ from physical distances, since recombination is not evenly spread across a chromosome.
What is a centimorgan (cM)?
A centimorgan is the unit of distance on a genetic linkage map. One centimorgan corresponds to a 1% chance that two loci are separated by recombination in a single generation. Loci that are close together rarely recombine and sit a small number of centimorgans apart, while loci far apart on the chromosome recombine more often and are many centimorgans apart.
How do I make a gene map online?
Type a short description of the chromosome, list the gene loci and markers in order, and give the distances between them in centimorgans or megabases. SciDraw AI then draws a clean gene map with the chromosome bar or ideogram, labeled loci, tick marks, and a position scale. You can adjust the wording and regenerate until the gene map matches what you need.
Is the gene map maker free?
Yes, you can start for free. Create an account and you receive free credits to generate gene maps right away, with paid plans available if you need to make many genetic, linkage, and physical maps on a regular basis.
Can I use it for class or research?
Absolutely. The maps are well suited to genetics classes, problem sets, and lab reports, as well as figures for posters, theses, and research papers. Generate a labeled linkage or physical map for the exact chromosome and loci your lesson or study covers.
Explore More Tools

Mitosis Diagram Generator
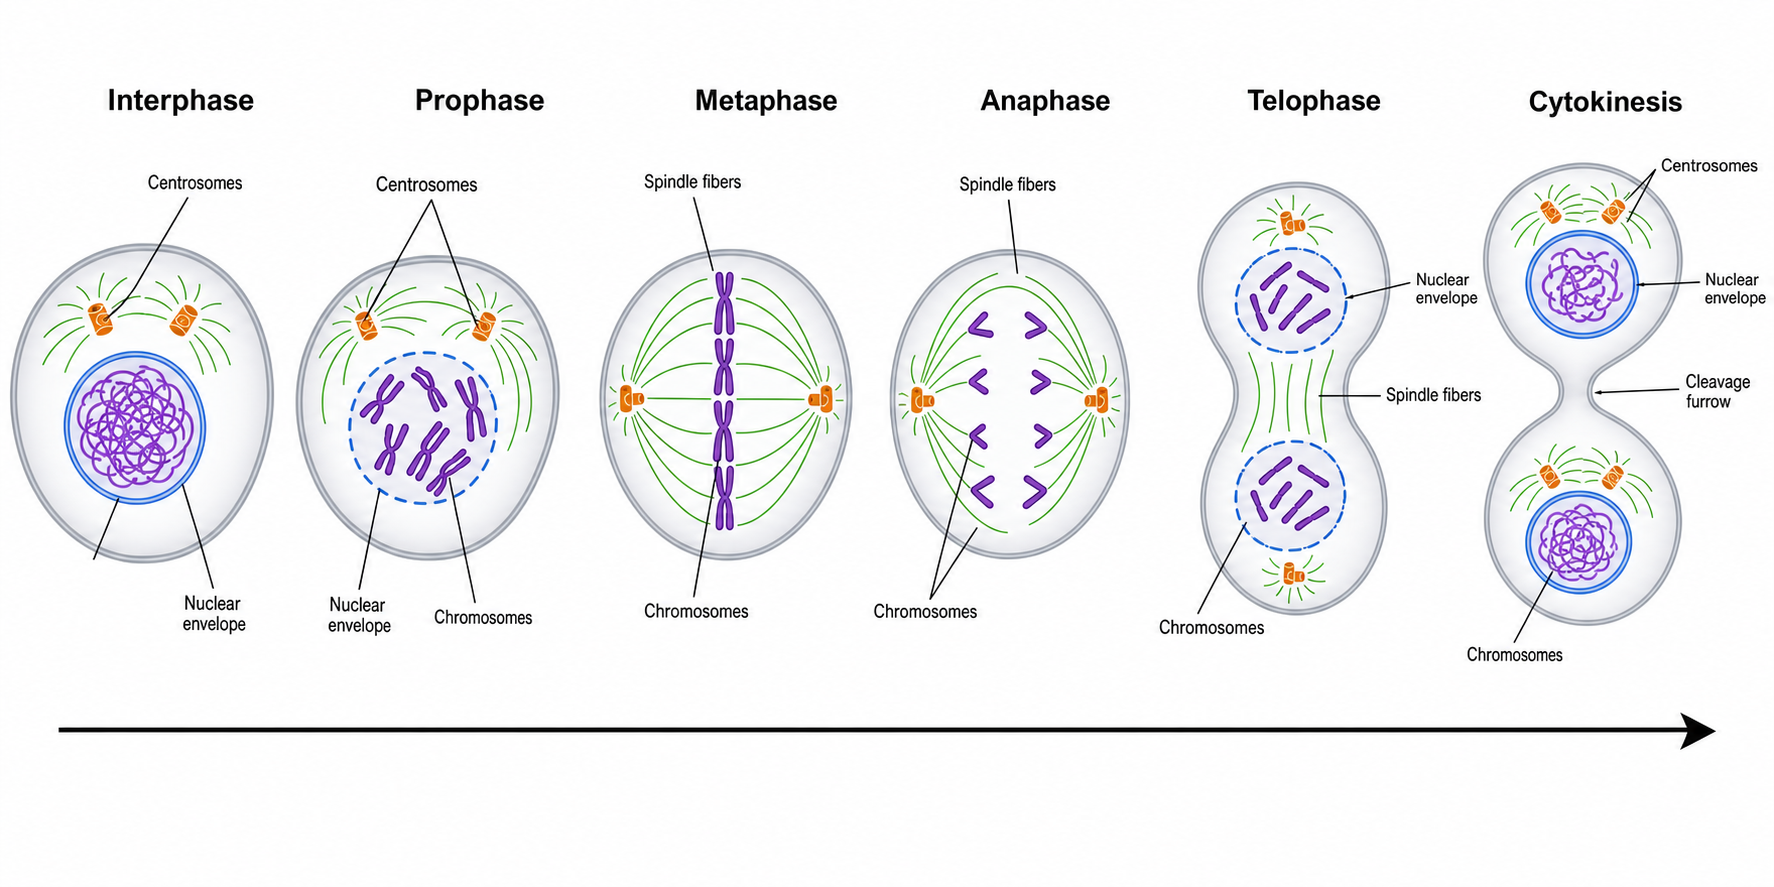
Draw labeled phases of mitosis — prophase, metaphase, anaphase, telophase — in order.
Try it free
Meiosis Diagram Generator
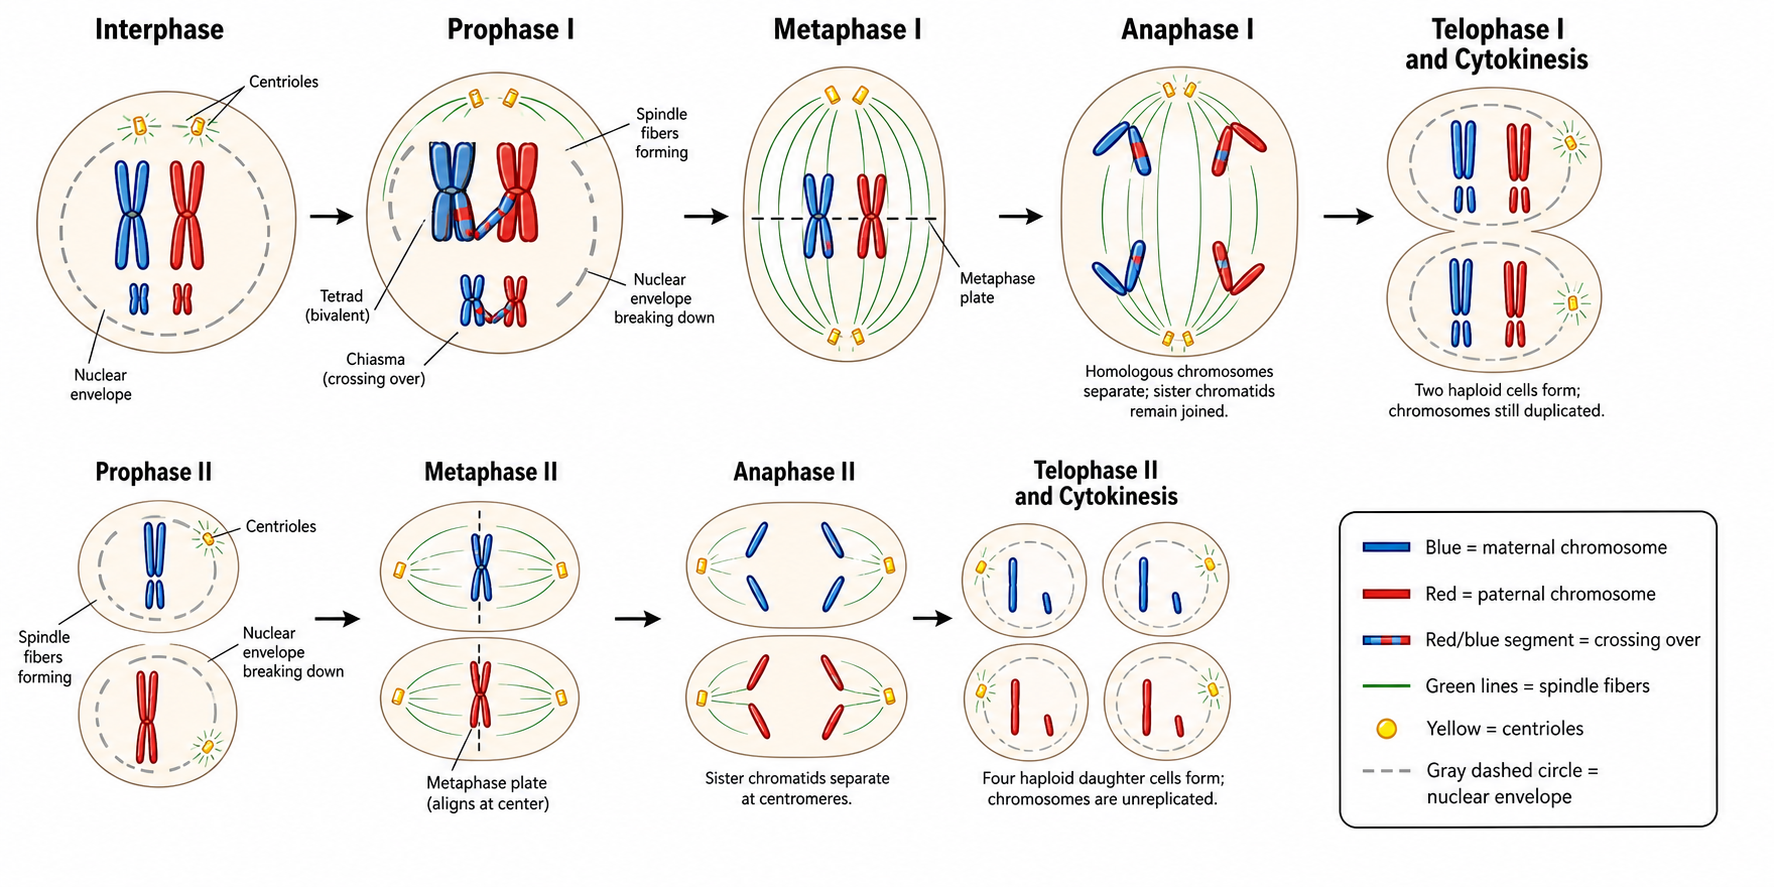
Create labeled meiosis diagrams, the phases of meiosis I and II, and crossing over.
Try it free
Cell Cycle Diagram Generator
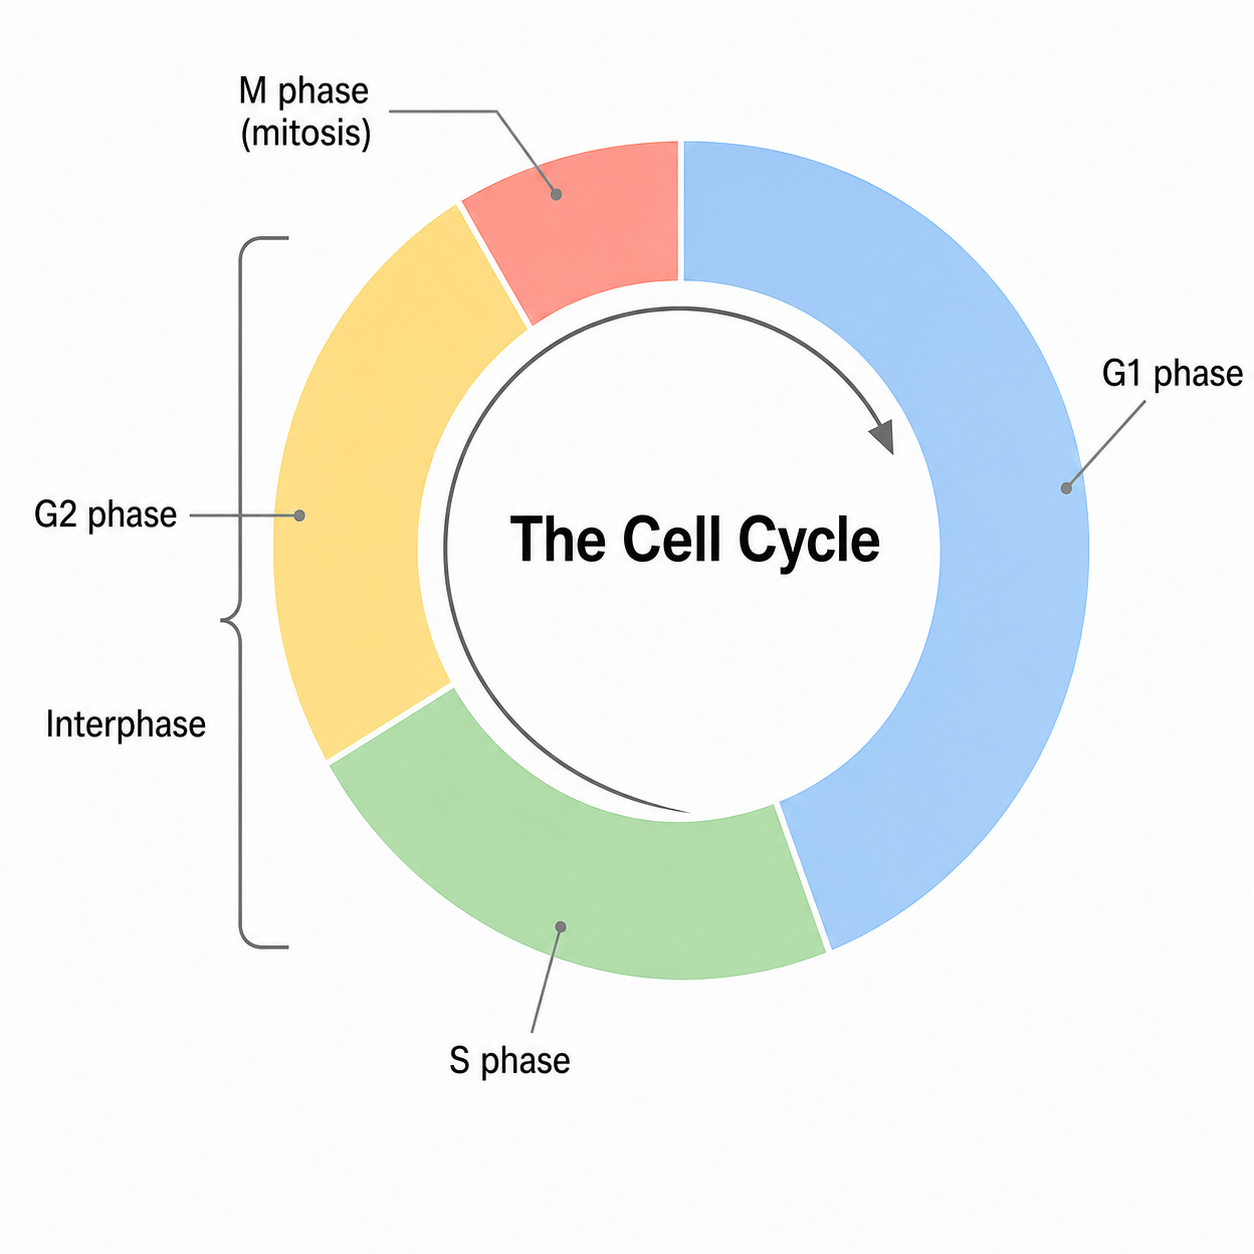
Make labeled cell cycle diagrams with interphase, G1, S, G2, the M phase and checkpoints.
Try it freeDraw your gene map now
Describe the chromosome and its loci and get a clean, labeled gene map in seconds. Start free with SciDraw AI.