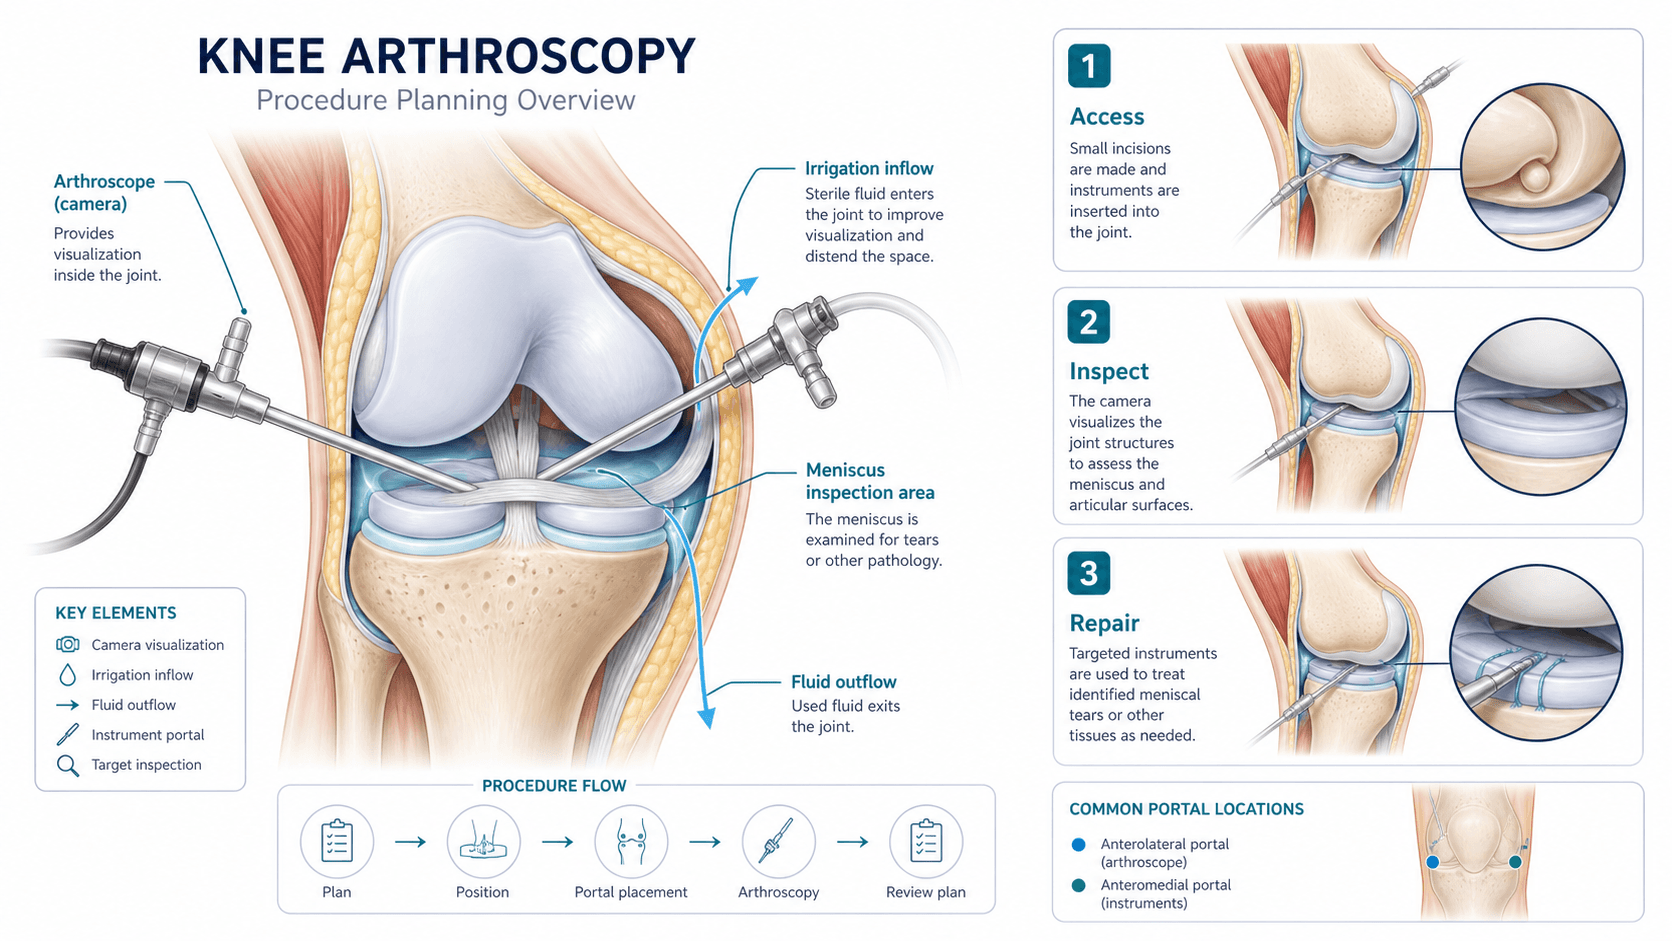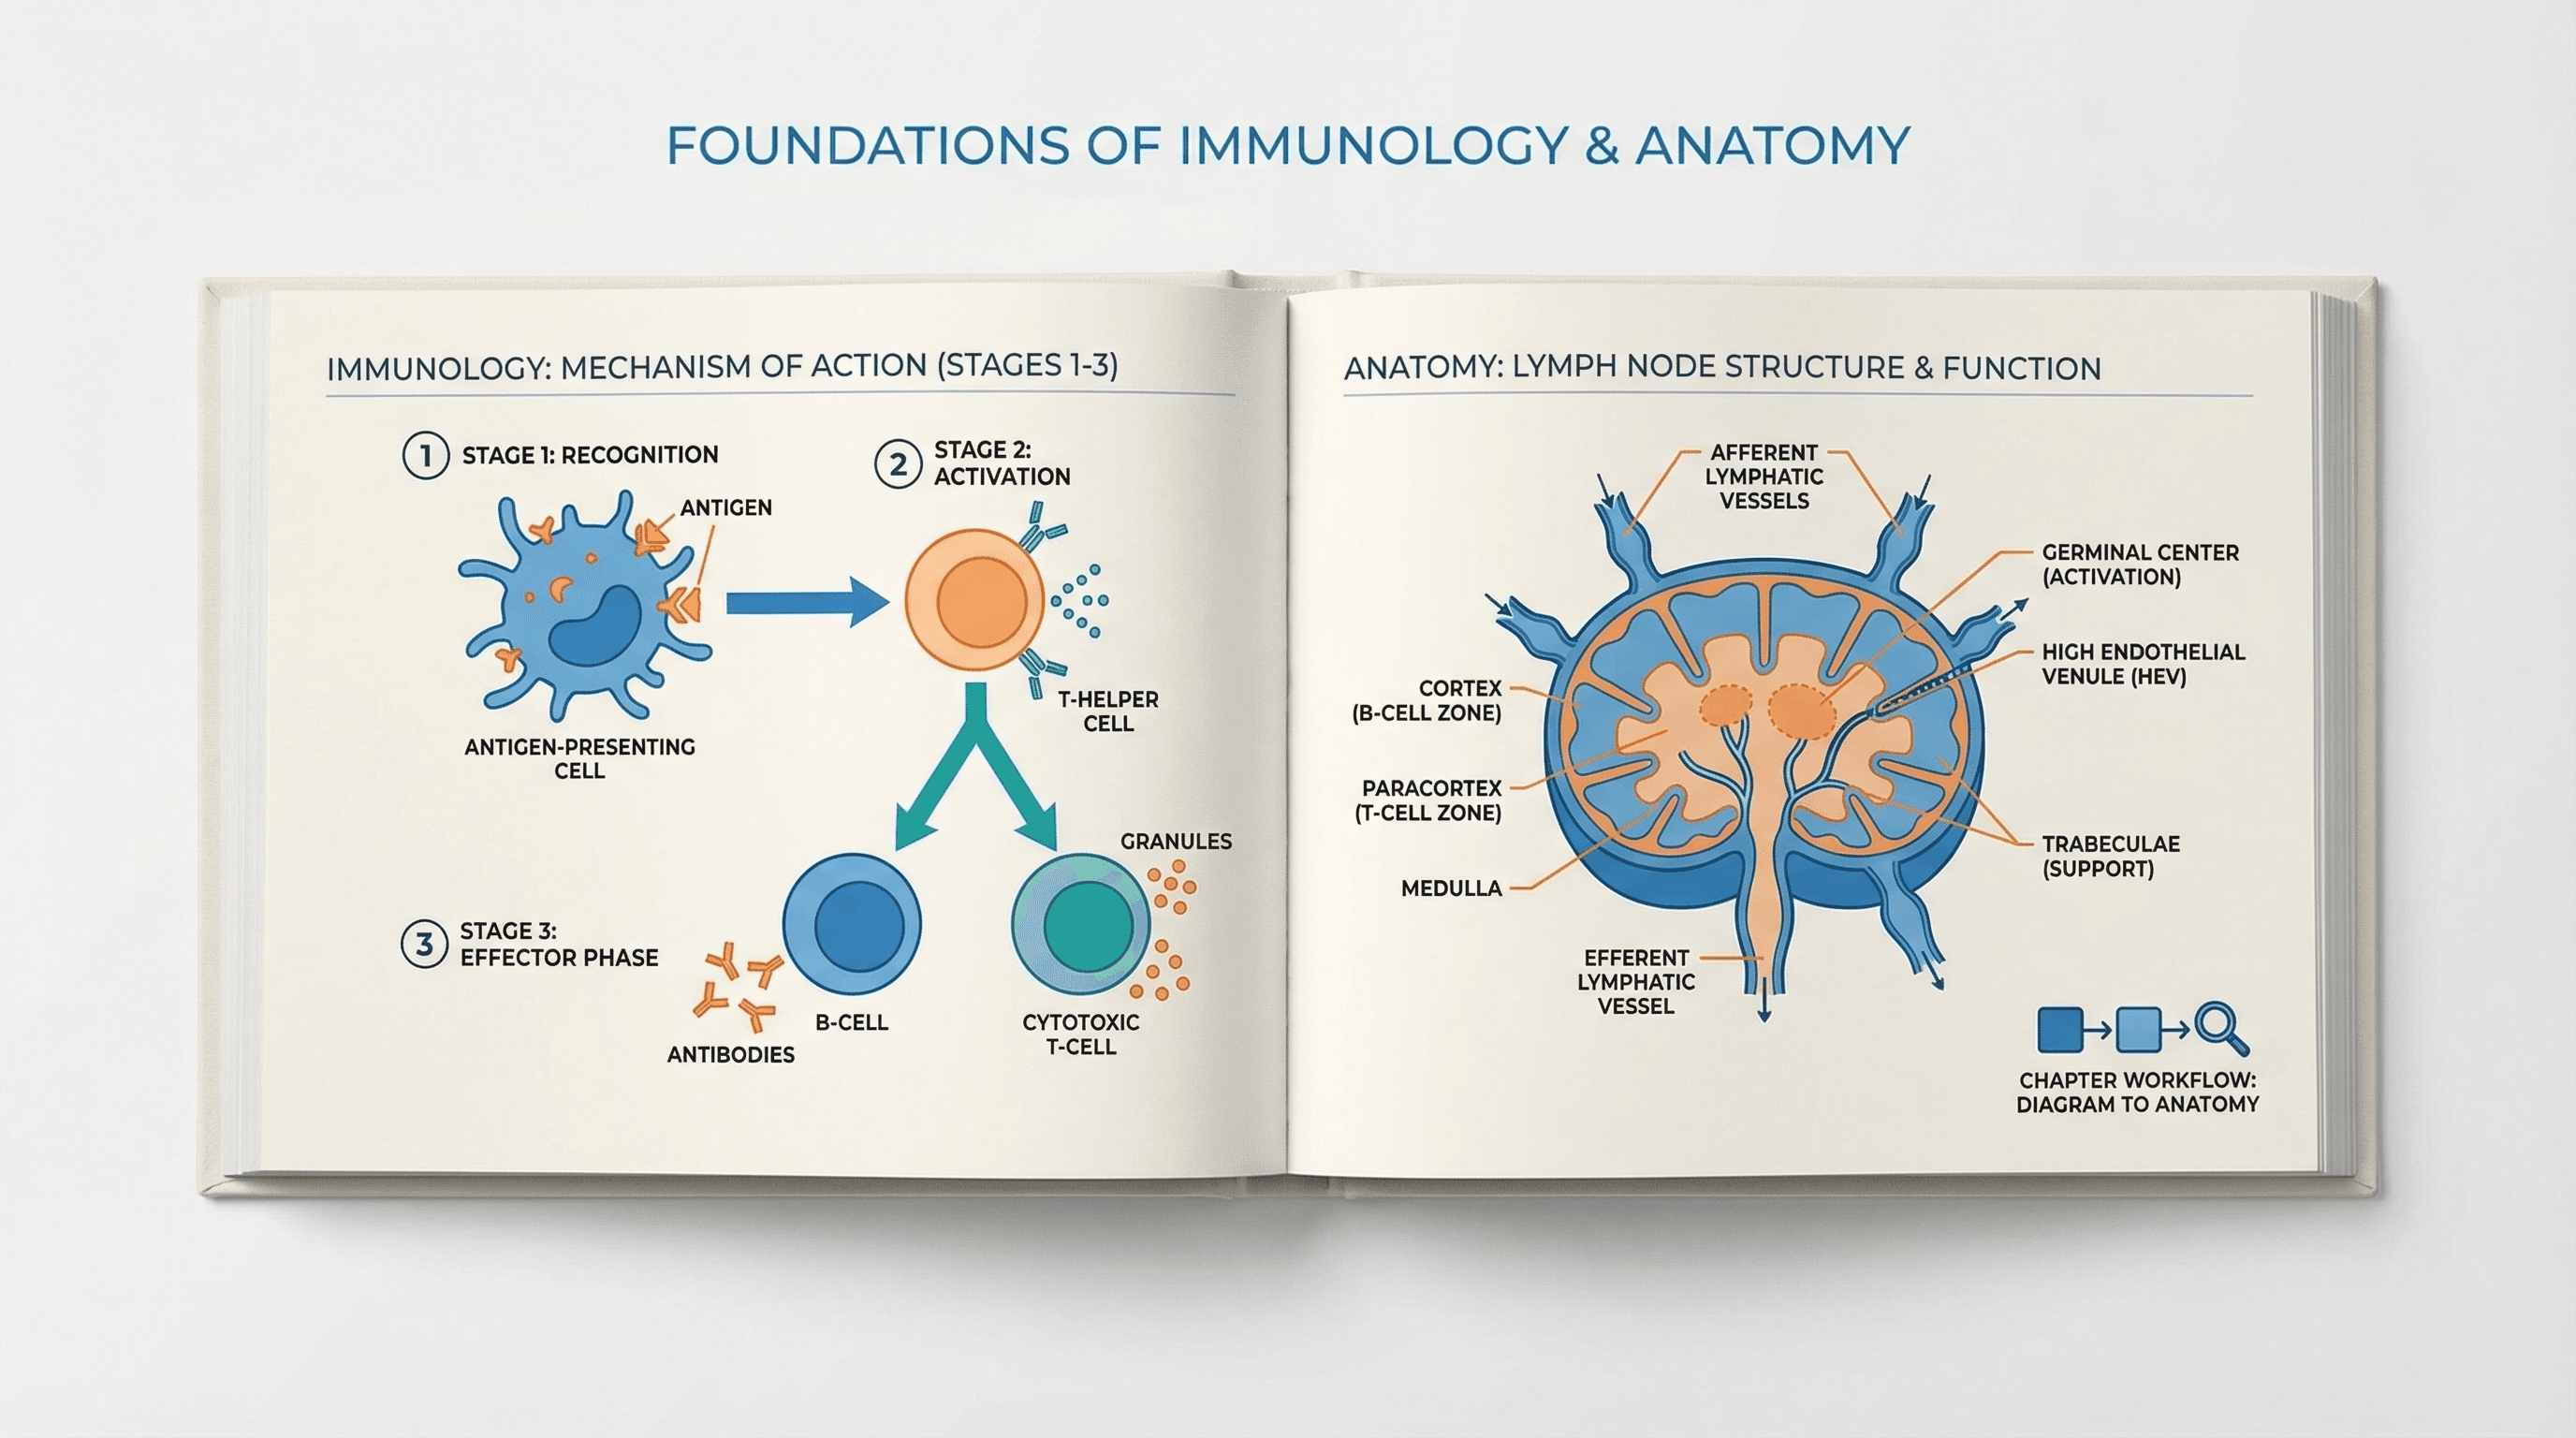
💡 SciDraw AI의 강점: 과학용으로 튜닝된 모델, 레이블이 달린 출력, SVG 벡터 내보내기 — 실제로 논문에 ship할 수 있는 모델용. 무료 체험 →
범용 이미지 AI에 "make a scientific model of a mitochondrion"이라고 입력하면, 반짝이가 뿌려진 젤리빈처럼 생긴 무언가가 돌아옵니다. 그건 science model이 아닙니다. 그건 장식입니다. 답답한 점은 AI가 정말로 논문 게재 수준의 scientific model을 생성할 수 있다는 것입니다 — 다만 이 범주가 실제로 무엇인지, 그리고 어떻게 프롬프트해야 하는지 이해할 때만.
이 가이드는 AI science model generator를 제대로 사용하는 플레이북입니다. Cell biology, protein-ligand binding, 기후 시뮬레이션 개념 피규어, 물리 메커니즘 다이어그램에 걸쳐 200개 이상의 모델에 내부적으로 사용한 경험에 기반합니다. 다음을 다룹니다.
- "Scientific model generation"이 실제로 의미하는 것(대부분의 사람들이 생각하는 것과 다름)
- 나쁜 출력의 70%를 유발하는 세 가지 함정
- 안정적으로 작동하는 6가지 프롬프트 패턴
- AI를 포기하고 전용 시뮬레이션 도구를 써야 할 때
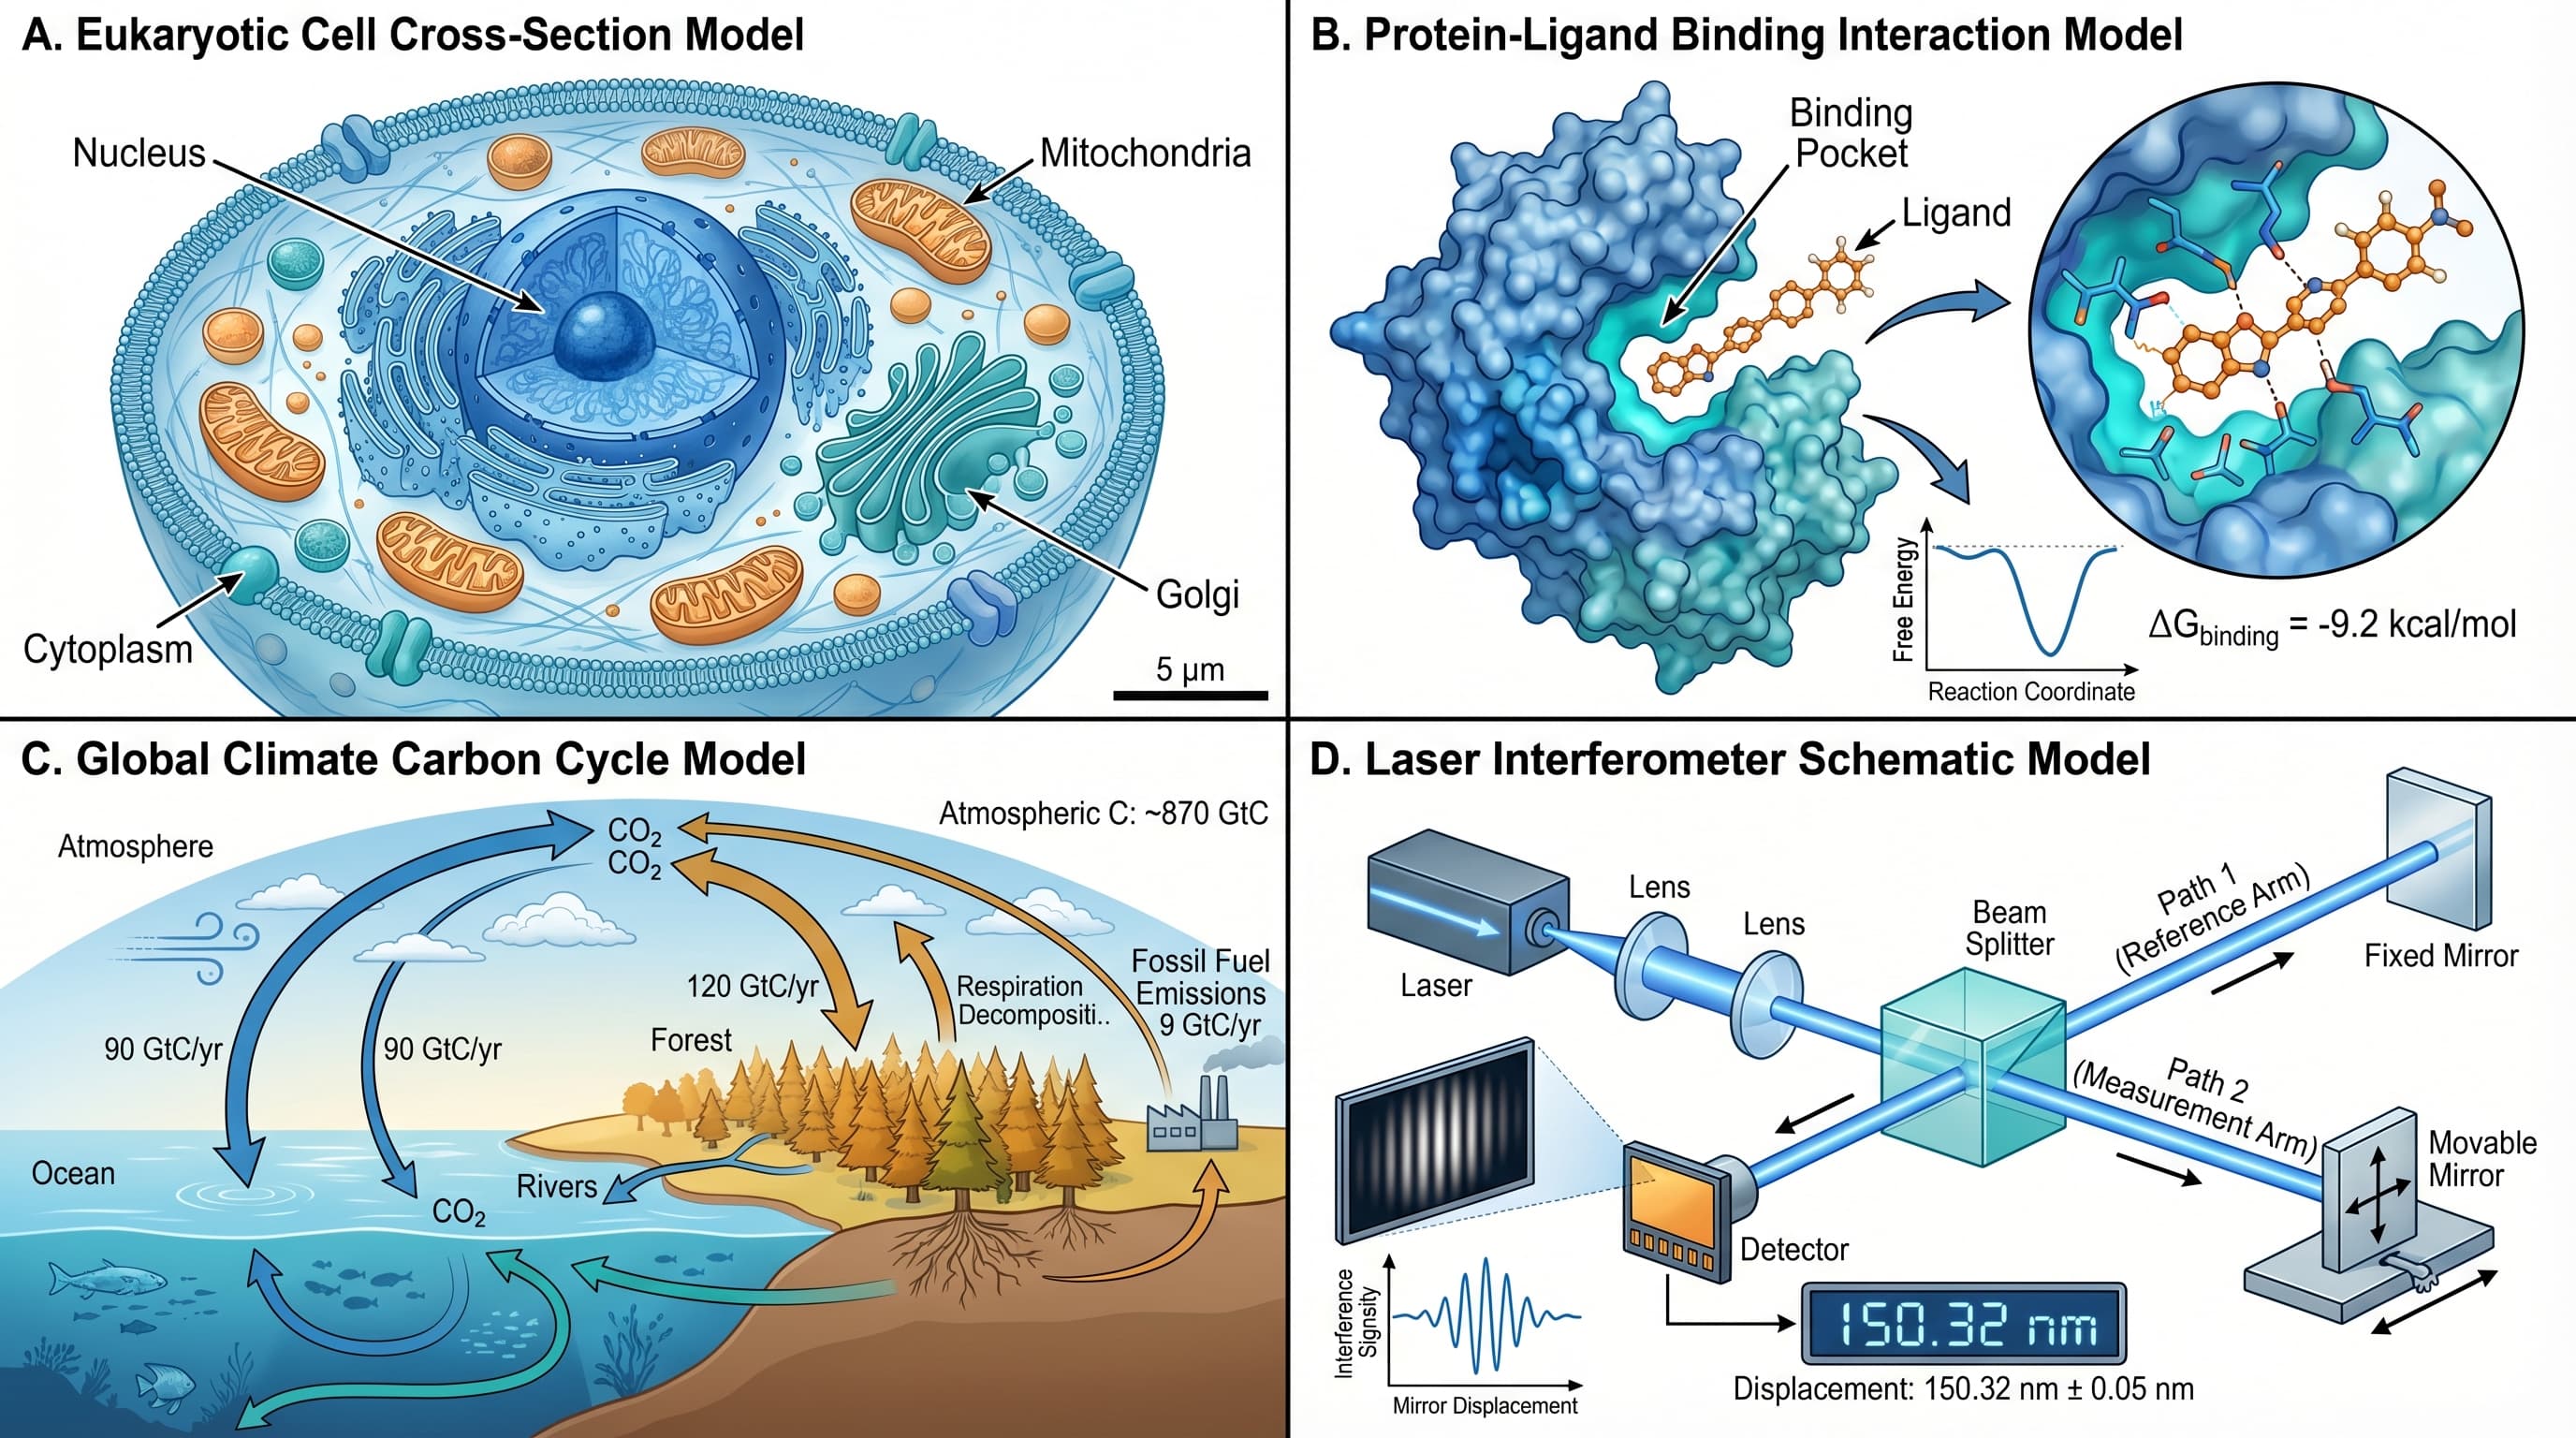
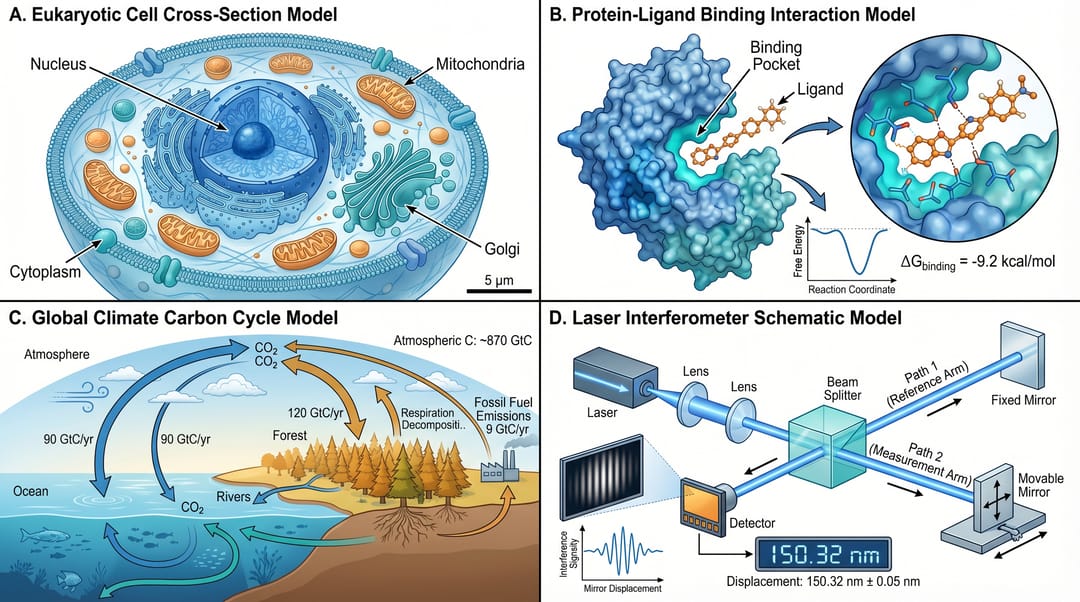 생물학, 화학, 기후, 물리학 분야에 걸친 네 개의 AI 생성 scientific model.
먼저, "AI science model generator"란 무엇인가?
이 용어 아래에는 매우 다른 두 가지가 숨어 있습니다:
의미 1: 3D 물리 모델 생성기 — 단백질 구조, 분자 conformation, 재료 결정 구조 같은 것. 이것이 AlphaFold가 하는 일입니다. 범용 창작 AI가 아니라 실제 3D 좌표를 출력하는 전문 딥러닝 모델입니다. 그 좌표를 이미지로 렌더링하려면 PyMOL이나 ChimeraX를 사용합니다.
의미 2: 2D 개념 scientific model 생성기 — 논문에서 "시스템이 어떻게 작동하는가"를 나타내는 스키매틱 일러스트레이션. SciDraw AI, Figurelabs, BioRender, 그리고 범용 이미지 AI가 시도하는 것입니다. 출력은 이미지이지 구조 데이터가 아닙니다.
이 가이드는 의미 2에 관한 것입니다. 의미 1(AlphaFold, RFDiffusion, ESMFold)이 필요하면 잘못된 글에 왔습니다 — 그것들은 전문 단백질 예측 도구이며 출력은 .pdb 파일이지 이미지가 아닙니다.
대부분의 "AI science model generator" 검색은 사실 의미 2를 찾고 있습니다: 과학 시스템의 레이블이 달린 개념 모델을 빠르게 그리는 도구.
❌ 과학 model 프롬프트의 70%를 망치는 세 가지 함정
1. 모델 유형을 지정하지 않고 "a scientific model of X"를 요청하는 것. "Scientific model"은 모호합니다 — 메커니즘 다이어그램인가? 3D 표현인가? Flowchart인가? Pathway인가? 서로 다른 모델은 서로 다른 시각 관례를 사용합니다. 지정하지 않으면 AI가 짐작하고, 대부분 틀립니다.
✅ 해결: 항상 모델 유형을 포함하세요: "Mechanism diagram of X", "3D conceptual model of X", "Signaling pathway of X", "Flowchart model of X".
2. 추상화 수준을 지정하지 않는 것. "세포의 model"은 다음 중 무엇이든 될 수 있습니다:
- 전자 현미경 스타일 photorealistic 이미지
- 레이블이 달린 오가넬의 교과서 카툰
- 세 개의 원으로 된 미니멀한 아이콘
- 40개 단백질이 있는 상세한 pathway
AI는 어느 것을 원하는지 모르므로 평균을 냅니다. 평균은 일반적인 쓰레기를 만듭니다.
✅ 해결: 하나의 추상화 수준을 고르고 명시적으로 말하세요 — "textbook cartoon style, ~10 labeled organelles, sans-serif labels in quotes" 또는 "minimalist icon style, 3 visual elements, no text".
3. 레이블 내용을 인용부호로 묶지 않는 것. 긴 기술 용어(Mitochondria, Endoplasmic Reticulum, Phosphofructokinase)는 자연어로 언급하기만 하면 AI 텍스트 렌더러에서 약 30~50% 확률로 뭉개집니다. 인용부호로 묶고 정확히 나타나야 한다고 모델에 말하세요.
✅ 해결: Labels: "Mitochondria", "Golgi Apparatus", "Nucleus". 인용부호 안의 각 레이블은 작성한 대로 정확히 나타나야 함.
레이블 정확도에 대해서는 과학 피규어용 Gemini Nano Banana 프롬프트 가이드를 참고하세요.
Scientific model에 실제로 작동하는 6가지 프롬프트 패턴
각 패턴은 언제 사용하는가, 템플릿, 예시, 흔한 실수 구조입니다.
패턴 1: 메커니즘 모델
언제 사용하나: 프로세스의 작동 원리를 보여주고 싶을 때 — signaling cascade, metabolic pathway, enzyme catalysis cycle.
템플릿:
{aspect ratio} {style} mechanism model of {process name}.
Show sequential steps: {step 1} → {step 2} → {step 3} → {step 4}.
Label each step with quoted names: "{label 1}", "{label 2}", "{label 3}".
{visual constraints: color palette, background, no watermark}
예시:
16:9 clean scientific mechanism model of insulin receptor signaling.
Show sequential steps: insulin binding → IRS1 phosphorylation → PI3K activation → AKT activation → GLUT4 translocation → glucose uptake.
Label each step with quoted names: "Insulin", "IRS1", "PI3K", "AKT", "GLUT4", "Glucose".
Palette: blue + amber, white background, no watermark, sans-serif labels.
흔한 실수: 너무 많은 단계(8개 이하 유지), 화살표 방향 누락, 인용부호 없는 레이블.
패턴 2: 구조 모델
언제 사용하나: 생물학적·화학적 구조의 부분을 보여주고 싶을 때 — cell organelle, 단백질 domain, drug-receptor binding pocket.
템플릿:
{aspect ratio} {style} structural model of {subject}.
Cross-section view showing: {component 1}, {component 2}, {component 3}.
Label each component with quoted names: "{label 1}", "{label 2}", "{label 3}".
Scale bar: "{scale}". {visual constraints}
예시:
1:1 textbook cartoon structural model of a eukaryotic cell.
Cross-section view showing: nucleus, mitochondria, endoplasmic reticulum, golgi, ribosomes, lysosomes.
Label each component with quoted names: "Nucleus", "Mitochondria", "Endoplasmic Reticulum", "Golgi Apparatus", "Ribosomes", "Lysosomes".
Scale bar: "10 μm". Palette: soft blue + green + peach, white background, sans-serif labels, no watermark.
흔한 실수: 뷰 지정 누락(cross-section vs. surface vs. exploded), 스케일바 잊기, 레이블 과밀.
패턴 3: 개념·시스템 모델
언제 사용하나: 여러 구성 요소가 어떻게 상호작용하는지 보여주고 싶을 때 — 기후 feedback loop, ecosystem 관계, 연구 질문의 경제 모델.
템플릿:
{aspect ratio} {style} conceptual systems model of {system}.
Show the relationships between: {component A}, {component B}, {component C}, {component D}.
Arrows indicate: {direction of influence / flow / feedback}.
Label each component with quoted names and label each arrow with quoted relationship names.
{visual constraints}
예시:
16:9 minimalist conceptual systems model of the carbon cycle.
Show the relationships between: "Atmospheric CO2", "Ocean", "Forests", "Soil", "Human Activity".
Arrows indicate: absorption, emission, fixation, respiration, industrial release.
Label each arrow with quoted names: "Absorption", "Emission", "Fixation", "Respiration", "Industrial".
Palette: green + blue + gray, clean lines, sans-serif labels, no watermark.
흔한 실수: 레이블 없는 화살표(독자가 각각의 의미를 알 수 없음), 너무 많은 구성 요소, 일관성 없는 화살표 스타일.
패턴 4: 비교 모델
언제 사용하나: 두 개 이상의 상태를 나란히 보여주고 싶을 때 — 건강한 vs. 병든 조직, 야생형 vs. 돌연변이, treatment 전 vs. 후.
템플릿:
{aspect ratio} side-by-side comparison model.
Left panel: {state A} — show {features A}. Label: "{state A}".
Right panel: {state B} — show {features B}. Label: "{state B}".
Highlight differences with {markers, arrows, or circles}.
{visual constraints}
예시:
16:9 side-by-side comparison model of neuronal synapse states.
Left panel: healthy synapse — show normal vesicle release, proper receptor density, clean cleft. Label: "Healthy Synapse".
Right panel: diseased synapse — show reduced vesicles, sparse receptors, debris in cleft. Label: "Alzheimer's Disease".
Highlight differences with red circles. Palette: blue + red accent, white background, sans-serif labels, no watermark.
흔한 실수: 스케일이나 시점이 맞지 않는 패널(비교 어려움), 상태 레이블 누락, 너무 미묘한 차이.
패턴 5: 수학·정량 모델
언제 사용하나: 변수 사이의 관계를 보여주고 싶을 때 — 성장 곡선, dose-response, phase diagram. 참고: 실제 데이터에는 R/Python/Prism을 써야 합니다. 이 패턴은 개념적 표현용입니다.
템플릿:
{aspect ratio} conceptual graph showing {y-variable} vs. {x-variable}.
Curve shape: {shape - linear, sigmoid, exponential, bell curve}.
X-axis label: "{label}". Y-axis label: "{label}".
Annotate key regions: "{region 1}", "{region 2}".
Clean scientific chart style, no grid, no watermark.
예시:
16:9 conceptual graph showing drug concentration vs. response.
Curve shape: sigmoid S-curve.
X-axis label: "Log [Drug] (M)". Y-axis label: "Response (%)".
Annotate key regions: "Threshold", "EC50", "Saturation".
Clean scientific chart style, sans-serif axes, no grid, no watermark.
흔한 실수: AI에게 실제 데이터 생성을 요청(불가능 — 통계 도구 사용), 축 레이블 누락, 일관성 없는 tick mark.
패턴 6: 물리·기계 모델
언제 사용하나: 물리·공학 논문 — 힘 다이어그램, 광학 셋업, 회로 스키매틱, 유체 흐름 다이어그램.
템플릿:
{aspect ratio} {style} physical model of {setup}.
Components: {component 1}, {component 2}, {component 3}.
Show: {flow / force / signal path} with directional arrows.
Label components with quoted names. Include {measurements / units / scale}.
Engineering schematic style, no watermark.
예시:
16:9 clean engineering schematic of a laser interferometer.
Components: "Laser Source", "Beam Splitter", "Mirror M1", "Mirror M2", "Detector".
Show: light path with red arrows from laser through beam splitter to mirrors and detector.
Include wavelength: "632.8 nm". Engineering schematic style, sans-serif labels, no watermark.
흔한 실수: 연결 없이 떠 있는 구성 요소, 방향 화살표 누락, 일관성 없는 선 스타일.
AI 모델 생성이 적합하지 않은 경우
다른 것을 써야 할 세 가지 경우:
1. 실제 분자 좌표가 필요할 때. AlphaFold, ChimeraX, PyMOL을 사용하세요. AI 이미지 생성기는 분자의 "겉모습"을 만들지만 실제 3D 구조는 아닙니다. 리뷰어가 "이게 올바른 단백질 fold인가?"라고 물으면 AI 이미지로 답할 수 없습니다.
2. 시뮬레이션 출력이 필요할 때. 유체역학, 유한요소, Monte Carlo — MATLAB, COMSOL, Python + NumPy, 또는 실제 시뮬레이션 패키지가 필요합니다. AI는 데이터가 있은 후 개념을 일러스트할 수 있지만, 데이터를 계산할 수는 없습니다.
3. 정확한 정량 데이터 차트가 필요할 때. R, Python, GraphPad Prism, Origin을 사용하세요. AI 생성 차트는 일러스트레이션이지 실제 데이터가 아닙니다.
실제 시뮬레이션 위에 앉는 2D 개념 모델 — "우리가 연구한 시스템은 이렇다" 피규어 — 에 대해서는 AI 생성기가 종종 출판 가능한 결과로 가는 가장 빠른 경로입니다.
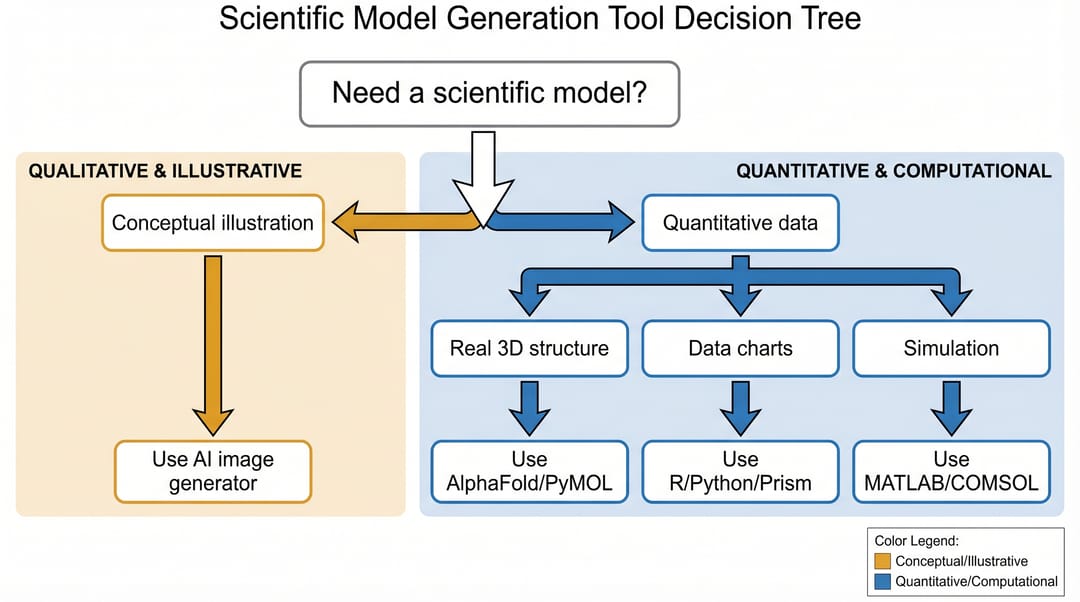 의사결정 트리: 개념적 일러스트레이션이 필요하면 AI, 실제 정량 출력이 필요하면 시뮬레이션·통계 도구를 사용.
SciDraw AI가 scientific model 생성에 어떻게 들어맞는가
SciDraw AI의 모델:
- 과학 피규어 데이터셋에 학습됨(범용 이미지 데이터셋이 아님). 따라서 "mechanism model"이나 "cross-section model"이 무엇을 의미하는지 알고 있음
- 위 6가지 프롬프트 패턴을 기본으로 지원
- SVG로 내보내 Illustrator, Inkscape, PowerPoint에서 결과를 열 수 있음
- Free tier: 월 50 크레딧, 10개 모델에 충분
sci-draw.com/ai-drawing에서 시작하거나 /scientific-drawing에서 제품 walkthrough를 확인할 수 있습니다.
독자별 이 가이드 사용법
- 첫 AI 모델을 프롬프트하는 대학원생: 위 6개 템플릿 중 하나를 복사하고 세부사항을 채워 반복하세요. 기껏해야 프롬프트 2~3개를 낭비하게 될 것입니다.
- 리뷰 논문을 쓰는 포닥: 패턴 3(개념·시스템 모델)을 가장 자주 사용하게 될 것입니다. 구성 요소 수를 6개 이하로 유지하세요.
- 랩용 도구를 고르는 PI: 단백질 구조를 다룬다면 AlphaFold + PyMOL을 유지하세요. 개념 스키매틱이 포함된 작업이라면 AI 모델 생성기가 피규어당 몇 시간을 절약합니다.
- 의학 일러스트레이터: 패턴 2(구조)와 패턴 4(비교)가 여러분의 주력입니다. AI가 80% 초안까지 데려다주고, 나머지 20%는 여러분이 마무리합니다.
Scientific model은 의도적인 단순화입니다. AI 생성기의 역할은 여러분의 단순화를 정확히 출력하는 것 — 더 예쁘게 만들거나 자기 아이디어를 추가하지 않고, 여러분이 이미 머릿속에 가진 그림을 ship하는 것입니다.
👉 SciDraw AI에서 첫 scientific model 생성하기 — 무료
관련 가이드
- 과학 피규어용 Gemini Nano Banana 프롬프트 — 특정 모델의 레이블 정확도 팁
- 2026년 scientific diagram을 위한 최고의 AI 도구 — 8개 도구 벤치마크
- 과학 피규어 그리는 방법 — 7가지 디자인 원칙 플레이북
- Scientific Graphics란 무엇인가 — 6가지 그래픽 범주
- AI Scientific Illustration — 일러스트레이션 스타일 출력 제품 페이지
- Scientific Diagram Maker — 메커니즘·플로우차트 빌더