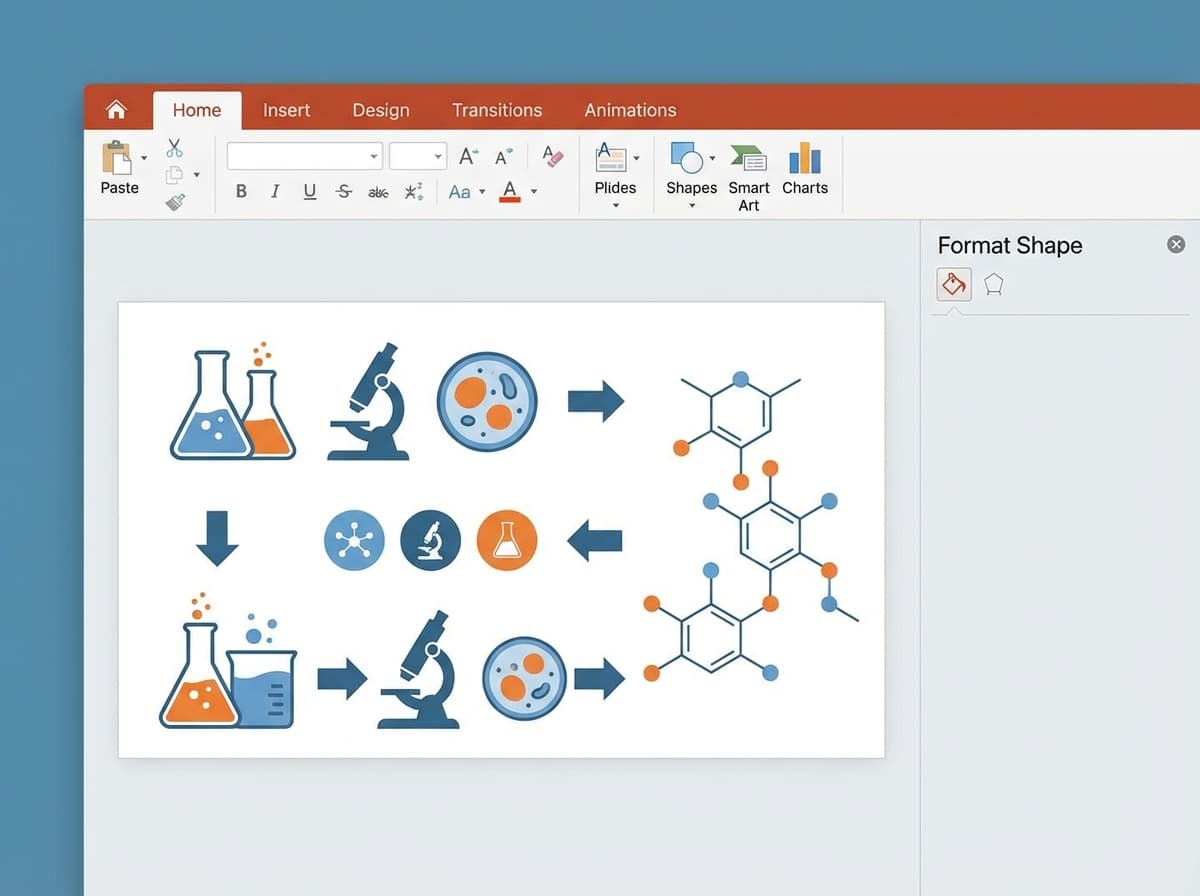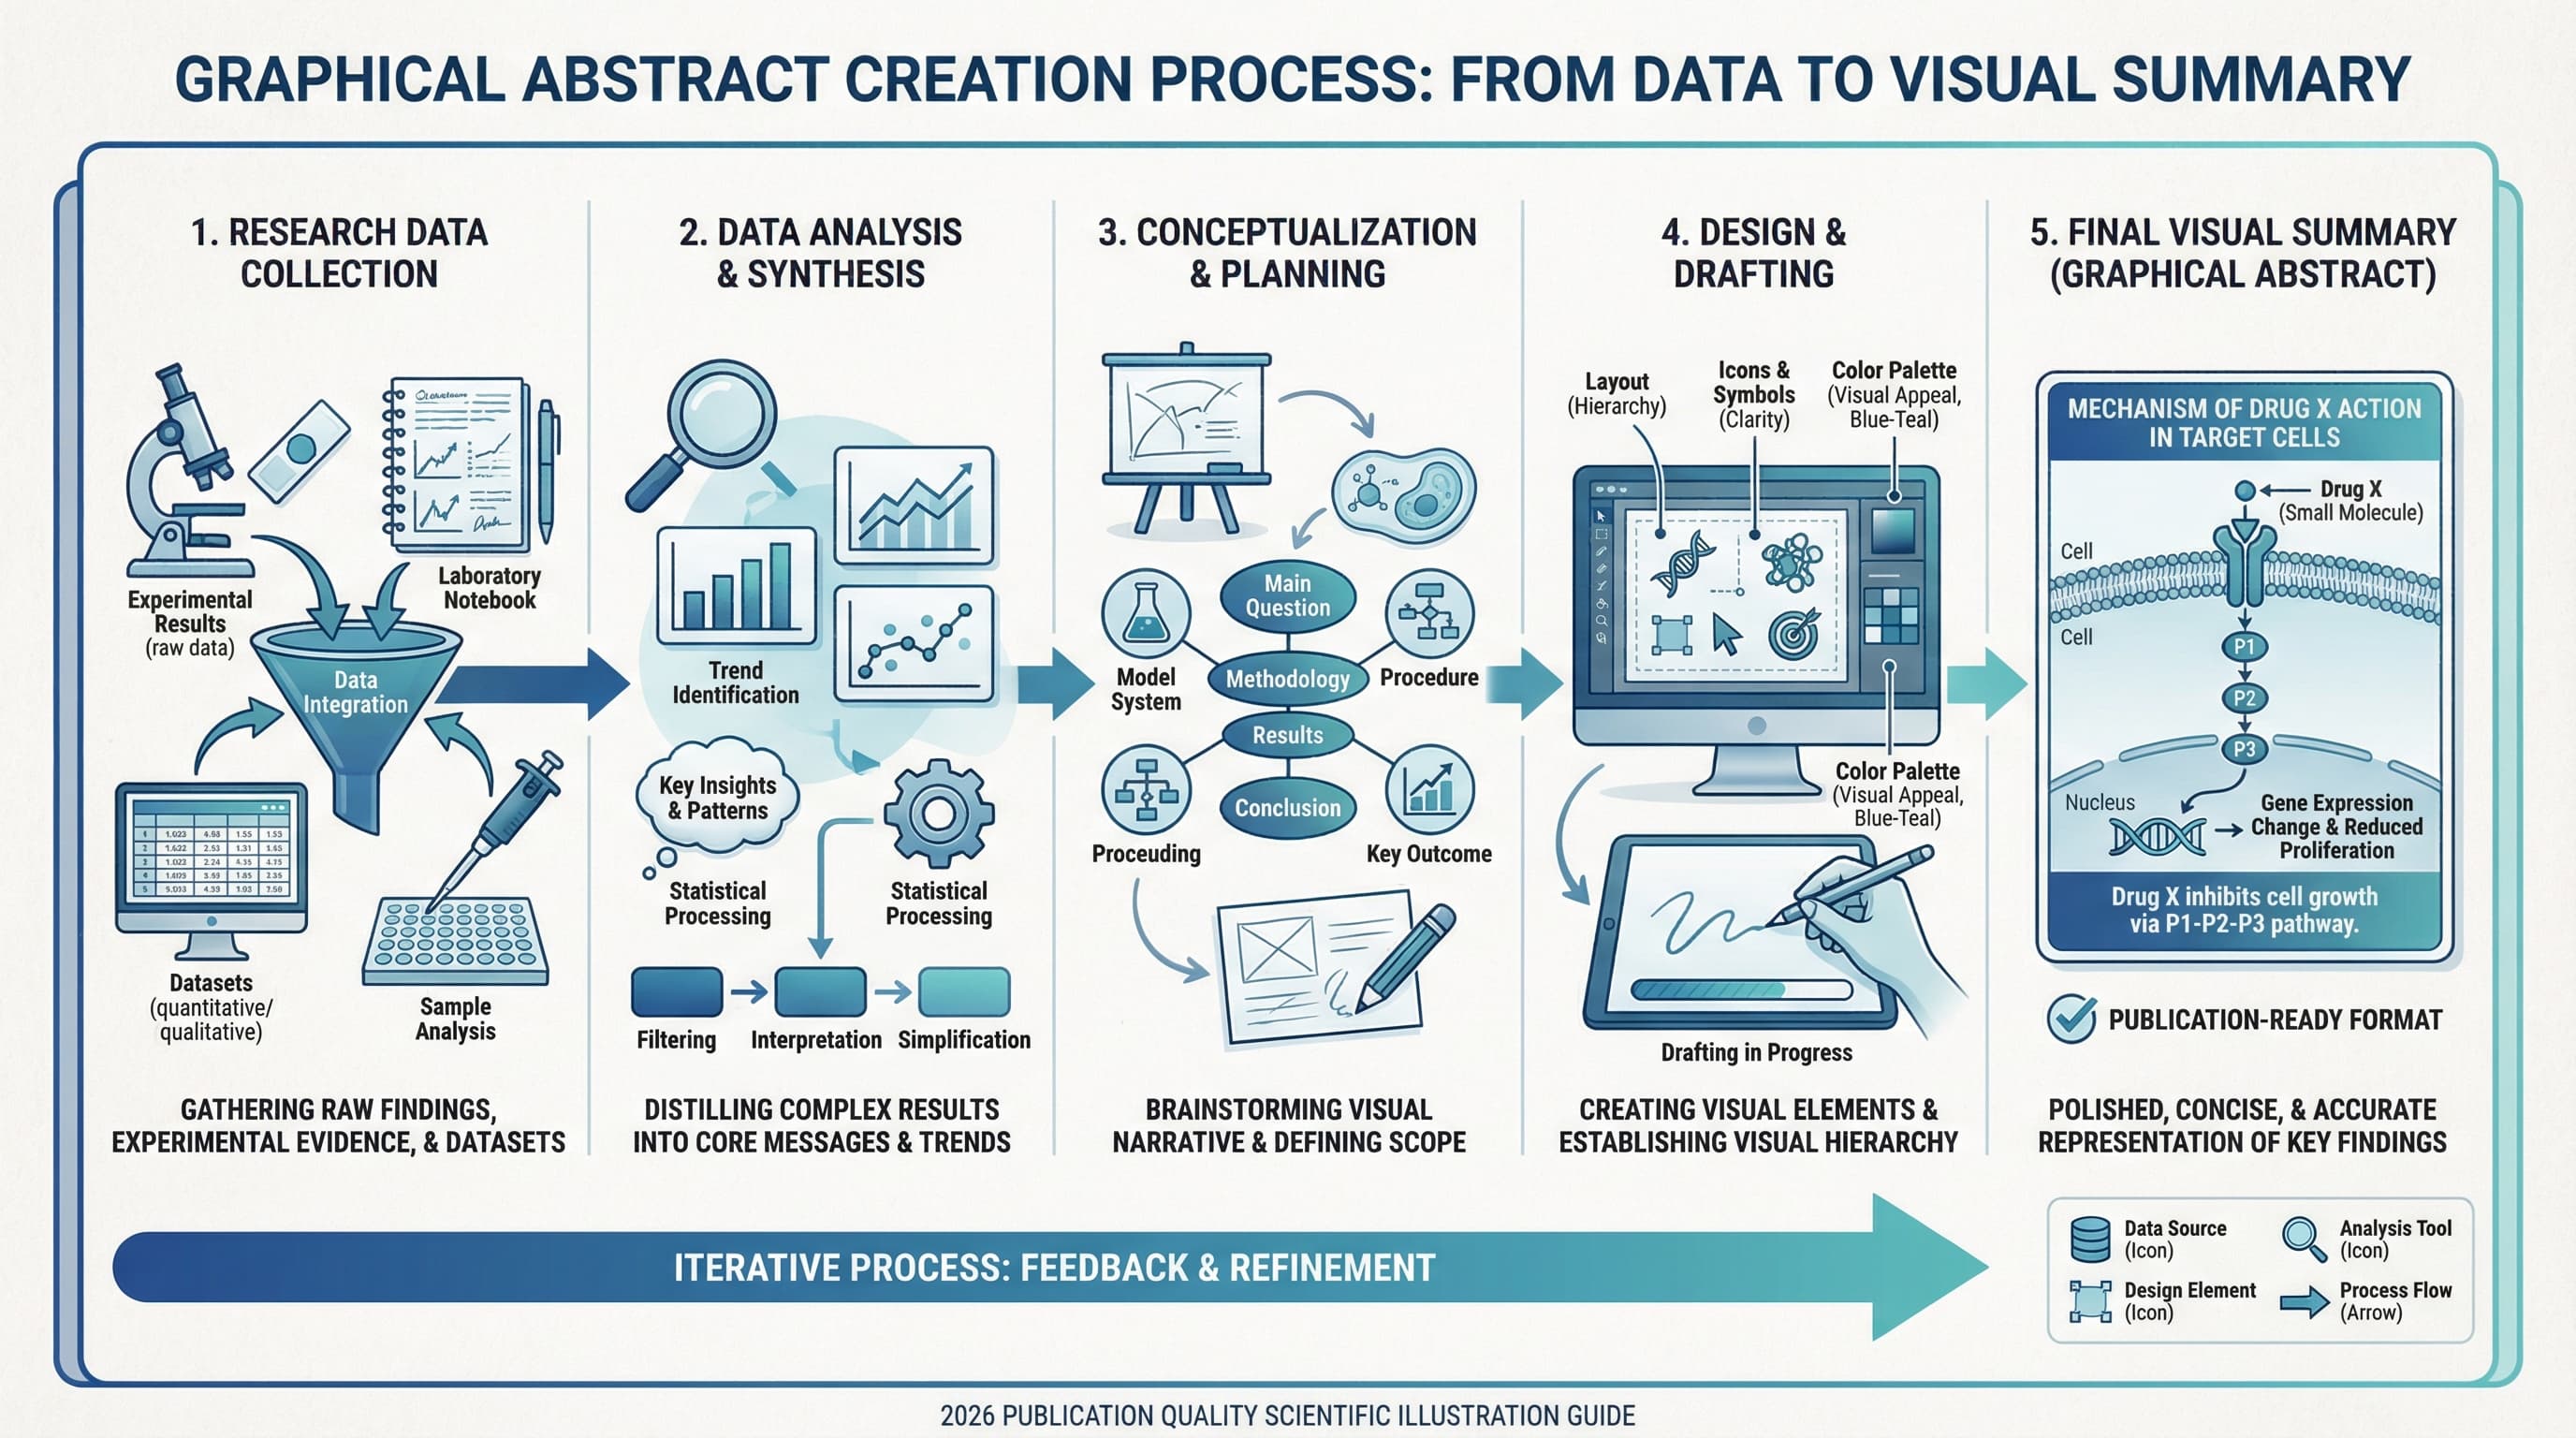
Scidraw AI Advantage: AI Generation → SVG Vector Export → Edit freely in PowerPoint/Illustrator. Try it now →
Introduction: Why Graphical Abstracts Matter More Than Ever
In the competitive landscape of scientific publishing, your research has approximately 3 seconds to capture a reader's attention. With over 3 million scientific papers published annually, standing out in search results and journal tables of contents has never been more critical.
A graphical abstract is a single, concise visual summary that represents your research findings at a glance. Unlike traditional text abstracts, graphical abstracts communicate complex scientific concepts through carefully designed visuals, making your work more accessible and shareable.
The Impact of Graphical Abstracts
Research shows that articles with graphical abstracts receive:
- 2.5x more downloads compared to text-only abstracts
- Higher social media engagement on platforms like Twitter/X and ResearchGate
- Improved visibility in journal tables of contents
- Better understanding by readers from adjacent fields
Many high-impact journals now require graphical abstracts for submission, including Cell Press, Elsevier journals, and numerous Nature portfolio publications. Whether optional or mandatory, a well-designed graphical abstract can significantly boost your paper's reach and citation potential.
What Makes a Great Graphical Abstract?
Before diving into the creation process, let's understand what separates exceptional graphical abstracts from mediocre ones.
The Anatomy of an Effective Graphical Abstract

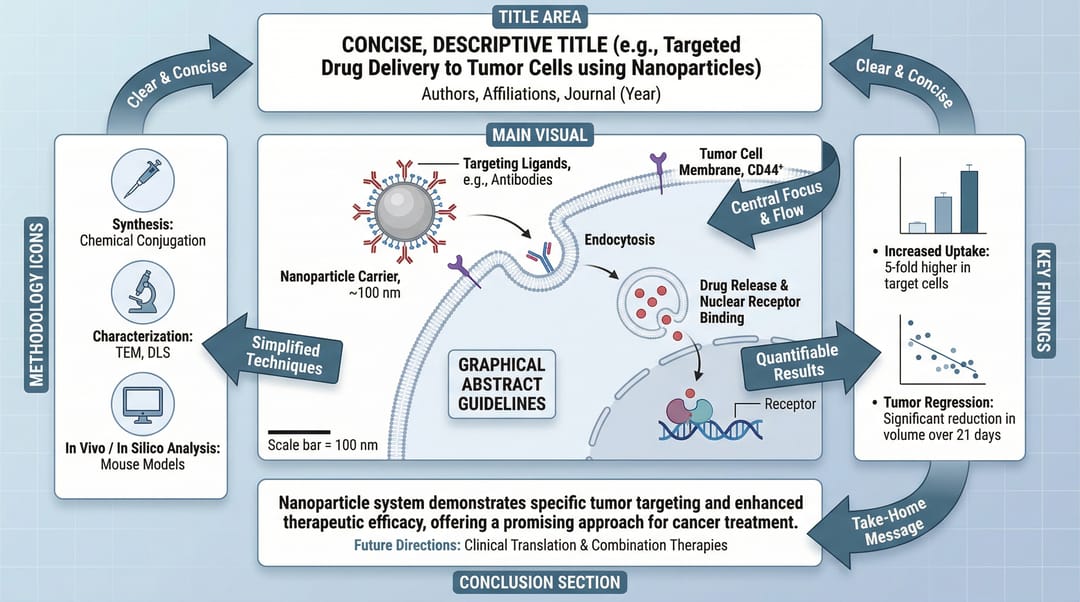
A successful graphical abstract contains these essential elements:
| Component | Purpose | Best Practice |
|---|---|---|
| Central Visual | Captures the main finding or concept | Use a clear, dominant image that tells your story |
| Key Data | Supports your main claim | Include 1-2 critical results (graphs, numbers) |
| Process Flow | Shows methodology or mechanism | Use arrows to guide the reader's eye |
| Labels & Annotations | Clarifies visual elements | Keep text minimal but informative |
| Conclusion | Summarizes the takeaway | Optional text box with main finding |
Design Principles for Scientific Visuals
1. Simplicity is Key
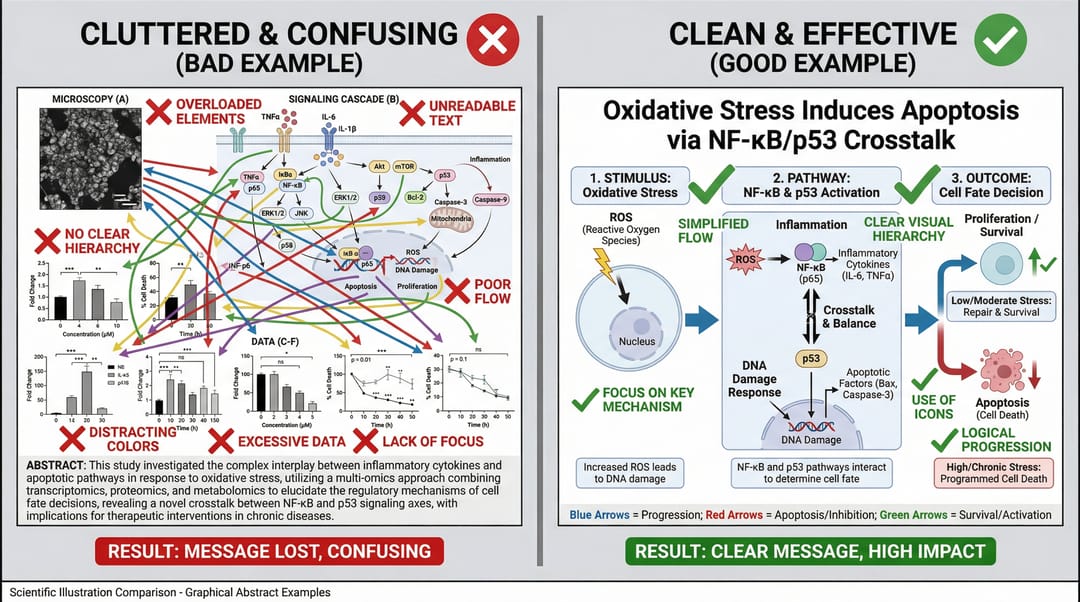
Your graphical abstract should communicate ONE main message. Resist the temptation to include every finding from your paper. Ask yourself: "If someone remembers only one thing from my research, what should it be?"
2. Visual Hierarchy
Guide the reader's eye through your visual using:
- Size (larger elements appear more important)
- Color (use contrast to highlight key elements)
- Position (left-to-right, top-to-bottom reading patterns)
- Arrows and connectors (show relationships and flow)
3. Color Psychology in Science
| Color | Common Usage | Scientific Context |
|---|---|---|
| Blue | Trust, stability | Water, cold temperatures, negative controls |
| Red | Attention, importance | Heat, inflammation, upregulation |
| Green | Growth, success | Plants, positive outcomes, downregulation |
| Yellow/Orange | Energy, warning | Energy transfer, caution |
| Purple | Innovation, mystery | Novel findings, unique mechanisms |
4. Typography Guidelines
- Use sans-serif fonts (Arial, Helvetica) for better screen readability
- Minimum font size: 8-10 pt for final output
- Limit to 2 font weights (regular and bold)
- Ensure sufficient contrast between text and background
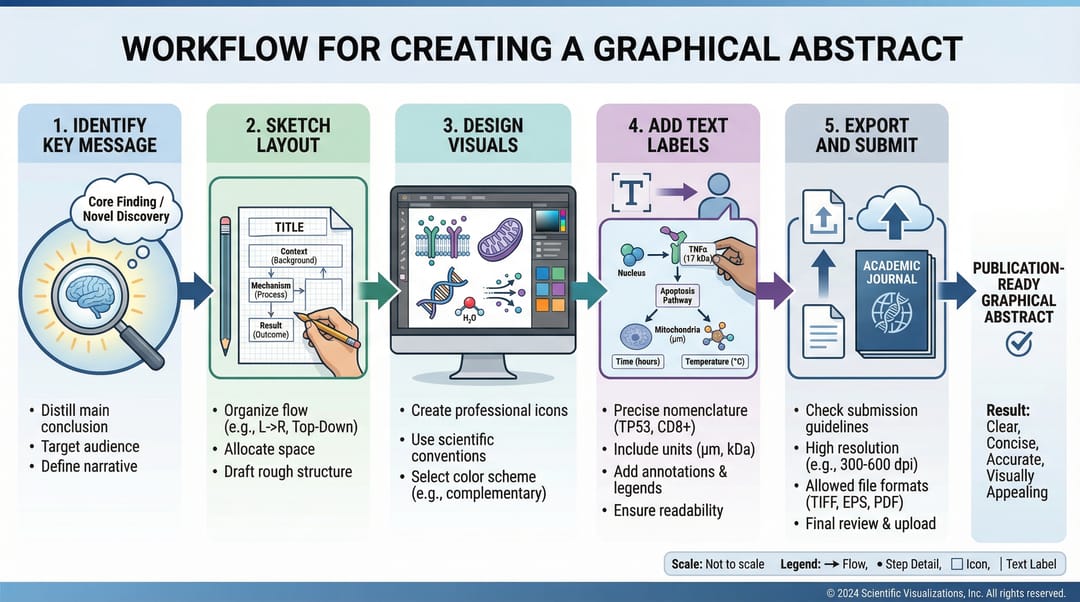
Step-by-Step Guide to Creating a Graphical Abstract
Step 1: Identify Your Key Message
Before opening any design software, answer these questions:
- What is the single most important finding of your research?
- Who is your target audience? (Specialists vs. general scientists)
- What visual metaphor best represents your work?
- What action do you want readers to take? (Read the paper, cite your work)
Exercise: Write your key message in one sentence (under 15 words). This becomes the foundation of your graphical abstract.
Step 2: Sketch Your Layout

Start with pen and paper. Rough sketches help you:
- Explore multiple layout options quickly
- Identify the visual flow
- Determine which elements are essential
- Avoid getting distracted by design details
Common Layout Patterns:
| Pattern | Best For | Example |
|---|---|---|
| Linear Flow | Sequential processes, timelines | Drug discovery pipeline |
| Central Focus | Single dominant finding | Novel molecule structure |
| Before/After | Treatment effects, comparisons | Disease progression |
| Circular/Cycle | Feedback loops, recurring processes | Cell cycle, metabolic pathways |
| Split Screen | Comparisons, contrasts | Healthy vs. diseased tissue |
Step 3: Gather Visual Assets
Collect or create the visual elements you'll need:
Stock Resources for Scientific Illustrations:
- Protein structures: RCSB PDB
- Cell components: BioRender, Servier Medical Art
- Chemical structures: ChemDraw, PubChem
- Icons: Noun Project, Flaticon (check licensing)
Creating Custom Elements:
- Export graphs from your analysis software (R, Python, Prism)
- Screenshot and crop relevant data visualizations
- Use vector graphics software for custom shapes
Step 4: Design Your Graphical Abstract
Now it's time to bring your sketch to life. Whether you're using traditional tools or AI-powered solutions, follow these guidelines:
Composition Tips:
- Leave breathing room - Don't fill every pixel. White space improves readability.
- Align elements - Use grids and guides for professional appearance.
- Group related items - Visual clustering aids comprehension.
- Test at actual size - Your abstract will appear as a small thumbnail.
Technical Specifications (General Guidelines):
| Specification | Typical Requirement |
|---|---|
| Dimensions | 500-1500 pixels wide |
| Resolution | 300 DPI for print, 72-150 DPI for web |
| File Format | TIFF, PNG, JPEG, or EPS |
| Color Mode | RGB for online, CMYK for print |
| File Size | Usually under 5 MB |
Step 5: Add Labels and Annotations
Labels transform a pretty picture into a scientific communication:
- Use consistent terminology with your paper
- Include units and scale bars where applicable
- Add arrows to show direction or causation
- Consider numbered callouts for complex diagrams
Pro Tip: Test your graphical abstract by showing it to a colleague outside your immediate field. Can they understand the main message without reading your paper?
Step 6: Export and Submit
Before final export:
- Check journal requirements (dimensions, format, file size)
- Verify text is readable at thumbnail size
- Confirm colors are accurate (especially for data representations)
- Save in multiple formats (vector for editing, raster for submission)
Common Mistakes to Avoid

The "Everything But the Kitchen Sink" Approach
Problem: Cramming every figure from your paper into one image. Solution: Focus on your single most important finding. Less is more.
The "Wall of Text" Trap
Problem: Using paragraphs of text instead of visuals. Solution: If it needs more than 20 words, it's not a graphical abstract.
The "Colorful Chaos" Effect
Problem: Using too many colors without purpose. Solution: Limit your palette to 3-4 colors with specific meanings.
The "Invisible Details" Issue
Problem: Including elements too small to see at display size. Solution: Design at 100% zoom and test at 50% to ensure readability.
The "Orphan Elements" Problem
Problem: Visual elements floating without context or connection. Solution: Use arrows, lines, or proximity to show relationships.
The "Copyright Violation" Risk
Problem: Using copyrighted images without permission. Solution: Create original graphics, use licensed resources, or get explicit permission.
Tools for Creating Graphical Abstracts
Traditional Design Software
| Tool | Pros | Cons | Best For |
|---|---|---|---|
| Adobe Illustrator | Professional quality, full control | Steep learning curve, expensive | Experienced designers |
| Inkscape | Free, vector-based | Less intuitive interface | Budget-conscious researchers |
| PowerPoint | Familiar interface, accessible | Limited precision | Quick drafts |
| BioRender | Pre-made scientific templates | Subscription required | Biology-focused work |
AI-Powered Solutions
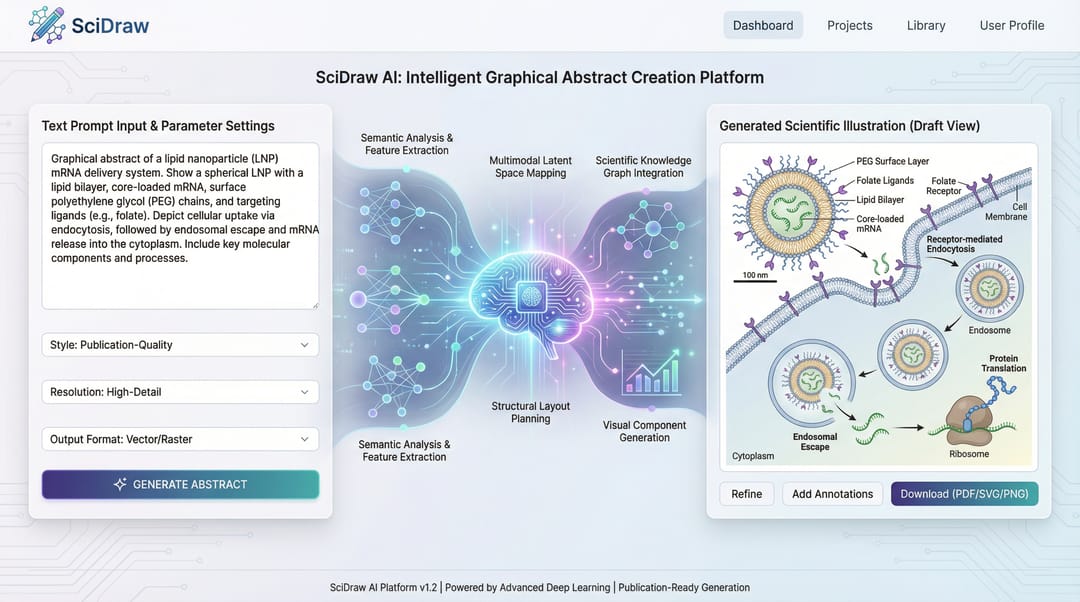
The emergence of AI has revolutionized scientific illustration. Tools like Scidraw AI can generate publication-quality graphical abstracts in minutes:
Advantages of AI-Generated Graphics:
- Speed: Generate concepts in seconds, not hours
- Iteration: Quickly explore multiple design directions
- Accessibility: No design expertise required
- Consistency: Maintain professional quality across figures
- Editability: Export to SVG for further customization

Creating Graphical Abstracts with AI: A Modern Approach
Why Consider AI for Your Graphical Abstract?
Traditional graphical abstract creation requires:
- Hours of design work
- Proficiency in vector graphics software
- Access to scientific illustration libraries
- Multiple revision cycles
AI-powered tools like Scidraw AI compress this workflow dramatically:
- Describe your research in natural language
- Generate multiple concepts instantly
- Select and refine your preferred design
- Export as SVG for further editing
Example Prompts for Graphical Abstracts
For a drug discovery paper:
Create a graphical abstract showing:
1. High-throughput screening of compound library
2. Lead compound identification (highlight molecule)
3. In vitro efficacy testing (cell assay results)
4. In vivo validation (mouse model showing tumor reduction)
Horizontal flow, use blue and orange color schemeFor a mechanism study:
Graphical abstract depicting:
- Receptor-ligand binding at cell membrane
- Intracellular signaling cascade (3-4 key proteins)
- Nuclear translocation and gene activation
- Downstream cellular response
Vertical layout, molecular biology styleFor a clinical study:
Visual summary of clinical trial:
- Patient cohort (n=200, inclusion criteria icons)
- Randomization into treatment vs. control
- Primary endpoint comparison (bar graph showing significance)
- Key finding: 40% improvement in outcome measure
Clean, minimal design with medical iconographyTips for Effective AI Prompts
- Be specific about layout (horizontal, vertical, circular)
- Mention color preferences aligned with your field
- Include key data points you want visualized
- Specify the style (flat design, 3D, schematic)
- Request annotation placement for important elements
Journal-Specific Requirements
Different journals have different specifications. Here's a quick reference:
| Publisher | Dimensions | Format | Key Requirements |
|---|---|---|---|
| Elsevier | 531 × 1328 px | JPEG/PNG/TIFF | White background preferred |
| Cell Press | Square format | TIFF/EPS | High resolution (300 DPI) |
| Nature | 180mm width | TIFF/EPS/PDF | RGB color mode |
| Wiley | Varies by journal | TIFF/EPS | Check specific journal |
| ACS | 3.25" × 1.75" | TIFF | 600 DPI for TOC graphics |
Always check your target journal's author guidelines for the most current specifications.
Best Practices Checklist
Before submitting your graphical abstract, verify:
- Single clear message - Can someone understand it in 5 seconds?
- Appropriate dimensions - Matches journal requirements
- Readable at thumbnail size - All text legible when shrunk
- Consistent with paper content - Accurately represents your findings
- Professional quality - Clean lines, proper alignment
- Appropriate colors - Meaningful, accessible, not overwhelming
- Original content - No copyright violations
- Correct file format - As specified by the journal
- Under file size limit - Check journal requirements
- Final proofreading - No typos or errors
Conclusion: Your Visual Research Ambassador
A graphical abstract is more than a required submission component—it's your research's visual ambassador to the scientific community. In an era of information overload, a well-crafted graphical abstract can mean the difference between your work being noticed or overlooked.
Key Takeaways:
- Start with your key message - One finding, one visual story
- Sketch before designing - Plan your layout on paper first
- Follow design principles - Simplicity, hierarchy, and clarity
- Match journal requirements - Check specifications before starting
- Consider AI tools - Modern solutions like Scidraw AI can save hours
Whether you choose traditional design software or AI-powered generation, the principles remain the same: communicate clearly, design professionally, and always keep your audience in mind.
Start Creating Professional Graphical Abstracts Today
Ready to create stunning graphical abstracts for your next publication? Scidraw AI combines AI-powered generation with SVG export, giving you the speed of automation with the flexibility of manual editing.
What you get with Scidraw AI:
- Generate publication-quality graphics from text descriptions
- Export as editable SVG files
- Customize in PowerPoint, Illustrator, or any vector editor
- Create consistent visuals across all your publications
👉 Try Scidraw AI Free - Create Your First Graphical Abstract
Frequently Asked Questions
How long should I spend on a graphical abstract?
For traditional methods, expect 2-4 hours for a polished result. With AI tools like Scidraw AI, you can generate and refine a graphical abstract in 15-30 minutes.
Can I use the same graphical abstract for multiple journals?
You may need to adjust dimensions and file format, but the core visual can remain the same if it accurately represents your research.
Should I include statistical data in my graphical abstract?
Only if it's central to your message. A simple bar graph showing your main finding can be powerful, but avoid cluttering with multiple data panels.
What if my journal doesn't require a graphical abstract?
Create one anyway! It's valuable for social media promotion, conference presentations, and your portfolio.
Is AI-generated art acceptable in scientific publishing?
Yes, as long as you disclose AI assistance where required and ensure the content accurately represents your research. Many researchers now use AI as a starting point and refine with traditional tools.
Related Guides
- Free AI Graphical Abstract Maker — create graphical abstracts in under 5 minutes
- Graphical Abstract Requirements by Journal — size, format, and color specs by publisher
- Scientific Infographics for Papers — design visual summaries for research
- Scientific Figure Types Guide — choose the right visual for your data
- Graphical Abstract Maker Tool — free online graphical abstract creator