A reviewer wants one label fixed, two treatment groups recolored, and the panel letters re-lettered — by Friday. You do not want to redraw the figure. You want to open it, change three things, and re-export at the right DPI.
If your file is a real SVG with live text, that's a 10-minute job and this guide walks it. But a lot of "SVG" files secretly aren't editable — the text was flattened to outlines, or you only ever had a PNG. This guide covers both: the clean path, and what to do when the file fights back.
The short version: open the SVG in PowerPoint, Illustrator, or Inkscape, ungroup, edit text and colors as vector objects, re-export. If the text won't edit (outlined) or you only have a PNG/JPG, you can't fix it by hand — vectorize it back into editable layers or rebuild the panel first.
Find your situation
| What you're facing | Fastest fix |
|---|---|
| Real SVG, just need a label / typo / panel-letter change | Ungroup and edit text directly — jump to PowerPoint |
| A pathway/group needs new (colorblind-safe) colors | Select matching fills and batch-recolor — Illustrator method |
| You only have a PNG/JPG, no editable vector | Vectorize it to editable SVG before you touch the text |
| Text shows as shapes, not editable text | The SVG was outlined — see the fix below |
| The figure is blurry after resizing | Re-export at 300/600 DPI at the print width |
| It needs more than a small edit | Rebuild with Mechanism Figure Generator or Workflow Diagram Generator |
Who this is for
You generated a figure — AI tool, BioRender, ChemDraw, matplotlib — exported SVG, and now need a single-pass revision for Nature, Cell, Science, an Elsevier title, or your committee. You're not starting over. You want the label, the color, or the panel order changed, and a clean re-export.
First: is your SVG actually editable?
This is the 30-second test that decides everything below. Open the SVG and try to click one piece of text.
- It selects as a text box you can retype → you have a live SVG. Every method below works.
- It selects as a shape / outline you can't type into → the text was converted to paths. No editor can "uneditable" it; you'll retype or re-extract (covered in Help — the text won't edit).
- There's nothing vector at all, it's a flat image → it's a PNG/JPG in an SVG wrapper, or just a raster. Vectorize it first.
Why SVG is worth keeping when it is live:
| SVG (live text) | PNG / JPEG | |
|---|---|---|
| Scaling | Infinite, no quality loss | Fixed resolution |
| Edit a label | Retype in seconds | Redraw the whole area |
| Recolor one pathway | Per-element | Full redesign |
| Journal acceptance | Increasingly preferred | Still common |
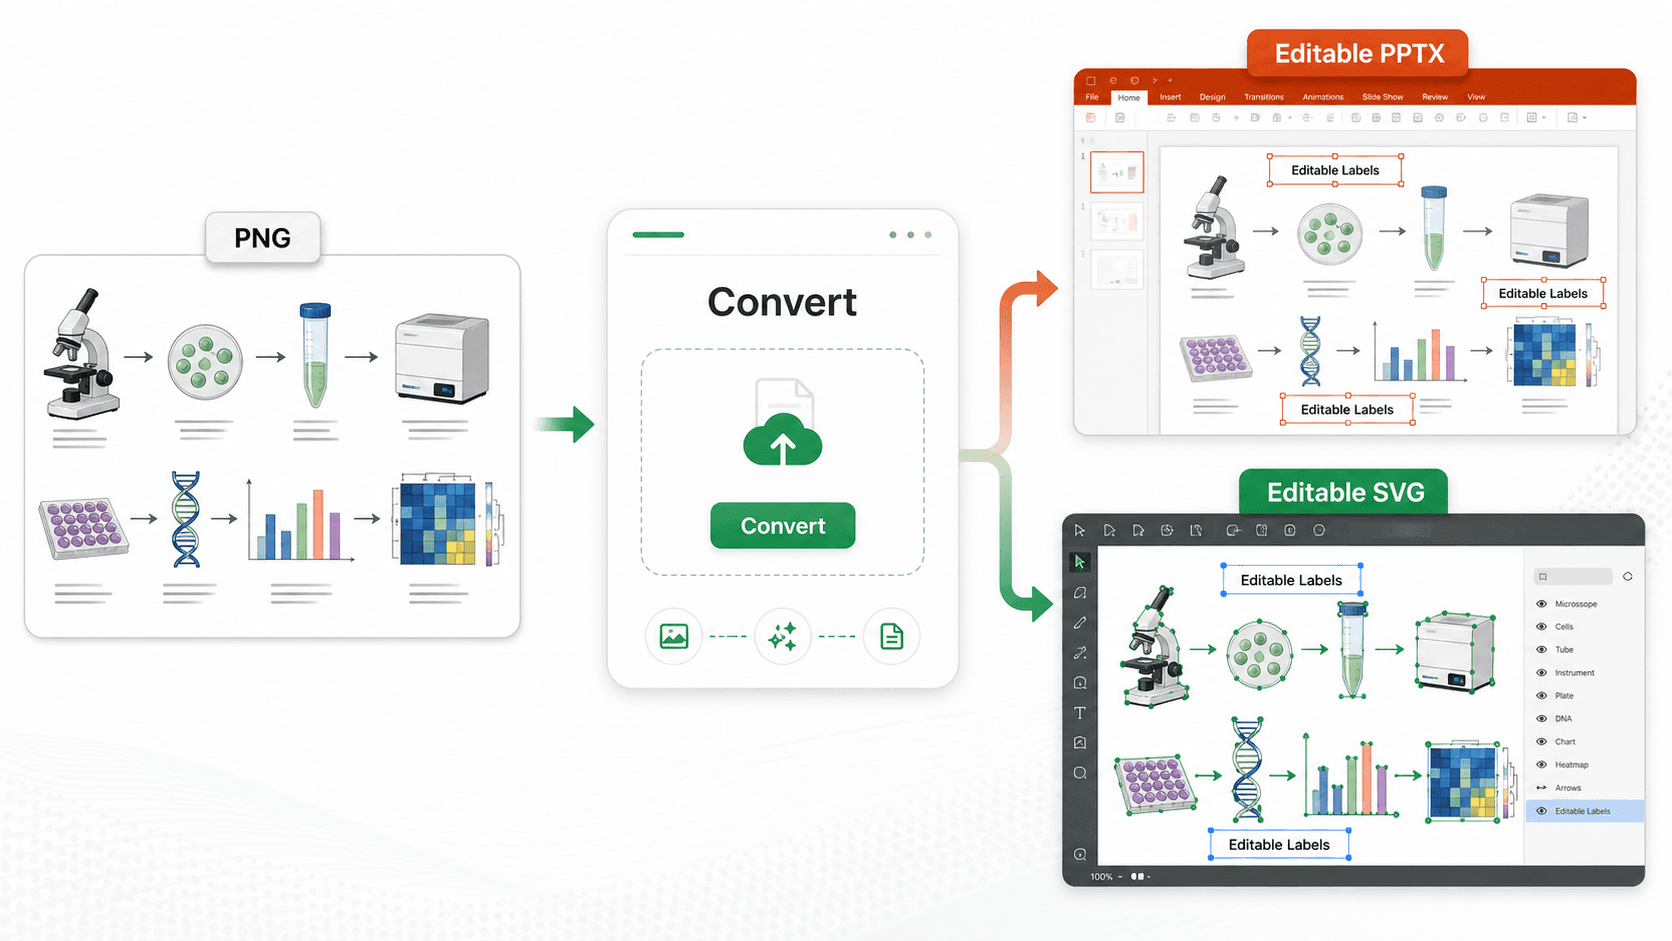
 A live SVG turns a flat image into editable vector shapes — anchor points, paths, and layers you can actually change.
Method 1: PowerPoint (the fastest route)
You already have it, and for "fix the label and resubmit" it beats everything.
- Insert → Pictures → This Device → select the SVG. It lands as one grouped object.
- Ungroup twice. Right-click → Group → Ungroup. PowerPoint asks to convert it to a drawing object — click Yes. Right-click → Group → Ungroup once more. Now every shape and label is its own object.
- Edit text. Click a label, retype. Keep to Arial / Helvetica / Times New Roman so journals don't flag a font substitution.
- Recolor. Select a shape → Format → Shape Fill. Hold Shift to select several and recolor together.
- Re-export. Save as Picture → SVG to stay editable, or a 300 DPI PNG for submission. For final TIFF at the exact column width, see the conversion guide.
Method 2: Illustrator (for precise control)
When you have many color changes or need exact typography:
- File → Open the SVG; layers are preserved.
- Edit text with the Type Tool (T); use the Character panel for font, size, tracking.
- Batch-recolor: select one element of the target color → Select → Same → Fill Color → change the fill once to update them all. This is the fastest way to apply a colorblind-safe palette across a whole pathway.
- Export As → TIFF (LZW) or PDF for submission, 300/600 DPI, RGB unless the journal asks for CMYK.
 Selection handles, resize grips, and per-element color swatches make precise label and palette edits straightforward.
Method 3: Inkscape (free)
No Illustrator? Inkscape edits SVG natively and free: File → Open, click to select, double-click text to edit, use Fill & Stroke for colors, File → Export to PNG at 300+ DPI. Steeper learning curve than PowerPoint, but it handles everything Illustrator does for figure edits.
Help — the text won't edit
This is the wall most people hit, and no amount of clicking fixes it: the SVG was exported with text converted to outlines (paths). PowerPoint and Illustrator can only edit real text layers, so your labels are now frozen shapes.
You have two ways out:
- Retype over it — fine for one or two labels, miserable for a dense figure.
- Re-extract the text layer. Run the figure through an AI step that rebuilds editable text instead of tracing it as shapes, then edit normally. This is also the only practical fix when you only have a PNG/JPG with no vector source at all.
Stuck with an outlined SVG or a flat PNG? Don't retype 40 labels by hand. Vectorize Image converts it back to editable vector with text as real layers, and Convert AI Images to Editable SVG walks the AI route step by step.
When editing isn't worth it — rebuild instead
Some revisions are bigger than they look. If the reviewer's comment means re-ordering the whole mechanism, adding two steps, or the underlying file is too degraded to edit cleanly, you'll spend longer wrestling the SVG than regenerating it.
Mechanism Figure Generator and Workflow Diagram Generator rebuild the panel from a prompt with sharp, editable labels and journal-ready export — often faster than nudging anchor points by hand.
Bigger than a label change? Regenerate the figure with clean labels instead of fighting a broken file.
The four edits reviewers ask for most
1. Change a label. Select the text, retype, match the surrounding font and size. (If it won't edit, see above.)
2. Recolor for a colorblind-safe palette. Don't recolor element by element. In Illustrator use Select → Same → Fill Color; in PowerPoint multi-select with Shift. Document your hex codes so all figures in the paper stay consistent.
3. Resize to the journal's column. Single column is often 85–88 mm, double 174–180 mm. In Illustrator: Object → Transform → Scale (Uniform). In PowerPoint: Shift-drag a corner.
4. Add a scale bar, legend, or annotation. Build it with the shape and text tools, match the existing style, group related items for the next round of revisions.
Troubleshooting
"Colors shifted after export." Check color mode — RGB for screen, CMYK for some print workflows. Export in your target's mode.
"File size is huge." Flatten transparency, reduce anchor points on complex paths, delete hidden elements.
"It looks crisp on screen but blurry in the PDF." You exported below the journal's DPI. Re-export at 300 (photos) / 600 (line art) at final print width — step by step here.
Workflow habits that save the next revision
- Keep the editable SVG/AI source before exporting anything flat.
- Version your files:
figure1_v1.svg,figure1_v2_revised.svg. - Keep a hex palette doc for multi-figure papers.
- View at actual print size before submitting.
FAQ
Can you edit SVG text in PowerPoint?
Yes — insert the SVG, then ungroup twice (Right-click → Group → Ungroup, accept the "convert to drawing object" prompt, ungroup again). Text becomes editable text boxes you can retype, restyle, and recolor.
Why is my SVG text not editable after ungrouping?
The SVG was exported with text converted to outlines (paths), so there's no live text to edit. Either retype over it, or re-extract a real text layer with an AI step — see Convert AI Images to Editable SVG. If you only have a PNG/JPG, vectorize it first.
What font should I use for scientific figure SVGs?
Arial, Helvetica, or Times New Roman. They're on every system, journals accept them by default, and substitution won't shift your layout. Avoid Calibri, Open Sans, or custom fonts — reviewers' PDFs may render them differently.
How do I export a journal-ready figure after editing?
Re-save as SVG to keep editability, then export a 300 DPI PNG (photos) or 600 DPI TIFF (line art) at the journal's exact column width — 88/180 mm for Nature, 85/174 mm for Cell. Details in the conversion guide.
Can I edit a BioRender figure as SVG?
Only if you exported it as SVG (a premium BioRender tier). The free-tier PNG is a flat raster — vectorize it or regenerate the layout in Scientific Figure Maker first.
Which tool is fastest for a "fix the label and resubmit" revision?
PowerPoint, when the SVG has live text — ungrouping is one click and edits land in seconds. Use Illustrator for precise typography or many color changes. And when the text won't edit or you only have a PNG, hand-tools won't help — vectorize or rebuild instead.
Related Guides
- 4 Ways to Convert PNG/JPG to SVG — raster-to-vector methods
- Convert AI Images to Editable SVG — vectorize ChatGPT, Midjourney, DALL-E outputs
- Nature, Science & Cell Figure Requirements — DPI, size, and format specs
- Vectorize Image Tool — convert PNG/JPG to editable SVG online
- Image Converter Tool — convert between TIFF, PNG, SVG, and more