💡 SciDraw AI 的优势:科研场景调过的模型、标签准确、SVG 矢量导出——为真正能投稿的科研模型图打造。免费试用 →
你在一个通用图像 AI 里输入「给我画一个线粒体的科研模型」,出来的却是一颗带亮片的软糖豆。这不叫科研模型,这叫装饰图。让人抓狂的是:AI 可以 生成期刊级的科研模型图——前提是你得先知道「科研模型」这个词到底对应什么东西,以及应该怎么写 prompt。
这份指南是关于 正确 使用 AI 科研模型生成器的 playbook。内容基于我们在过去一段时间里内部用 AI 生成的 200+ 张模型图,覆盖细胞生物、蛋白-配体结合、气候模拟概念图和物理机制示意图。全文覆盖:
- 「科研模型生成」实际指的是什么(和多数人想的不一样)
- 让 70% 输出翻车的 3 个坑
- 6 个可靠能用的 prompt 套路
- 什么时候应该放弃 AI,去用专门的模拟工具
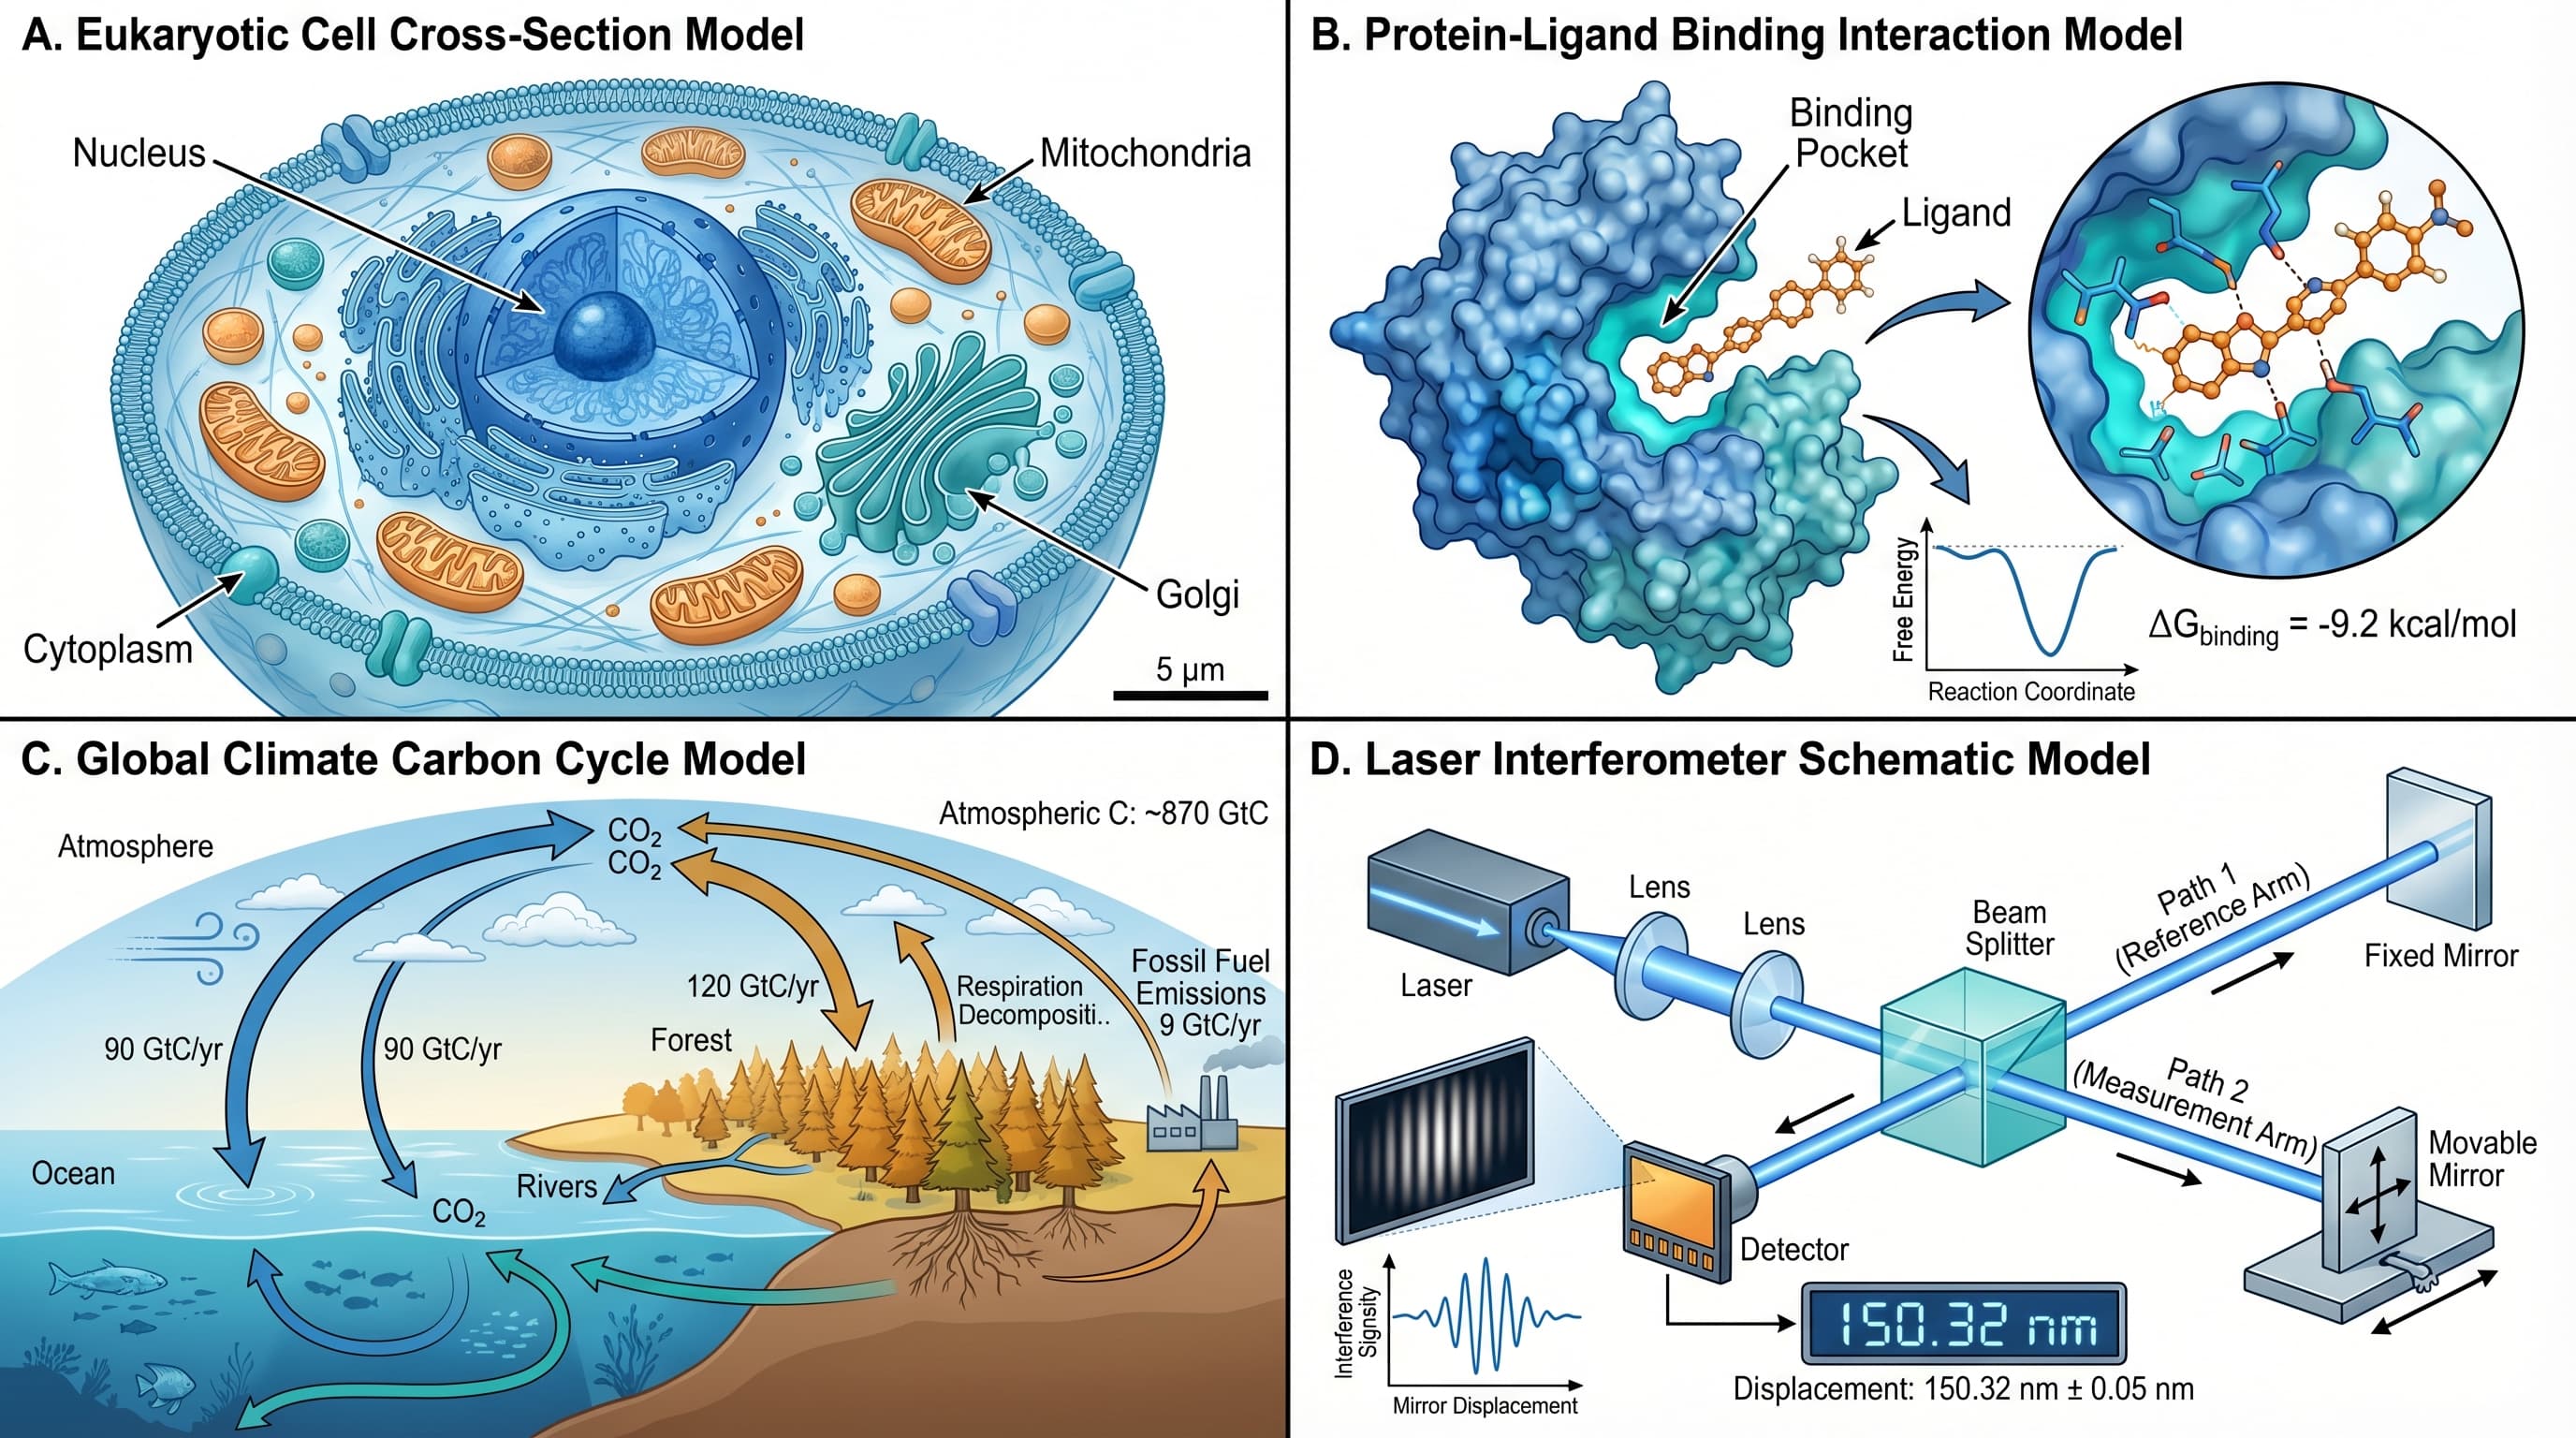
 四类 AI 生成的科研模型图,覆盖生物、化学、气候和物理。
先分清楚:「AI 科研模型生成器」到底指什么
这个词下面藏着两件完全不同的东西:
含义 1:生成三维物理模型 — 比如蛋白结构、分子构象、材料晶体结构。这是 AlphaFold 做的事。它不是一个通用创意 AI,而是一个专门输出真实三维坐标的深度学习模型,然后你用 PyMOL 或 ChimeraX 把这些坐标渲染成图。
含义 2:生成二维概念性科研模型 — 论文里那种表示「某个系统如何运作」的示意图。SciDraw AI、Figurelabs、BioRender 以及通用图像 AI 都在尝试做这件事。输出是一张图,不是结构数据。
这份指南讲的是 含义 2。如果你要的是含义 1(AlphaFold、RFDiffusion、ESMFold),这篇文章救不了你——那些是专门的蛋白预测工具,它们的输出是 .pdb 文件而不是图片。
搜「AI 科研模型生成器」的人,绝大多数真正想要的是含义 2:一个能快速画出带标签的概念性科研系统图的工具。
❌ 毁掉 70% 科研模型 prompt 的 3 个坑
1. 只写「一个 X 的科研模型」,不说是哪种模型。 「科研模型」是个含糊词——是机制图?三维结构图?流程图?通路图?不同模型用不同视觉规范。你不指定,AI 就靠猜,大部分时候猜错。
✅ 修正: 永远指定模型类型:"Mechanism diagram of X"、"3D conceptual model of X"、"Signaling pathway of X"、"Flowchart model of X"。
2. 不指定抽象层级。 一张「细胞模型」可能是:
- 电镜风格的照片级图像
- 带标签细胞器的教科书卡通
- 只有三个圆圈的极简图标
- 画了 40 个蛋白的详细通路
AI 不知道你要哪一种,就会取平均。取平均出来的东西永远是平庸垃圾。
✅ 修正: 选一个抽象层级并显式说出来——"textbook cartoon style, ~10 labeled organelles, sans-serif labels in quotes" 或 "minimalist icon style, 3 visual elements, no text"。
3. 标签内容没有加引号。 像 Mitochondria、Endoplasmic Reticulum、Phosphofructokinase 这类长技术术语,在自然语言里提一下的话,AI 文字渲染器大约有 30~50% 的概率把它写错。应该用引号把它们锁死,并明确告诉模型必须原样出现。
✅ 修正: 在 prompt 里写 Labels: "Mitochondria"、"Golgi Apparatus"、"Nucleus"——每个引号里的标签必须原样出现。
更多关于标签准确率的细节可以看Gemini Nano Banana 科研图 prompt 指南。
真正能跑通的 6 个 prompt 套路
每一个套路都包含:什么时候用、模板、示例、常见错误。
套路 1:机制模型
什么时候用: 你要展示某个过程是怎么走的——信号级联、代谢通路、酶催化循环。
模板:
{aspect ratio} {style} mechanism model of {process name}.
Show sequential steps: {step 1} → {step 2} → {step 3} → {step 4}.
Label each step with quoted names: "{label 1}", "{label 2}", "{label 3}".
{visual constraints: color palette, background, no watermark}
(注:模板用英文写 prompt 是因为 AI 模型对英文 prompt 响应更稳定。)
示例:
16:9 clean scientific mechanism model of insulin receptor signaling.
Show sequential steps: insulin binding → IRS1 phosphorylation → PI3K activation → AKT activation → GLUT4 translocation → glucose uptake.
Label each step with quoted names: "Insulin", "IRS1", "PI3K", "AKT", "GLUT4", "Glucose".
Palette: blue + amber, white background, no watermark, sans-serif labels.
常见错误: 步骤太多(保持在 8 步以内)、没有指明箭头方向、标签没加引号。
套路 2:结构模型
什么时候用: 你要展示一个生物或化学结构的组成——细胞器、蛋白结构域、药物-受体结合口袋。
模板:
{aspect ratio} {style} structural model of {subject}.
Cross-section view showing: {component 1}, {component 2}, {component 3}.
Label each component with quoted names: "{label 1}", "{label 2}", "{label 3}".
Scale bar: "{scale}". {visual constraints}
示例:
1:1 textbook cartoon structural model of a eukaryotic cell.
Cross-section view showing: nucleus, mitochondria, endoplasmic reticulum, golgi, ribosomes, lysosomes.
Label each component with quoted names: "Nucleus", "Mitochondria", "Endoplasmic Reticulum", "Golgi Apparatus", "Ribosomes", "Lysosomes".
Scale bar: "10 μm". Palette: soft blue + green + peach, white background, sans-serif labels, no watermark.
常见错误: 没说是剖面图还是表面图还是爆炸图、忘了比例尺、标签挤成一团。
套路 3:概念/系统模型
什么时候用: 你要展示多个组件之间的关系——气候反馈回路、生态系统关系、某个研究问题的因果模型。
模板:
{aspect ratio} {style} conceptual systems model of {system}.
Show the relationships between: {component A}, {component B}, {component C}, {component D}.
Arrows indicate: {direction of influence / flow / feedback}.
Label each component with quoted names and label each arrow with quoted relationship names.
{visual constraints}
示例:
16:9 minimalist conceptual systems model of the carbon cycle.
Show the relationships between: "Atmospheric CO2", "Ocean", "Forests", "Soil", "Human Activity".
Arrows indicate: absorption, emission, fixation, respiration, industrial release.
Label each arrow with quoted names: "Absorption", "Emission", "Fixation", "Respiration", "Industrial".
Palette: green + blue + gray, clean lines, sans-serif labels, no watermark.
常见错误: 箭头没标文字(读者不知道每根箭头是什么意思)、组件太多、箭头风格不统一。
套路 4:对比模型
什么时候用: 你要并排展示两种或更多状态——健康 vs 病变组织、野生型 vs 突变型、治疗前 vs 治疗后。
模板:
{aspect ratio} side-by-side comparison model.
Left panel: {state A} — show {features A}. Label: "{state A}".
Right panel: {state B} — show {features B}. Label: "{state B}".
Highlight differences with {markers, arrows, or circles}.
{visual constraints}
示例:
16:9 side-by-side comparison model of neuronal synapse states.
Left panel: healthy synapse — show normal vesicle release, proper receptor density, clean cleft. Label: "Healthy Synapse".
Right panel: diseased synapse — show reduced vesicles, sparse receptors, debris in cleft. Label: "Alzheimer's Disease".
Highlight differences with red circles. Palette: blue + red accent, white background, sans-serif labels, no watermark.
常见错误: 两个面板的尺度或视角对不上(没法比较)、缺状态标签、差异太弱看不出来。
套路 5:数学/定量模型
什么时候用: 你要展示变量之间的关系——生长曲线、剂量响应、相图。注意:如果是真实数据,应该用 R / Python / Prism。这个套路专门用来画 概念性 表达。
模板:
{aspect ratio} conceptual graph showing {y-variable} vs. {x-variable}.
Curve shape: {shape - linear, sigmoid, exponential, bell curve}.
X-axis label: "{label}". Y-axis label: "{label}".
Annotate key regions: "{region 1}", "{region 2}".
Clean scientific chart style, no grid, no watermark.
示例:
16:9 conceptual graph showing drug concentration vs. response.
Curve shape: sigmoid S-curve.
X-axis label: "Log [Drug] (M)". Y-axis label: "Response (%)".
Annotate key regions: "Threshold", "EC50", "Saturation".
Clean scientific chart style, sans-serif axes, no grid, no watermark.
常见错误: 让 AI 画 真实 数据(它不会——去用统计工具)、漏了坐标轴标签、刻度不一致。
套路 6:物理/机械模型
什么时候用: 物理或工程论文——受力图、光路图、电路示意图、流体流动图。
模板:
{aspect ratio} {style} physical model of {setup}.
Components: {component 1}, {component 2}, {component 3}.
Show: {flow / force / signal path} with directional arrows.
Label components with quoted names. Include {measurements / units / scale}.
Engineering schematic style, no watermark.
示例:
16:9 clean engineering schematic of a laser interferometer.
Components: "Laser Source", "Beam Splitter", "Mirror M1", "Mirror M2", "Detector".
Show: light path with red arrows from laser through beam splitter to mirrors and detector.
Include wavelength: "632.8 nm". Engineering schematic style, sans-serif labels, no watermark.
常见错误: 组件之间没有连接线、没有方向箭头、线条风格不统一。
什么时候应该放弃 AI 模型生成,改用别的工具
三种情况应该换工具:
1. 你需要真实的分子坐标。 用 AlphaFold、ChimeraX 或 PyMOL。AI 图像生成器给你的只是「看起来像某个分子」的外观,并不是真实的三维结构。审稿人问「这是不是正确的蛋白折叠?」的时候,你没法用一张 AI 图来回答。
2. 你需要真实的仿真结果。 流体动力学、有限元、Monte Carlo——用 MATLAB、COMSOL、Python + NumPy,或专业仿真软件。AI 可以在你拿到数据之后帮你画概念图,但不会替你算数据。
3. 你需要精确的定量数据图。 用 R、Python、GraphPad Prism 或 Origin。AI 生成的图只是示意,不是真实数据。
而对于那些漂浮在真实仿真结果 之上 的 2D 概念模型图——「我们研究的是这样一个系统」——AI 生成器经常是最快达到发表质量的路径。
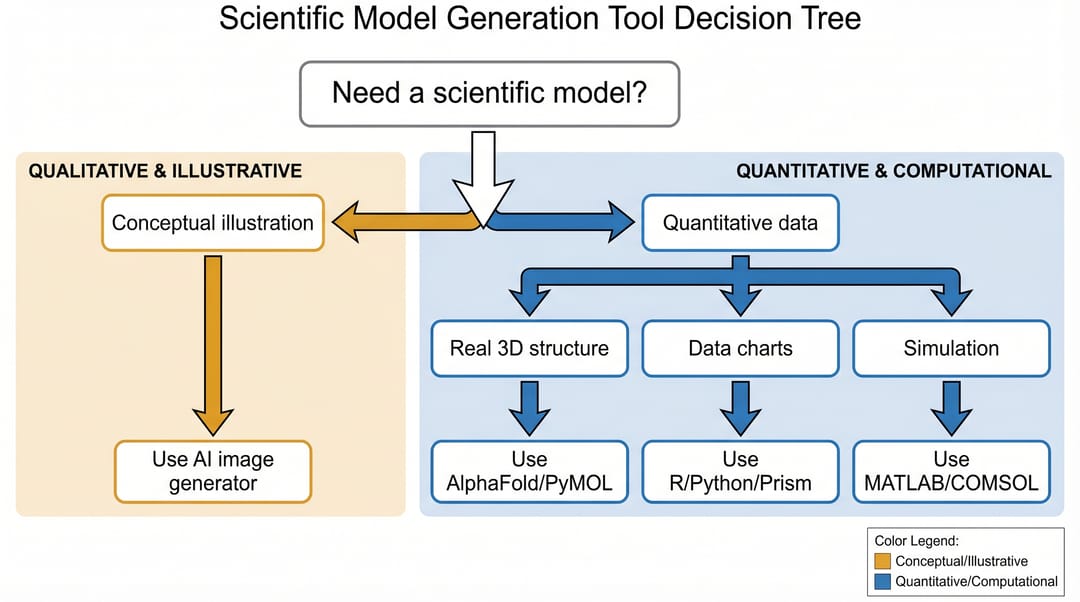 决策树:概念示意图用 AI,真实定量输出用仿真或统计工具。
SciDraw AI 在科研模型生成里扮演什么角色
SciDraw AI 的模型:
- 训练数据是科研图数据集(不是通用图像数据集),所以它知道「机制模型」或「剖面模型」到底该长什么样
- 默认就支持上面那 6 个 prompt 套路
- 导出 SVG,可以在 Illustrator、Inkscape 或 PowerPoint 里继续改
- 免费档位:每月 50 点数,足够生成 10 张模型图
可以到 sci-draw.com/ai-drawing 试用,或者在 /scientific-drawing 看产品说明。
按角色对号入座的用法
- 你是研究生,正在写人生第一条 AI 科研模型 prompt: 直接复制上面任意一个模板,填进自己的参数,然后迭代。最多浪费 2~3 次尝试就能跑通。
- 你是博后,正在写综述论文: 套路 3(概念系统模型)是你用得最多的那一个。组件数保持在 6 以内。
- 你是课题组长,要给实验室选工具: 如果做蛋白结构,AlphaFold + PyMOL 还是首选。如果做概念示意图的工作,AI 模型生成器每张图能省几个小时。
- 你是医学插画师: 套路 2(结构)和套路 4(对比)是主力。AI 帮你跑到 80% 的草稿,剩下 20% 由你来精修。
科研模型的本质是一次有意识的简化。AI 生成器的任务是把你脑中已经存在的那个简化原封不动输出出来——不是把它变漂亮、也不是替你加戏,只是把你已经想清楚的那张图画出来。
👉 在 SciDraw AI 上免费生成你的第一张科研模型图
相关阅读
- Gemini Nano Banana 科研图 prompt 指南 — 某个模型的标签准确率套路
- 2026 最好用的科研示意图 AI 工具 — 8 工具基准测试
- 科研插图怎么画 — 7 条原则 playbook
- 科研视觉内容到底是什么 — 6 大视觉类别
- AI 科学插图 — 插画风格输出的产品页
- 科研示意图制作工具 — 机制图/流程图构建器