Бесплатный генератор кривой нормального распределения
Создайте подписанный график нормального распределения из текста
Опишите среднее, стандартное отклонение и любые выделенные области вероятности или z-оценки — ИИ нарисует чистую профессиональную кривую нормального распределения, готовую для домашних заданий по статистике, научных статей и презентаций.
Примеры кривых нормального распределения
Нажмите на любой пример, чтобы загрузить его запрос, или используйте как основу для собственного графика нормального распределения.
Что делает этот генератор кривой нормального распределения?
Он преобразует текстовое описание нормального распределения в чистый, подписанный график кривой нормального распределения. Вы задаёте среднее и стандартное отклонение (и при необходимости z-оценки, процентили или выделенные области вероятности), а ИИ строит правильно пропорциональную кривую Гаусса с чётко обозначенными осями, аннотированными опорными линиями и цветными заливками областей — без таблиц и программирования.
Зачем использовать генератор кривой нормального распределения
- Нормальные распределения встречаются в статистике, психологии, педагогике, технике и медицине — наглядные визуализации необходимы для эффективного общения.
- Создание публикационного качества кривой в Excel или R требует трудоёмкого форматирования, отвлекающего от анализа.
- Студенты, изучающие эмпирическое правило (68–95–99,7%), получают огромную пользу от чётко выделенной диаграммы.
- Преподавателям и исследователям нужны быстрые, презентабельные рисунки для слайдов, учебников и отчётов.
- Изменить параметры (среднее, СО, выделенную область) и пересоздать гораздо быстрее, чем вручную редактировать код графика.
Как построить график нормального распределения
Укажите среднее и стандартное отклонение вашего распределения. Затем опишите все нужные визуальные элементы: выделенные области вероятности (например, ±1 СО, ±2 СО, конкретный диапазон), подписи z-оценок или отметки процентилей, вертикальные опорные линии и подписи осей. Для сравнения двух групп задайте параметры каждой кривой и укажите, нужно ли их перекрытие. Сгенерируйте рисунок, проверьте подписи и пропорции, уточните описание при необходимости.
Части графика нормального распределения
- Кривая нормального распределения — симметричная, одновершинная гауссова функция плотности вероятности.
- Среднее (μ) — центр распределения, отмеченный вертикальной линией или подписью на оси X.
- Стандартное отклонение (σ) — разброс данных; деления на ±1σ, ±2σ, ±3σ являются стандартными.
- Выделенные области — цветные зоны под кривой, представляющие вероятность или долю (например, 68,2%, 95,4%, 99,7%).
- Z-оценки — стандартизированные значения на оси X, показывающие, на сколько СО точка удалена от среднего.
- Хвостовые области — крайние левые или правые части кривой, часто выделяемые для обозначения уровней значимости или критических областей.
Часто задаваемые вопросы о генераторе кривой нормального распределения
Что такое кривая нормального распределения?
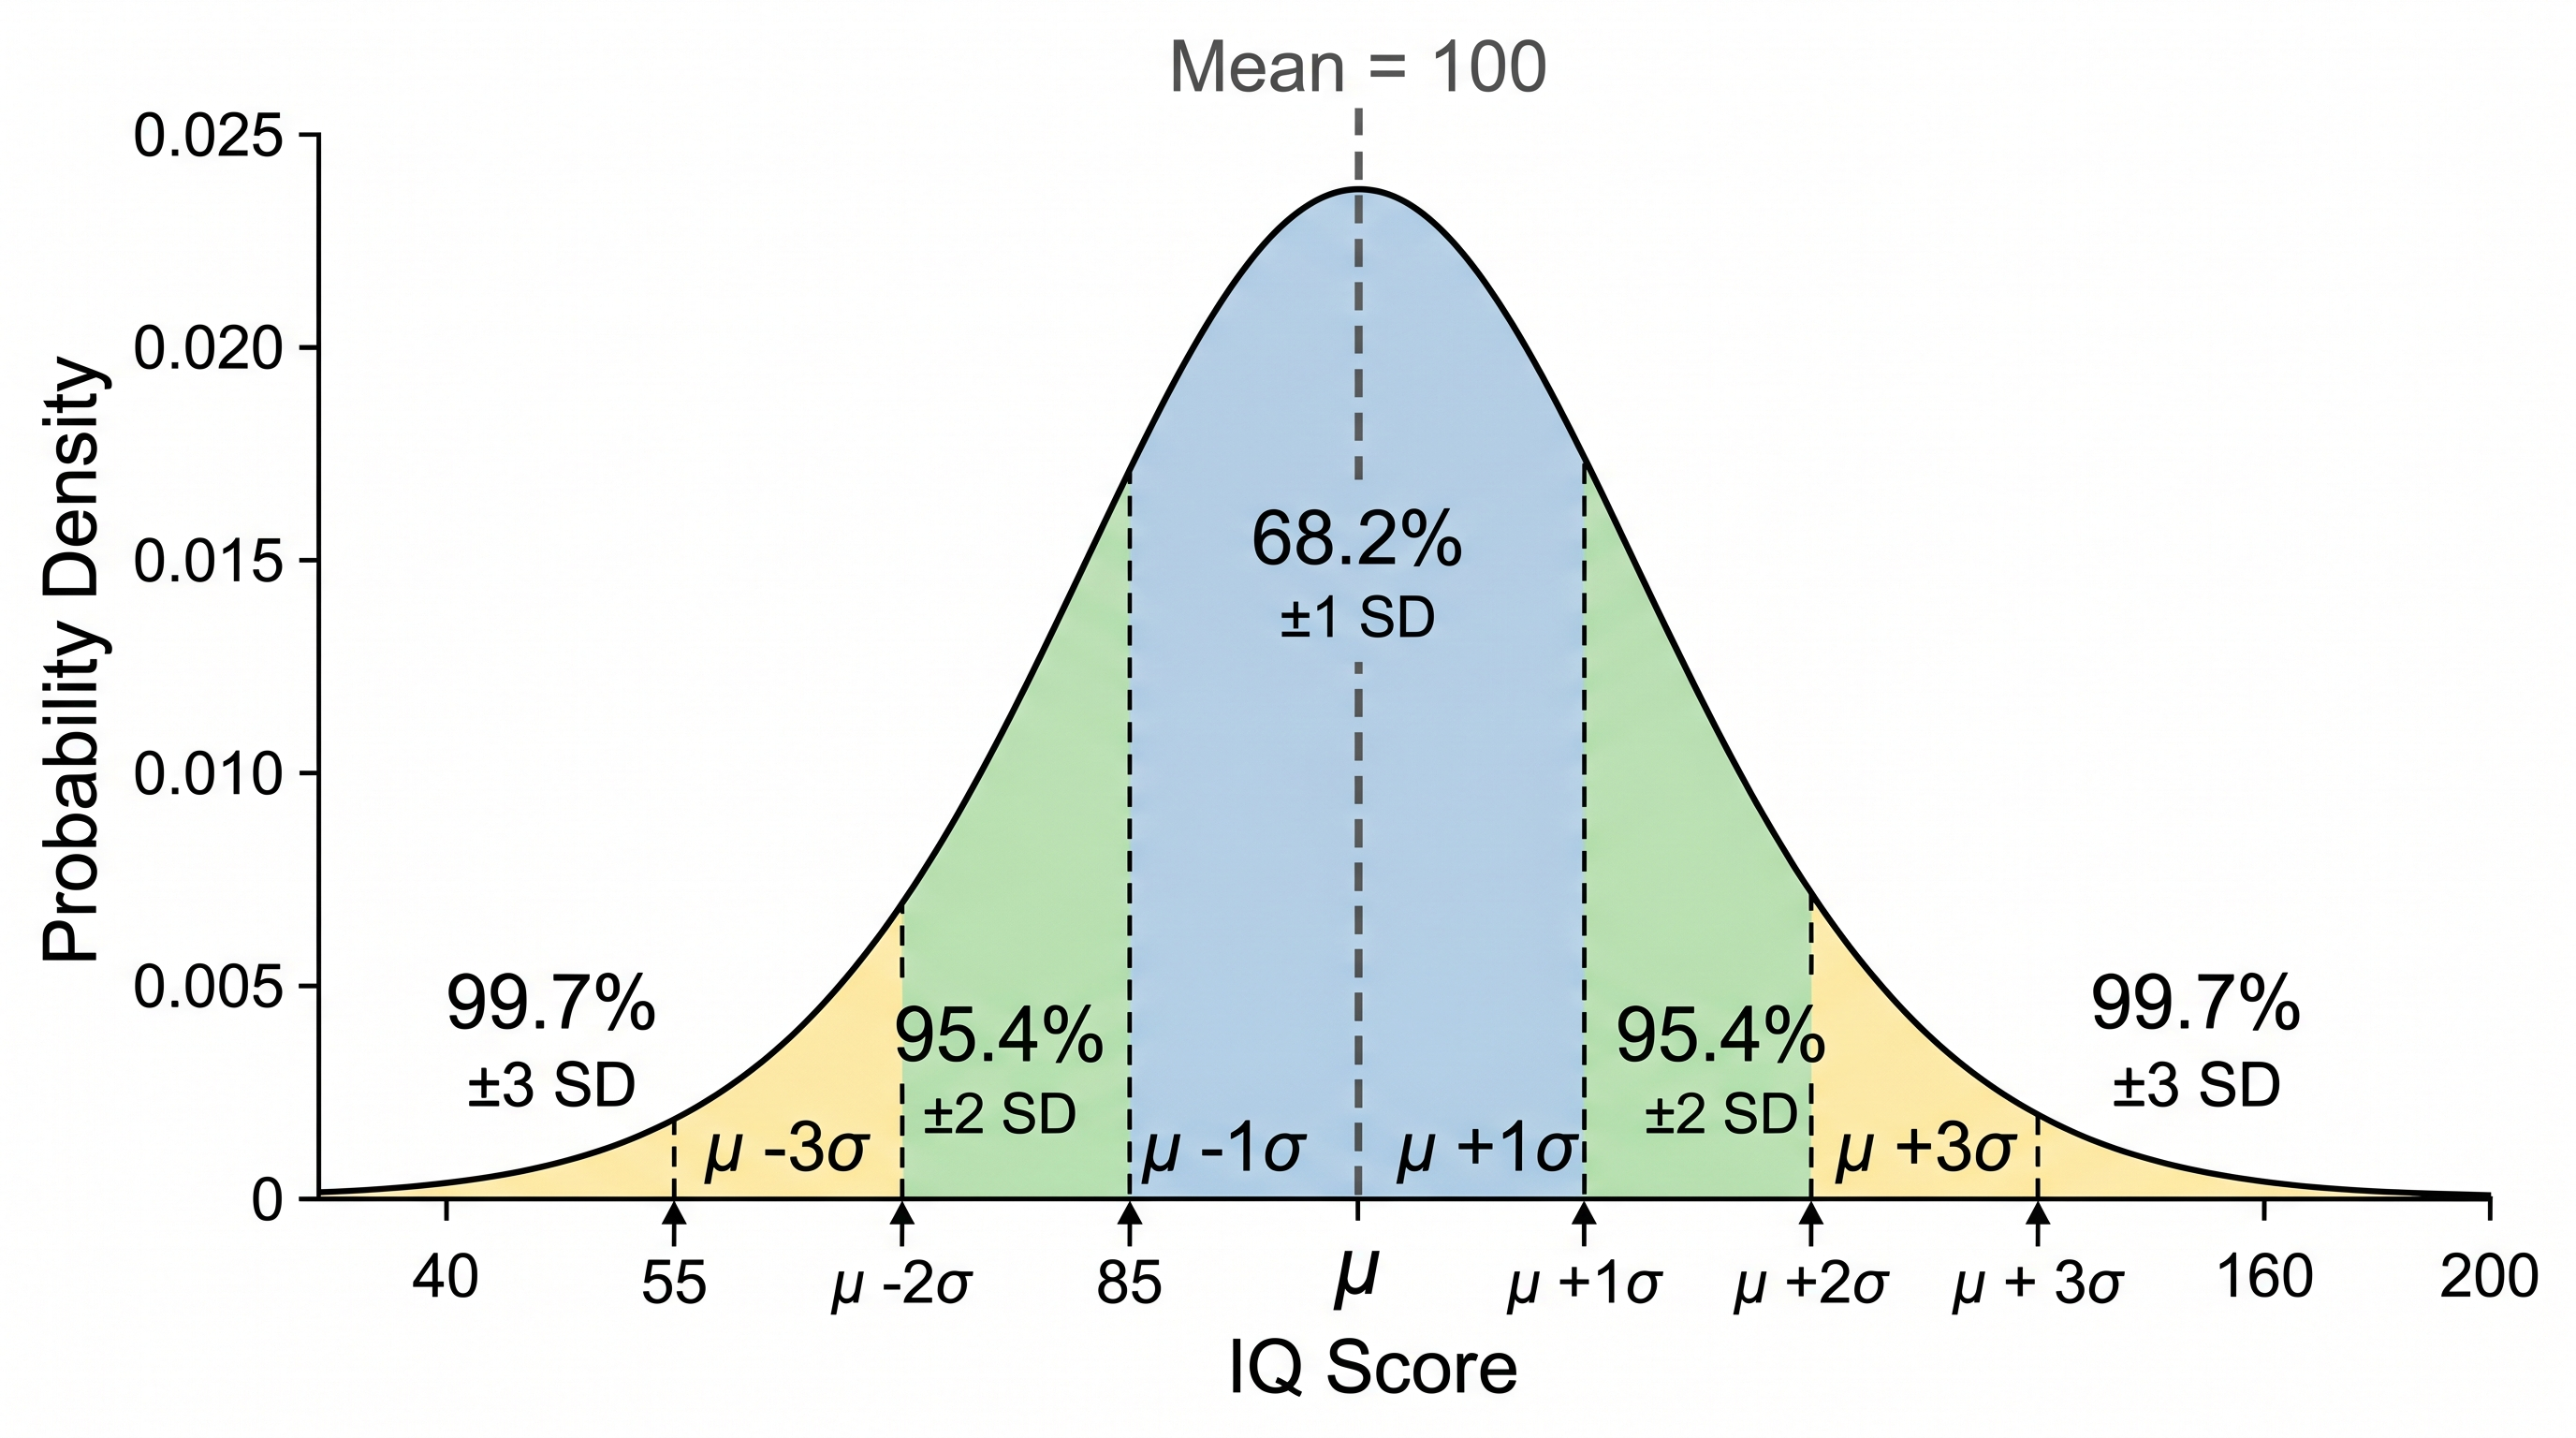
Кривая нормального распределения — это график нормального (гауссова) распределения вероятностей. Она симметрична относительно среднего, большинство значений сосредоточено вблизи центра, и всё меньше значений встречается ближе к хвостам, образуя характерную колоколообразную форму.
Что такое эмпирическое правило (68–95–99,7)?
Эмпирическое правило гласит, что для нормального распределения примерно 68,2% значений попадают в диапазон ±1 стандартного отклонения от среднего, 95,4% — в пределах ±2 СО, и 99,7% — в пределах ±3 СО. Вы можете попросить генератор автоматически выделить эти полосы.
Можно ли выделить конкретную область вероятности или хвостовую зону?
Да — опишите нужную область, например: «выделить область левее x = 85» или «выделить между z = −1,96 и z = +1,96 и подписать как 95%». ИИ заполнит и аннотирует указанную область.
Как создать стандартную нормальную кривую (z-оценки)?
Укажите среднее = 0 и стандартное отклонение = 1 и попросите добавить метки z-оценок при −3, −2, −1, 0, 1, 2, 3. Это стандартное нормальное распределение, используемое в z-таблицах и проверке гипотез.
Подходит ли для курсов статистики или научных статей?
Да. Генератор создаёт чистые, подписанные рисунки, подходящие для домашних заданий, лабораторных отчётов, постеров и публикаций. Всегда проверяйте, что параметры и выделенные области соответствуют вашим данным, прежде чем использовать рисунок в официальном отчёте.
Это бесплатно?
Каждая генерация расходует небольшое количество кредитов. Новые аккаунты получают бесплатные кредиты, поэтому вы можете создать кривую нормального распределения без подписки.
Другие инструменты
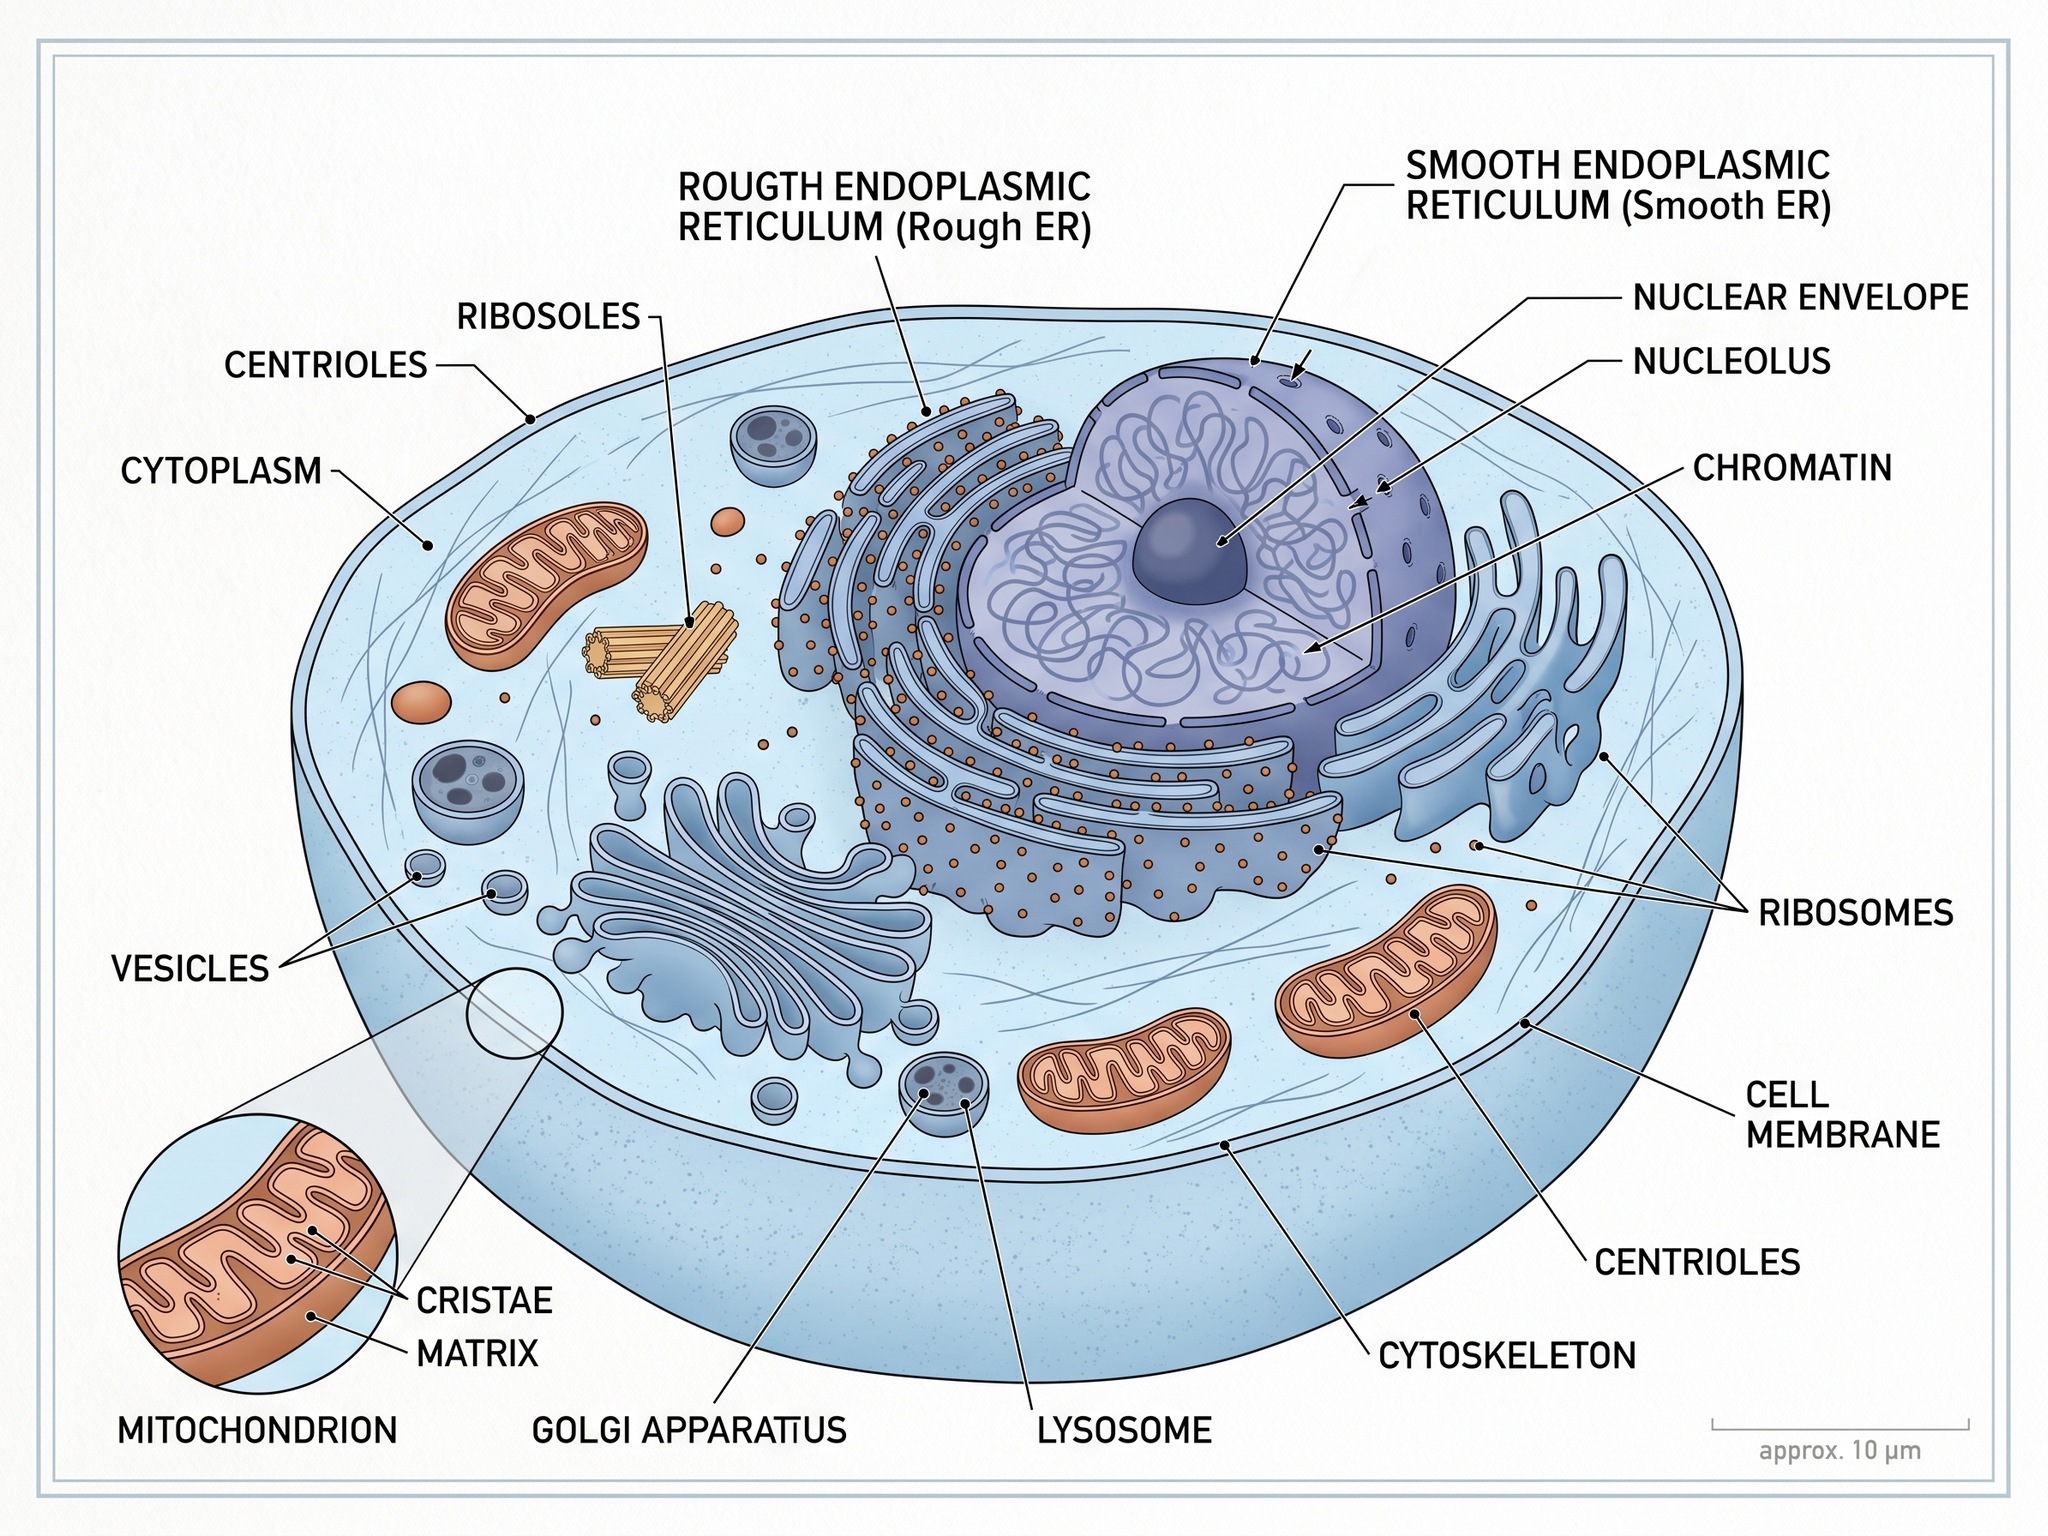
Иллюстрации для учебников
Иллюстрации, адаптированные для учебников и образовательных материалов
Попробовать бесплатно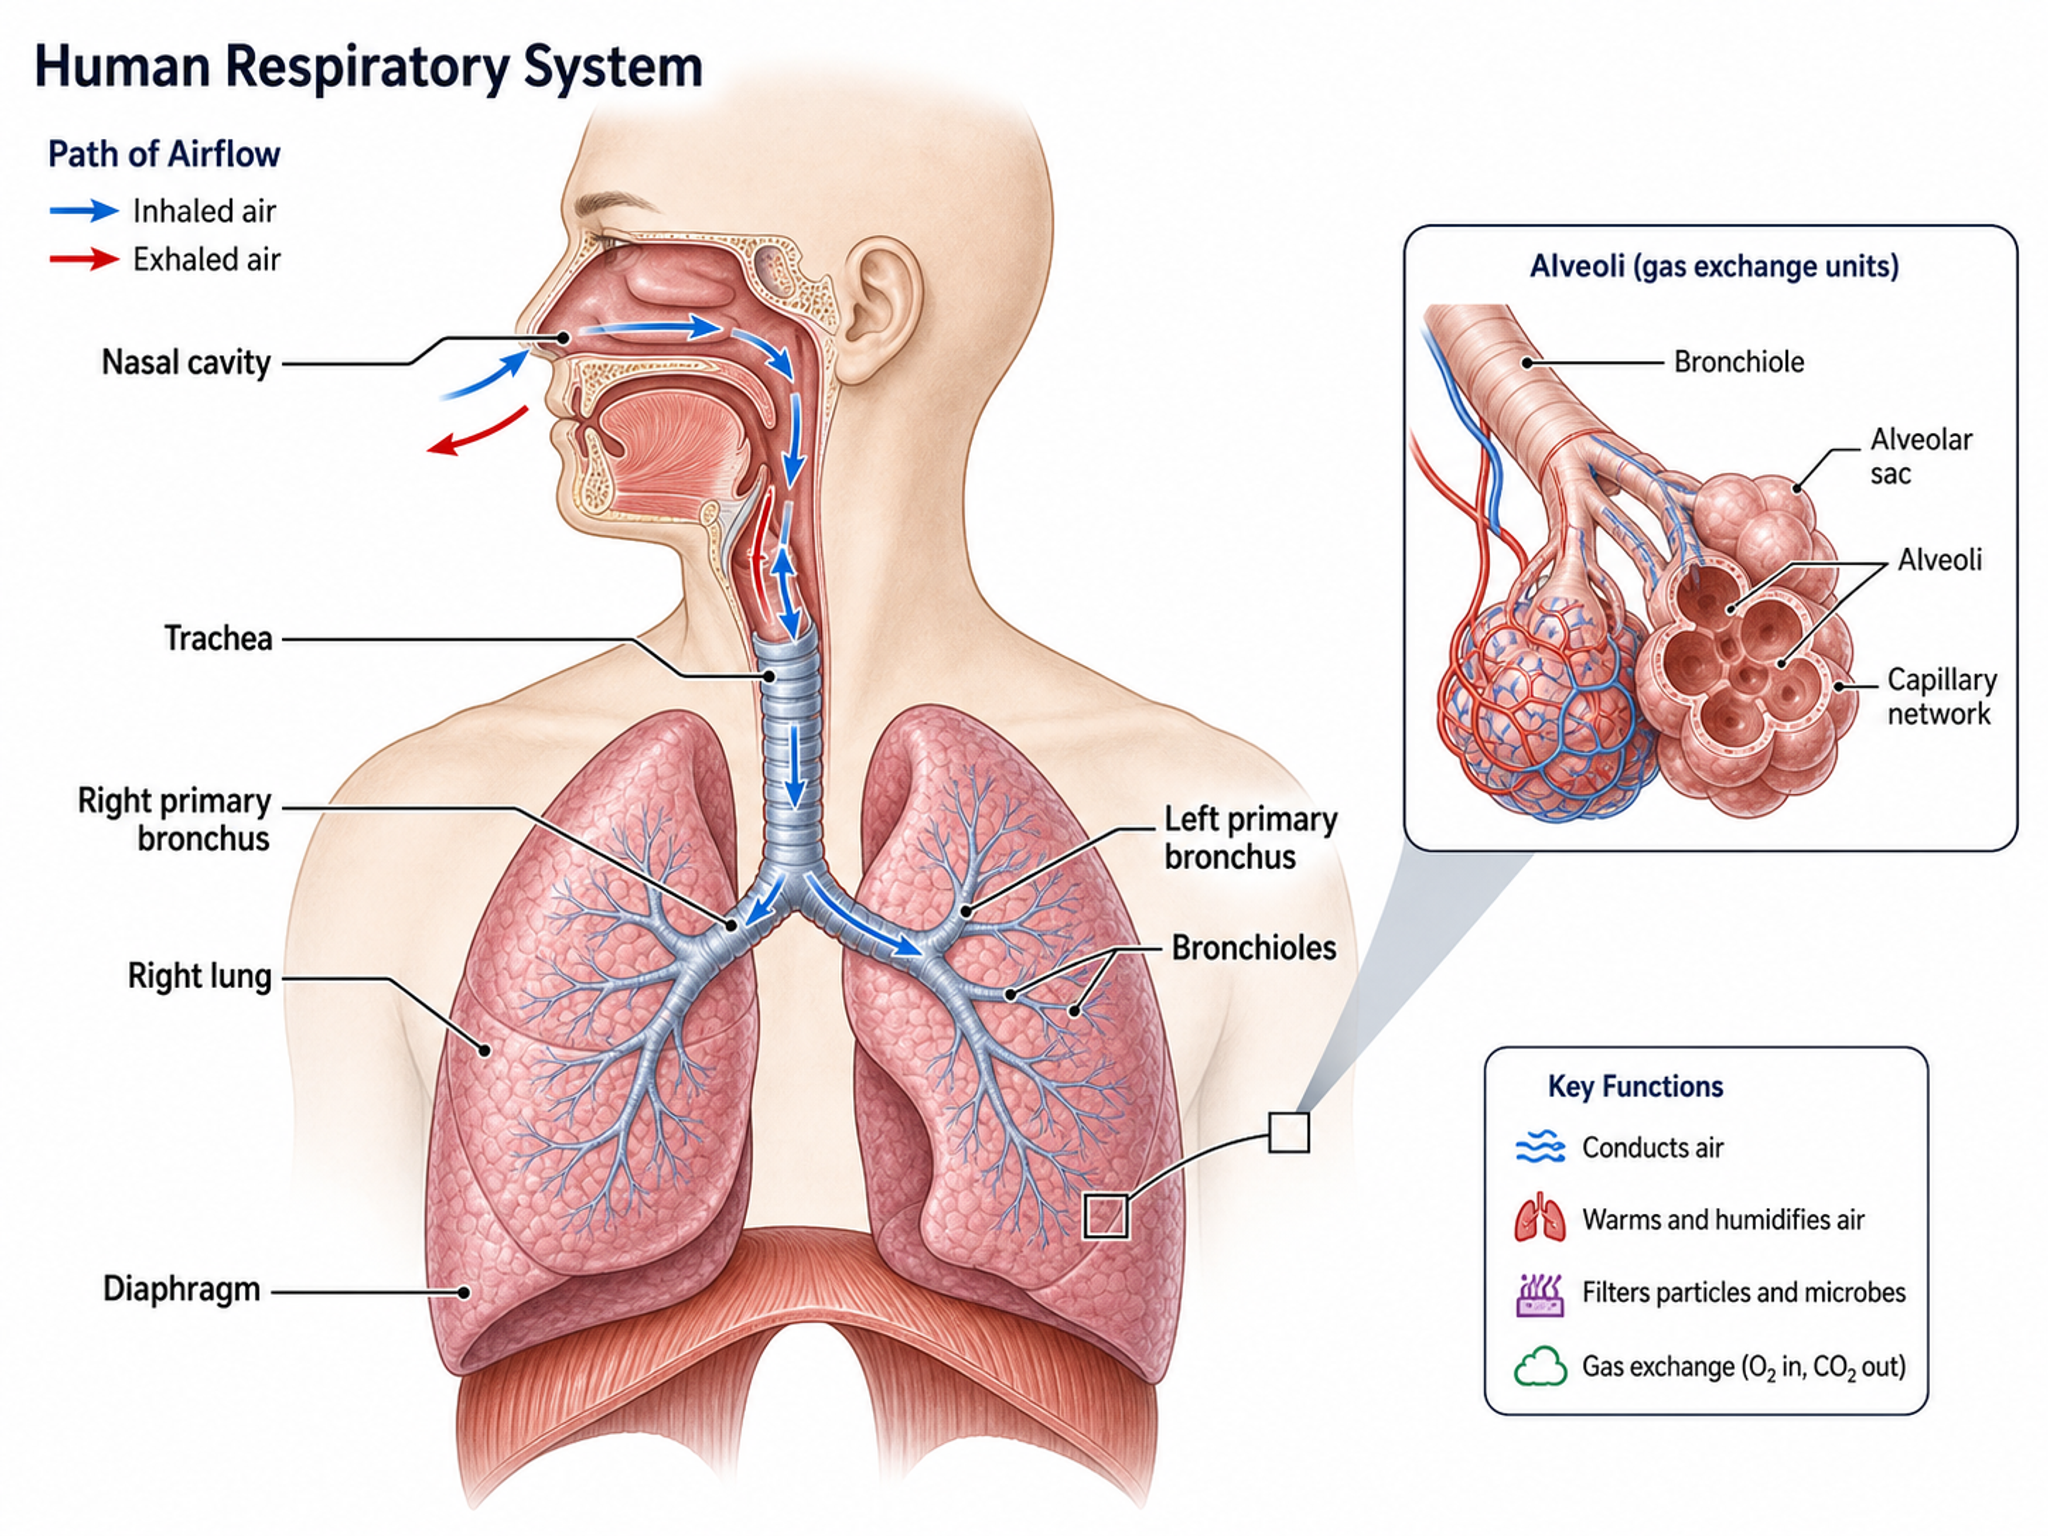
Создание иллюстраций для книг
Создавайте диаграммы для медицинских, научных и учебных книг
Попробовать бесплатно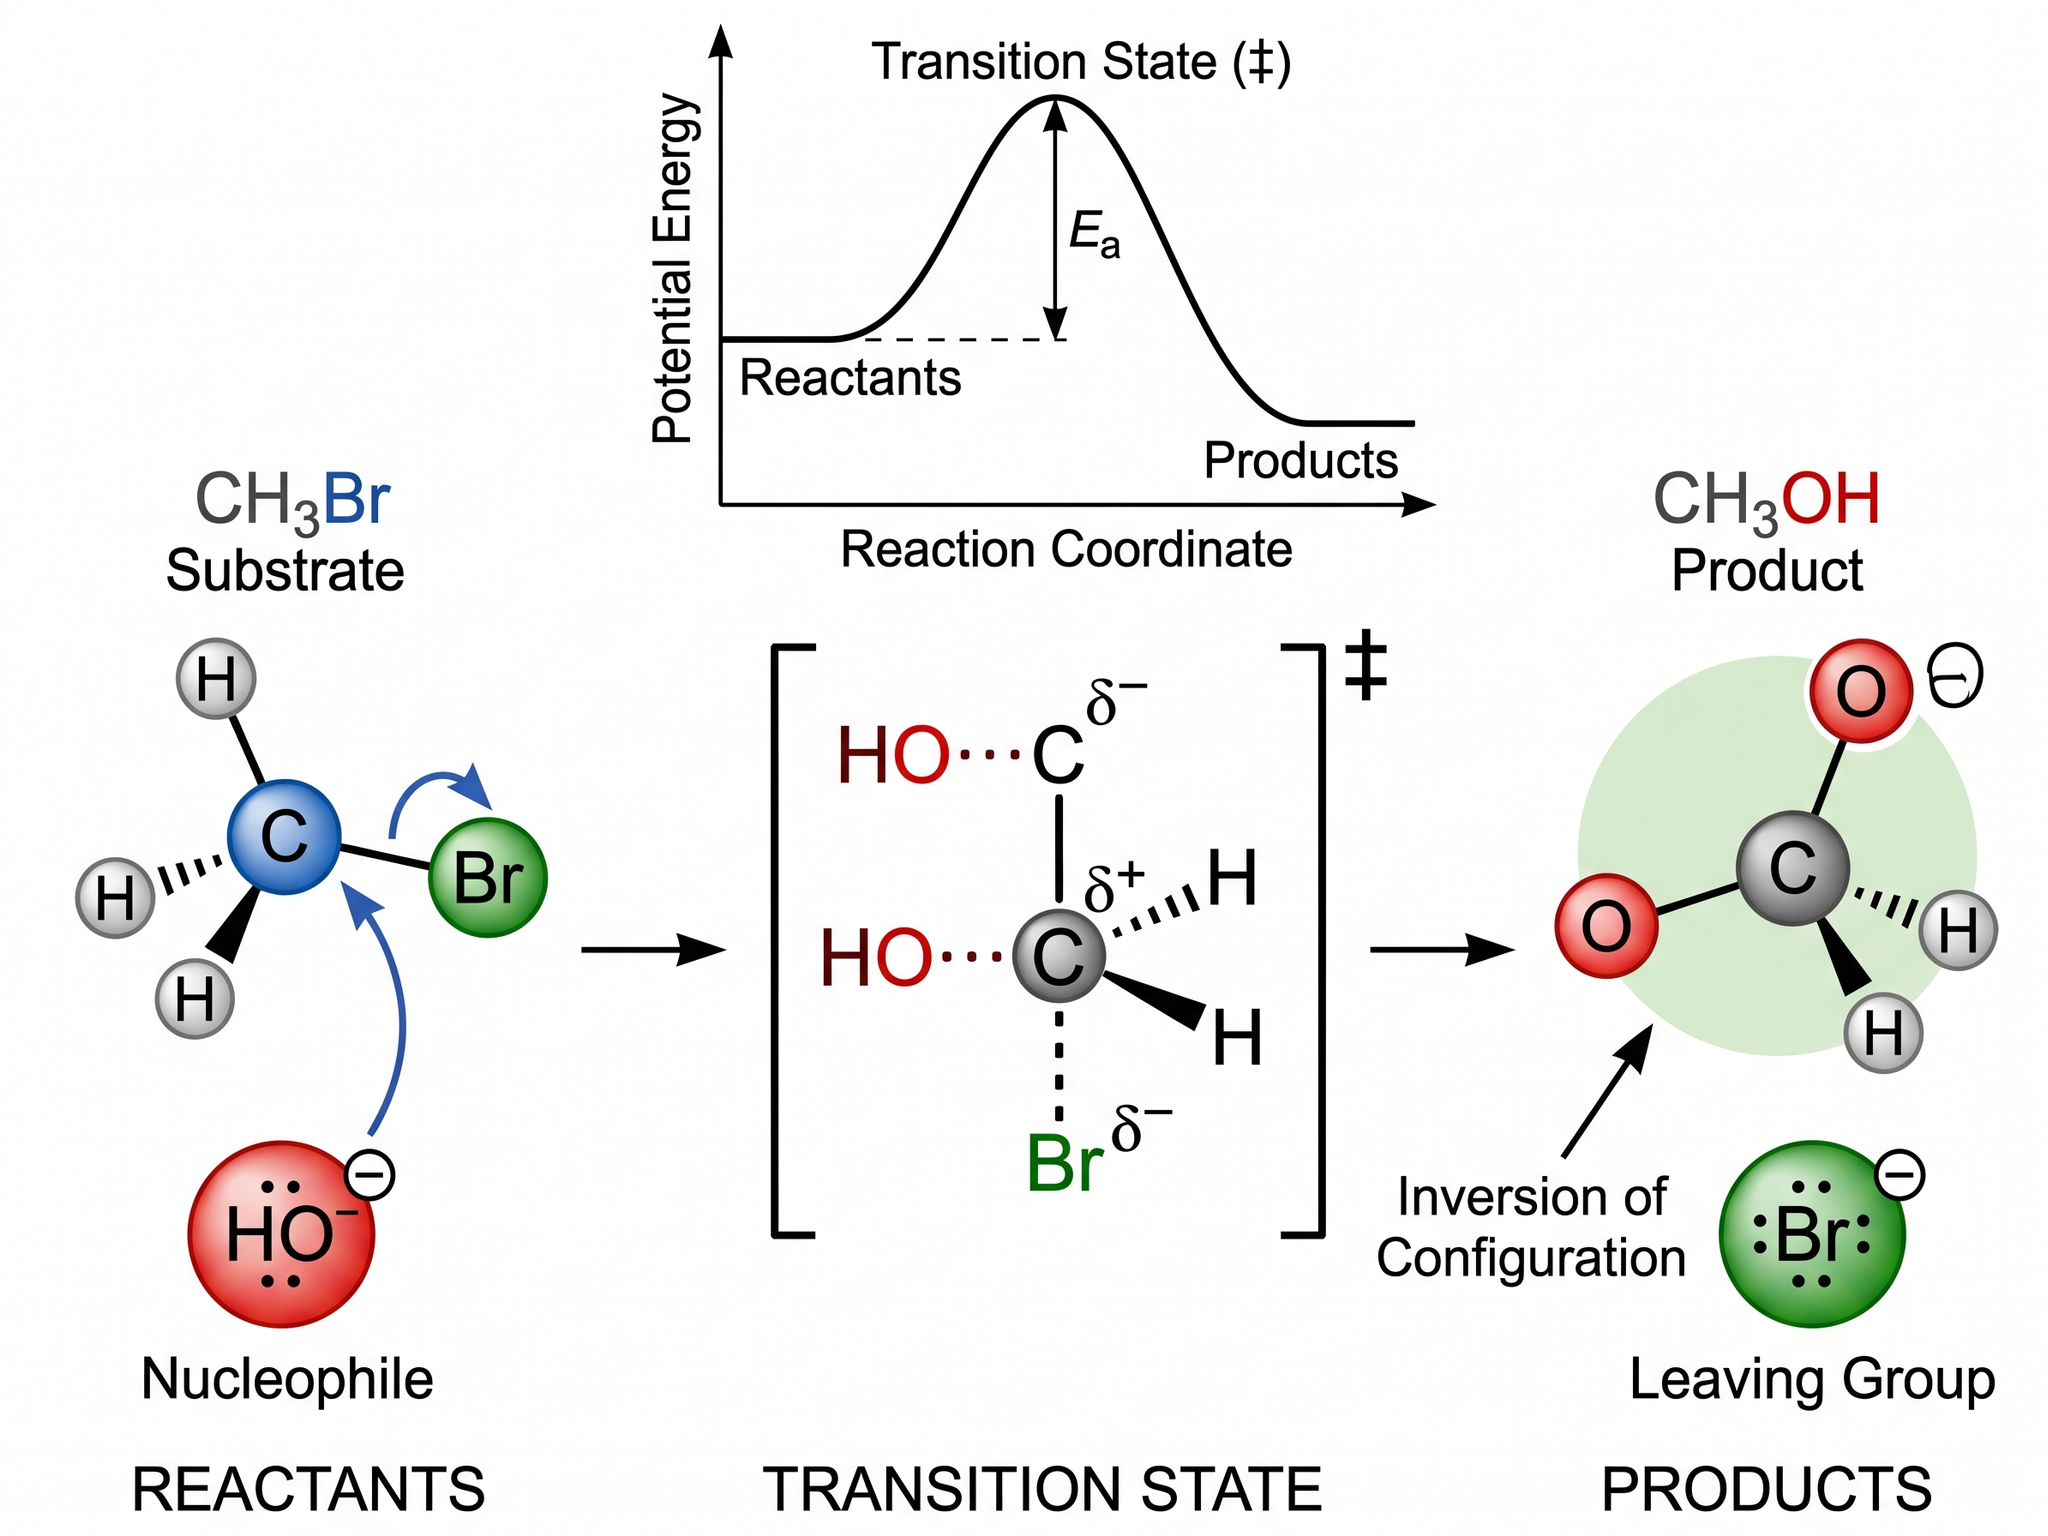
Генератор химических схем
Создавайте схемы реакций, TOC-графику и молекулярные визуализации
Попробовать бесплатноНужны другие статистические или научные графики?
Создавайте диаграммы рассеяния, гистограммы, ящичные диаграммы и другие научные рисунки с помощью SciDraw AI.